

Optimal intensive care outcome prediction over time using machine learning
- PMID: 30427913
- PMCID: PMC6241126
- DOI: 10.1371/journal.pone.0206862
Optimal intensive care outcome prediction over time using machine learning
Abstract
Background: Prognostication is an essential tool for risk adjustment and decision making in the intensive care unit (ICU). Research into prognostication in ICU has so far been limited to data from admission or the first 24 hours. Most ICU admissions last longer than this, decisions are made throughout an admission, and some admissions are explicitly intended as time-limited prognostic trials. Despite this, temporal changes in prognostic ability during ICU admission has received little attention to date. Current predictive models, in the form of prognostic clinical tools, are typically derived from linear models and do not explicitly handle incremental information from trends. Machine learning (ML) allows predictive models to be developed which use non-linear predictors and complex interactions between variables, thus allowing incorporation of trends in measured variables over time; this has made it possible to investigate prognosis throughout an admission.
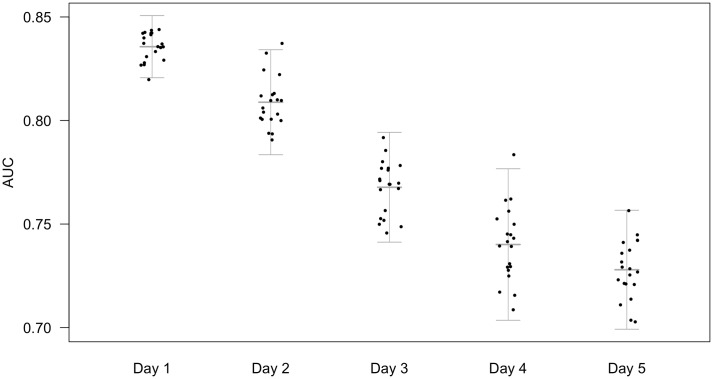
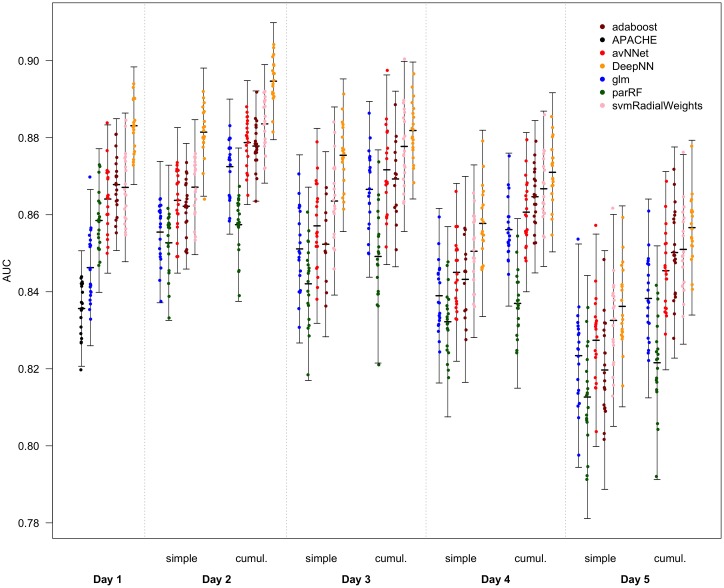
Methods and findings: This study uses ML to assess the predictability of ICU mortality as a function of time. Logistic regression against physiological data alone outperformed APACHE-II and demonstrated several important interactions including between lactate & noradrenaline dose, between lactate & MAP, and between age & MAP consistent with the current sepsis definitions. ML models consistently outperformed logistic regression with Deep Learning giving the best results. Predictive power was maximal on the second day and was further improved by incorporating trend data. Using a limited range of physiological and demographic variables, the best machine learning model on the first day showed an area under the receiver-operator characteristic curve (AUC) of 0.883 (σ = 0.008), compared to 0.846 (σ = 0.010) for a logistic regression from the same predictors and 0.836 (σ = 0.007) for a logistic regression based on the APACHE-II score. Adding information gathered on the second day of admission improved the maximum AUC to 0.895 (σ = 0.008). Beyond the second day, predictive ability declined.
Conclusion: This has implications for decision making in intensive care and provides a justification for time-limited trials of ICU therapy; the assessment of prognosis over more than one day may be a valuable strategy as new information on the second day helps to differentiate outcomes. New ML models based on trend data beyond the first day could greatly improve upon current risk stratification tools.
Conflict of interest statement
The authors have declared that no competing interests exist. No funding bodies had any role in study design, data collection and analysis, decision to publish, or preparation of the manuscript.
Figures
References
-
- Moons KG, Royston P, Vergouwe Y, Grobbee DE, Altman DG. Prognosis and prognostic research: what, why, and how? BMJ. 2009;338:b375 10.1136/bmj.b375 - DOI - PubMed
-
- Luce JM, Rubenfeld GD. Can health care costs be reduced by limiting intensive care at the end of life? American journal of respiratory and critical care medicine. 2002;165(6):750–754. 10.1164/ajrccm.165.6.2109045 - DOI - PubMed
-
- Truog RD, Campbell ML, Curtis JR, Haas CE, Luce JM, Rubenfeld GD, et al. Recommendations for end-of-life care in the intensive care unit: a consensus statement by the American College of Critical Care Medicine. Critical care medicine. 2008;36(3):953–963. 10.1097/CCM.0B013E3181659096 - DOI - PubMed
-
- Sprung CL, Cohen SL, Sjokvist P, Baras M, Bulow HH, Hovilehto S, et al. End-of-life practices in European intensive care units: the Ethicus Study. Jama. 2003;290(6):790–797. 10.1001/jama.290.6.790 - DOI - PubMed
-
- Cook D, Rocker G, Marshall J, Sjokvist P, Dodek P, Griffith L, et al. Withdrawal of mechanical ventilation in anticipation of death in the intensive care unit. New England Journal of Medicine. 2003;349(12):1123–1132. 10.1056/NEJMoa030083 - DOI - PubMed
Publication types
MeSH terms
LinkOut - more resources
Full Text Sources
Other Literature Sources
Medical
Molecular Biology Databases
