. 2018 Nov 14;13(11):e0207357.
doi: 10.1371/journal.pone.0207357. eCollection 2018.

Dynamic integration of conceptual information during learning

Affiliations

Dynamic integration of conceptual information during learning

Marika C Inhoff et al. PLoS One. .

Abstract

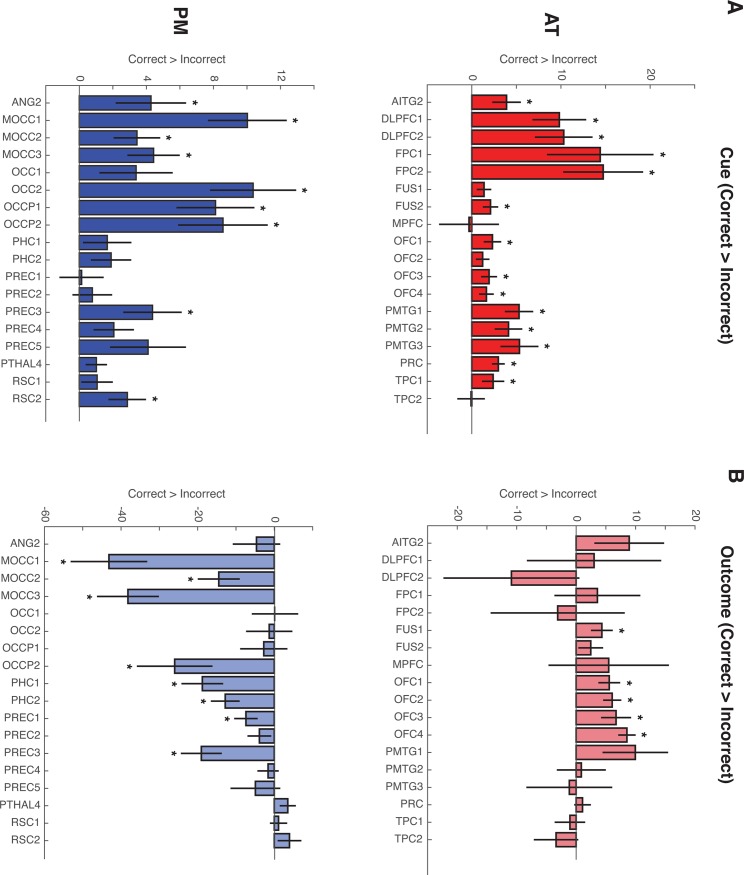
The development and application of concepts is a critical component of cognition. Although concepts can be formed on the basis of simple perceptual or semantic features, conceptual representations can also capitalize on similarities across feature relationships. By representing these types of higher-order relationships, concepts can simplify the learning problem and facilitate decisions. Despite this, little is known about the neural mechanisms that support the construction and deployment of these kinds of higher-order concepts during learning. To address this question, we combined a carefully designed associative learning task with computational model-based functional magnetic resonance imaging (fMRI). Participants were scanned as they learned and made decisions about sixteen pairs of cues and associated outcomes. Associations were structured such that individual cues shared feature relationships, operationalized as shared patterns of cue pair-outcome associations. In order to capture the large number of possible conceptual representational structures that participants might employ and to evaluate how conceptual representations are used during learning, we leveraged a well-specified Bayesian computational model of category learning [1]. Behavioral and model-based results revealed that participants who displayed a tendency to link experiences in memory benefitted from faster learning rates, suggesting that the use of the conceptual structure in the task facilitated decisions about cue pair-outcome associations. Model-based fMRI analyses revealed that trial-by-trial integration of cue information into higher-order conceptual representations was supported by an anterior temporal (AT) network of regions previously implicated in representing complex conjunctions of features and meaning-based information.


Conflict of interest statement

The authors have declared that no competing interests exist.

Figures

Fig 1
Fig 1. Task structure.
Sixteen unique trial sequences of Cue 1, Cue 2, and outcome objects were constructed for each participant. In this example task structure, Cue 1 objects are presented along the y-axis, Cue 2 are objects presented along the x-axis, and associated Outcomes are presented in the center of the grid. For example, when the magenta Cue 1 is paired with the green Cue 2, the associated outcome is a glove. Individual cue objects each have a 50% chance of association with a Hat or Glove category outcome, requiring participants to use information about the Cue 1 –Cue 2 pair to make correct decisions. Cue 1—Cue 2—Outcome associations were fully crossed to create four pairs of cue objects that share feature relationships (highlighted in yellow). For example, both the magenta and yellow Cue 1 objects are associated with a glove category outcome when paired with the purple or green Cue 2 object and a hat category outcome when paired with the blue or tan Cue 2 object. This design gives rise to four groupings of Cue 1—Cue 2—Outcome associations where the corresponding cue objects create triplets with maximal conceptual overlap (highlighted in grey).
Fig 2
Fig 2. Trial sequence during scanned learning.
Participants were presented with Cue 1, Cue 2 and Outcome feedback information sequentially.
Fig 3
Fig 3. Learning performance.
On average, participants gradually learned to choose outcomes correctly across six runs of scanned learning, however there was a large amount of variability in individual participant performance. Chance performance (50%) is plotted by a dashed line. Mean subject performance plotted in black. Individual subject learning curves plotted in grey. Error bars reflect standard error of the mean. * p < .05, binomial test.
Fig 4
Fig 4. Individual participant behavioral model fits.
Iteration through each full set of 16 cue pair-outcome associations is plotted on the x-axis (iterations 1 through 3 correspond to Run 1, iterations 4 through 6 correspond to Run 2, and so on). Accuracy (proportion correct) is plotted along the y-axis. Each participant’s learning performance is plotted in red with the corresponding RMC learning curve in blue. On average, the RMC provides a good fit to the observed behavioral data.
Fig 5
Fig 5. Larger coupling probabilities are associated with faster learning rates.
Individual subject coupling probabilities, or a model-derived metric where higher values reflect a stronger tendency to link information in memory, is positively associated with the rate of learning.
Fig 6
Fig 6. Activation profile similarity analysis.
Regions within the PM and AT networks show high within but not between network activation profile similarity. (A) Activation profile similarity values were assessed by correlating mean z-transformed contrast values from each ROI extracted from each of the four contrasts of interest (Model–Cue-based prediction, Model–Feedback-based updating, Accuracy–Cue: Correct > Incorrect, Accuracy–Outcome: Correct > Incorrect). Higher correlation values indicate that a pair of ROIs displayed a more similar pattern of activation across contrasts. (B) Activation profile similarity correlations were significantly higher between ROIs that were from within the same network relative to across different networks. Grey-shaded box denotes standard deviation. Red shaded box denotes 95% confidence interval. Individual participant activation profile similarity values plotted in black. *** p < .0001.
Fig 7
Fig 7. Model- and accuracy-based analyses in the PM and AT networks.
(A) AT network is involved in integrating cue pairs within an existing cluster. Values above zero denote greater probability of assigning cue pairs to a novel cluster. Values below zero denote greater probability of capitalizing on shared features to assign cue pairs to an existing cluster. (B) Parametric activation reflecting feedback-based updating, or incremental changes to the conceptual cluster space following feedback. Positive values reflect more updating. Values below zero denote less updating. (C) Accuracy-based univariate analyses reveal that both networks demonstrate greater activation for cue pairs associated with subsequent correct relative to incorrect predictions. (D) Outcome-related univariate activation in the PM network is significantly greater for incorrect relative to correct predictions. Error bars denote standard error of the mean. * p < .05.
Fig 8
Fig 8. Model-based analyses in individual PM and AT network ROIs.
(A) Cue-based integration: Negative values denote greater probability of capitalizing on shared features to assign cue pairs to an existing cluster, whereas positive values denote greater probability of assigning cue pairs to a novel cluster. Nearly all AT network ROIs demonstrate evidence for cue-based integration, with significant evidence for the involvement of posterior middle temporal gyrus, anterior inferior temporal gyri and temporopolar cortex. In the PM network, precuneus and retrosplenial cortex significantly track cue-based integration, whereas occipital regions are involved in assigning cue pairs to a novel conceptual cluster. (B) Feedback-based updating: Positive values denote larger changes to the conceptual cluster space following feedback, whereas negative values denote smaller changes. No individual regions in either network track the amount of Feedback-based updating. Error bars denote standard error of the mean. * p < .05.
Fig 9
Fig 9. Accuracy-based analyses in individual PM and AT network ROIs.
(A) Cue-period activity associated with Correct > Incorrect outcome judgments. The majority of PM and AT network regions display greater cue-period activation during trials that were answered correctly. (B) Outcome-related univariate activity associated with Correct > Incorrect outcome judgments. AT network ROIs, including orbitofrontal cortex and fusiform gyrus display significantly greater outcome-related activity for correctly answered trials, whereas PM network ROIs, displayed greater outcome activity during incorrect trials. Error bars denote standard error of the mean. * p < .05.

References

    1. Anderson JR. The adaptive nature of human categorization. Psychol Rev. 1991;98: 409.
    1. Murphy G. The big book of concepts. MIT press; 2004.
    1. Shea N, Krug K, Tobler PN. Conceptual representations in goal-directed decision making. Cogn Affect Behav Neurosci. 2008;8: 418–428. 10.3758/CABN.8.4.418 - DOI - PubMed
    1. Clarke A, Pell PJ, Ranganath C, Tyler LK. Learning Warps Object Representations in the Ventral Temporal Cortex. J Cogn Neurosci. 2016; 1–14. 10.1162/jocn_a_00951 - DOI - PubMed
    1. Davis T, Love BC, Preston AR. Learning the Exception to the Rule: Model-Based fMRI Reveals Specialized Representations for Surprising Category Members. Cereb Cortex. 2012;22: 260–273. 10.1093/cercor/bhr036 - DOI - PubMed

Publication types