. 2018 Nov 14;14(11):e1007415.
doi: 10.1371/journal.ppat.1007415. eCollection 2018 Nov.

Characterization of Haartman Institute snake virus-1 (HISV-1) and HISV-like viruses-The representatives of genus Hartmanivirus, family Arenaviridae

Affiliations

Characterization of Haartman Institute snake virus-1 (HISV-1) and HISV-like viruses-The representatives of genus Hartmanivirus, family Arenaviridae

Jussi Hepojoki et al. PLoS Pathog. .

Abstract

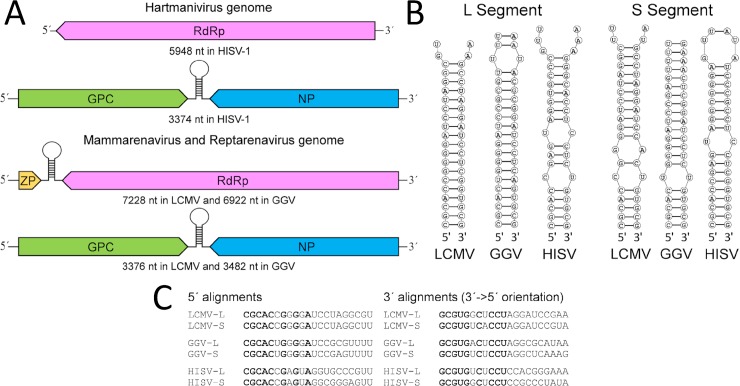
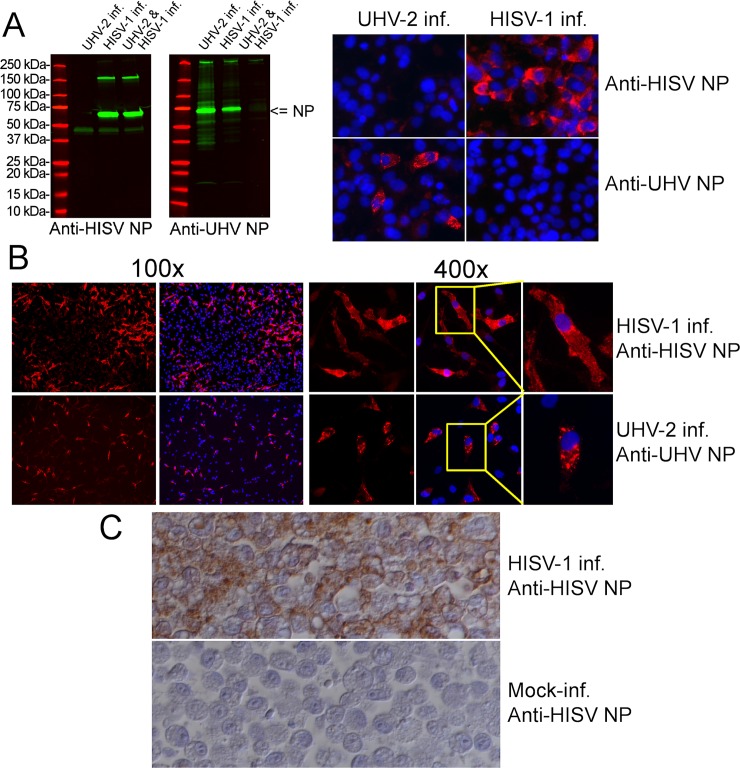
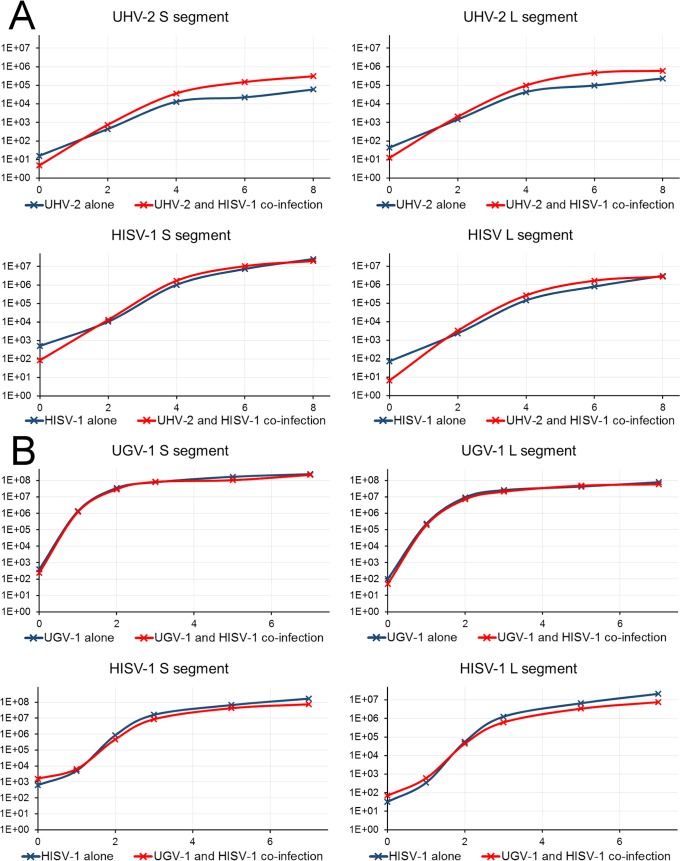
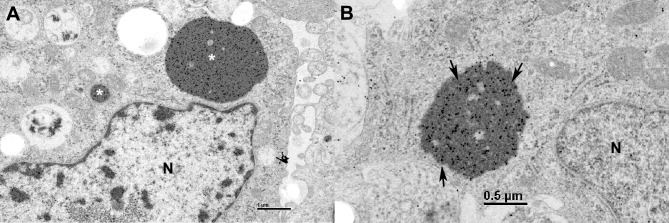
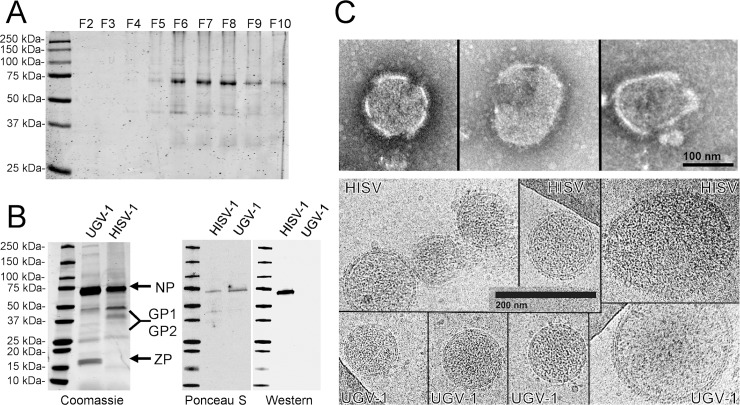
The family Arenaviridae comprises three genera, Mammarenavirus, Reptarenavirus and the most recently added Hartmanivirus. Arenaviruses have a bisegmented genome with ambisense coding strategy. For mammarenaviruses and reptarenaviruses the L segment encodes the Z protein (ZP) and the RNA-dependent RNA polymerase, and the S segment encodes the glycoprotein precursor and the nucleoprotein. Herein we report the full length genome and characterization of Haartman Institute snake virus-1 (HISV-1), the putative type species of hartmaniviruses. The L segment of HISV-1 lacks an open-reading frame for ZP, and our analysis of purified HISV-1 particles by SDS-PAGE and electron microscopy further support the lack of ZP. Since we originally identified HISV-1 in co-infection with a reptarenavirus, one could hypothesize that co-infecting reptarenavirus provides the ZP to complement HISV-1. However, we observed that co-infection does not markedly affect the amount of hartmanivirus or reptarenavirus RNA released from infected cells in vitro, indicating that HISV-1 does not benefit from reptarenavirus ZP. Furthermore, we succeeded in generating a pure HISV-1 isolate showing the virus to replicate without ZP. Immunofluorescence and ultrastructural studies demonstrate that, unlike reptarenaviruses, HISV-1 does not produce the intracellular inclusion bodies typical for the reptarenavirus-induced boid inclusion body disease (BIBD). While we observed HISV-1 to be slightly cytopathic for cultured boid cells, the histological and immunohistological investigation of HISV-positive snakes showed no evidence of a pathological effect. The histological analyses also revealed that hartmaniviruses, unlike reptarenaviruses, have a limited tissue tropism. By nucleic acid sequencing, de novo genome assembly, and phylogenetic analyses we identified additional four hartmanivirus species. Finally, we screened 71 individuals from a collection of snakes with BIBD by RT-PCR and found 44 to carry hartmaniviruses. These findings suggest that harmaniviruses are common in captive snake populations, but their relevance and pathogenic potential needs yet to be revealed.


Conflict of interest statement

The authors have declared that no competing interests exist.

Figures

Fig 1
Fig 1. The genome organization of the family Arenaviridae members.
A) The genome segments with respective sizes for the type species of the genera Hartmanivirus (HISV-1), Mammarenavirus (LCMV) and Reptarenavirus (GGV). The ORFs (ZP = Z protein, RdRp = RNA-dependent RNA polymerase, GPC = glycoprotein precursor, NP = nucleoprotein) are shown as arrows to demonstrate the direction of translation respective to genome orientation. B) Panhandle structures formed by the genome ends as predicted using DuplexFold Web Server of RNA structure (available at https://rna.urmc.rochester.edu/RNAstructureWeb/Servers/DuplexFold/DuplexFold.html) for LCMV, GGV, and HISV-1. C) Alignments of the 5´ and 3´ (shown in 5´ = >3´ orientation) genome ends for L and S segments of LCMV, GGV, and HISV-1. The nucleotide residues conserved throughout the L and S segments of family Arenaviridae genera are shown in bold.
Fig 2
Fig 2. Comparison of the GPC ORF between the three arenavirus genera.
A) The GPCs of the genera mammarenavirus, reptarenavirus, and hartmanivirus as exemplified by the respective type species LCMV, GGV and HISV-1. The highlighted features are: cleavage sites (presented by vertical line and number), glycosylation sites (presented by Y-shape) and transmembrane region (TM, presented by grey shading) are based on LCMV, GGV, and HISV-1 sequences. The abbreviations are: SSP = stable signal peptide, SP = signal peptide, GP1 = glycoprotein 1, GP2 = glycoprotein 2, TM = transmembrane. The myristoylation site of mammarenavirus and hartmanivirus SSP is shown by an arrow and below is an alignment of the site in other species of the genus. SKI-1/S1P cleavage site in mammarenavirus and reptarenavirus GPC is depicted by an arrow at around the center of GPC, and below is an alignment around the cleavage site for other species of the genus. For hartmaniviruses furin performs the GP1-GP2 cleavage instead of SKI-1/S1P. B) Alignment of mammarena- and hartmanivirus SSP and GP2, the residues essential for SSP-GP2 intermolecular zinc-binding motif are depicted by grey highlighting. The conserved myristoylation in the SSP is highlighted by a box, as well as the positive charge at around the center of SSP. C) A schematic representation of the glycoprotein complex as inspired by the illustration of Nunberg and York[17].
Fig 3
Fig 3. Western blot (WB), immunofluorescence (IF), and immunohistology (IH) of cultured cells using antiserum against C-terminal portion of HISV-1 (anti-HISV NP) or UHV-1 (anti-UHV NP) NP.
A) The panels on right show WBs comparing I/1Ki cells infected with UHV-2 or HISV-1 alone to I/1Ki cells co-infected with UHV-2 and HISV-1. The molecular weight marker (Precision Plus Protein All Blue Prestained Protein Standards, Bio-Rad) is shown in red, and the staining with anti-HISV NP (left) and anti-UHV NP (right) is shown in green. The figure was obtained using Odyssey infrared imaging system (LI-COR). The panels on left show IF staining of I/1Ki cells infected with UHV-2 alone or HISV-1 alone using anti-HISV NP (top panels) and anti-UHV NP (bottom panels). The cells were stained at two days post infection (dpi). The red channel shows NP staining and the blue channel nuclei (DAPI staining). The figures were captured at 400x magnification. B) I/1Ki cells infected with HISV-1 or UHV-2 IF stained at 2 dpi. The top panels show HISV-1 infected cells stained with anti-HISV NP and the bottom panels show UHV-2 infected cells stained with anti-UHV NP. The red channel shows NP staining and the blue channel nuclei (Hoechst staining). The panels on left side were captured at 100x and the panels on right side at 400x magnification. The yellow square indicates the individual cells shown at higher magnification on the rightmost panels. C) IH of non-infected and HISV-1 infected I/1Ki cells. The HISV-1 infected cells were collected and fixed at 6 dpi, the figures were captured at 400x magnification.
Fig 4
Fig 4. Virus production in I/1Ki cells during single virus infection vs. reptarenavirus-hartmanivirus co-infection.
A) The supernatants of I/1Ki cells infected with UHV-2 or HISV-1 alone or co-infected with HISV-1 and UHV-2 was collected at 0, 2, 4, 6, and 8 dpi, and analyzed for the amount of viral RNA using Taqman primers and probes. The amount of S and L segment was determined individually for both viruses. The left axis shows the relative amount of virus based on delta Ct calculation. The blue curve represents the relative amount of viral RNA released in the case of UHV-2 or HISV-1 infection alone, and the red curve represents the amount of viral released RNA in co-infection. B) The supernatants of I/1Ki cells infected with UGV-1 or HISV-1 alone or co-infected with HISV-1 and UGV-1 was collected at 0, 1, 2, 3, 5, and 7 dpi, and analyzed for the amount of viral RNA using Taqman primers and probes. The amount of S and L segment was determined individually for both viruses. The left axis shows the relative amount of virus based on delta Ct calculation. The blue curve represents the relative amount of viral released RNA in the case of UGV-1 or HISV-1 infection alone, and the red curve represents the amount of viral RNA released in co-infection.
Fig 5
Fig 5. In vitro effects of hartmanivirus.
Primary cell line derived from juvenile B. constrictor kidney (I/1Ki). A-D) HISV-1 infection, 6 dpi. A) Overview; cells with extensive cytoplasmic vacuolization(arrows) and multiple electron dense nodules along the cell membrane (blebbing; arrowheads). B) Individual cell with cytoplasmic lamellar bodies (arrows), microtubuli (arrowheads) and cytoplasmic vacuolization. C) Individual cells with blebbing along the cell membrane (arrowheads) and large cytoplasmic vacuoles (asterisks). D) Higher magnification of cell membrane blebs. E) UGV-1 infection, 6 dpi. Cells with characteristic cytoplasmic electron dense inclusion bodies (asterisks) and mild cytoplasmic vacuolization. There is no evidence of blebbing along the cell membrane.
Fig 6
Fig 6. Immuno-electron microscopy (immuno-EM) of HISV-1 infected I/1Ki cells.
HISV NP was visualized by anti-HISV NP antiserum and 18 nm gold-conjugated goat anti-rabbit IgG antibody. A-C) Cells after brief trypsin treatment prior to collection. A) Cells showing HISV-1 NP at cytoplasmic microtubules (arrows) and at the plasma membrane blebs (arrowheads). Cytoplasmic vacuoles are indicated by asterisks, N: nucleus. B) A shrunken infected cell with marked cytoplasmic vacuolization (asterisks). C) Higher magnification of B). The cytoplasm shows deposits of HISV-1 (arrows) adjacent to vacuoles (asterisks). D) A cell without trypsin treatment prior to collection. HISV-1 NP is found along cytoplasmic microtubules (arrowheads) and in association with cell protrusions (arrows). E-G) Cells after brief trypsin treatment prior to collection. E) A cell with small, partly contracted HISV-1 NP positive “blebs”at the plasma membrane (arrows). Inset: Higher magnification of the blebs, showing evidence of tubular cell-to-cell connections (arrows). F) A cell with abundant cytoplasmic vacuoles (asterisks) and cytoplasmic tubules containing HISV-1 NP. G) A higher magnification of HISV-1 NP positive tubuli in the cell presented in F. HISV-1 NP is also found within vacuoles (arrows) and around the nuclear membrane (arrowheads). N: nucleus.
Fig 7
Fig 7. Immuno-EM of UGV-1 infected I/1Ki cells, 6 dpi.
UGV-1 NP was visualized by anti-UHV NP antiserum and 18 nm gold-conjugated goat anti-rabbit IgG antibody. A) A cell with small and large cytoplasmic inclusion bodies containing UGV-1 NP (asterisks). B) A cytoplasmic inclusion body at a higher magnification demonstrating abundant UGV-1 NP (arrows).
Fig 8
Fig 8. Ultrastructural characterization of HISV-1 virions.
A) Analysis of fractions from sucrose density gradient ultracentrifugation of HISV-1 by SDS-PAGE, the proteins were visualized using Coomassie staining. The fractions were collected from the bottom of the gradient (from higher to lower density). The fractions F6-F8 contain the majority HISV-1 as judged by the intensity of ~70 kDa NP band, these fractions were pooled, concentrated and analyzed by WB (shown in panel B) to confirm the presence of NP. The molecular weight marker (Precision Plus Protein All Blue Prestained Protein Standards, Bio-Rad) is at leftmost lane. The figure was obtained using Odyssey infrared imaging system (LI-COR). B) The panel on right shows comparison of the proteins in purified preparation of UGV-1 (reptarenavirus) and HISV-1 (hartmanivirus), as seen by Coomassie staining. The arrows indicate the viral proteins as identified by mobility in SDS-PAGE, the label GP1 and GP2 shows the region where the processed GP1 and GP2 would likely migrate. The molecular weight marker (Precision Plus Protein All Blue Prestained Protein Standards, Bio-Rad) is at leftmost lane. The panels on right show Ponceau S (total protein) staining and WB of purified HISV-1 (pooled fractions F6-F8, panel A) and UGV-1 with anti-HISV NP antiserum. Ponceau S staining was recorded with regular flatbed scanner, the Coomassie stained gel and WB were obtained using Odyssey infrared imaging system (LI-COR). C) Top panel shows HISV-1 examples of virions in EM under negative staining, the scale bar is 100 nm. The bottom panel shows HISV-1 and UGV-1 as seen in cryoelectron microscopy, the scale bar is 200 nm.
Fig 9
Fig 9. Phylogenetic analysis of hartmaniviruses.
A) Maximum clade credibility tree of the polymerase region of arenaviruses. The tree was constructed from amino acid alignment using Bayesian MCMC method with LG model of substitution. Posterior probabilities are shown in each node. B) Maximum clade credibility tree of S segment of hartmaniviruses. The tree was constructed from Bayesian MCMC method with HKY model of substitution with gamma distributed rate variation among sites and proportion of invariable sites. Posterior probabilities are shown in each node.
Fig 10
Fig 10. Identification of the hartmanivirus target cells in vivo.
A-F) Snake 1.1. A, B) Brain. A) HISV-NP expression is seen as a granular reaction in the cytoplasm (arrows) and axons (arrowheads) of intact neurons. B) In contrast, expression of reptarenavirus NP is invariably seen in association with cytoplasmic, BIBD-typical inclusion bodies (arrows) in neurons. C) Lung. The HISV NP is abundant in smooth muscle cells (arrows). Inset: respiratory epithelium with several positive cells, exhibiting a granular cytoplasmic reaction. D) Large artery with smooth muscle cells positive for HISV-NP (arrow) and endothelial cell (arrow head). E) Brain, ependyma with several cells strongly positive for HISV-NP. F) Peripheral nerve, exhibiting HISV-NP expression in axons (arrowhead). G-K) Snake 1.4. G) Lung. There are HISV-NP positive epithelial cells. Arrowhead: smooth muscle cells. H) Stomach. The mucosa exhibits numerous glandular epithelial cells positive for HISV NP (arrows). Smooth muscle cells in the muscular layers are also occasionally positive (arrowheads). I) Pancreas with several HISV-NP positive acinar epithelial cells (arrows). J) Kidney with HISV-NP expression in epithelial cells of one tubule (T). K) Spleen. Several dendritic cells exhibit HISV-NP expression (arrowheads).

References

    1. Radoshitzky SR, Bao Y, Buchmeier MJ, Charrel RN, Clawson AN, et al. (2015) Past, present, and future of arenavirus taxonomy Arch Virol 160(7): 1851–1874. 10.1007/s00705-015-2418-y - DOI - PubMed
    1. Stenglein MD, Sanders C, Kistler AL, Ruby JG, Franco JY, et al. (2012) Identification, characterization, and in vitro culture of highly divergent arenaviruses from boa constrictors and annulated tree boas: Candidate etiological agents for snake inclusion body disease. MBio 3(4): e00180–12. 10.1128/mBio.00180-12 - DOI - PMC - PubMed
    1. Bodewes R, Kik MJ, Raj VS, Schapendonk CM, Haagmans BL, et al. (2013) Detection of novel divergent arenaviruses in boid snakes with inclusion body disease in the netherlands. J Gen Virol 94(Pt 6): 1206–1210. 10.1099/vir.0.051995-0 - DOI - PubMed
    1. Hetzel U, Sironen T, Laurinmaki P, Liljeroos L, Patjas A, et al. (2013) Isolation, identification, and characterization of novel arenaviruses, the etiological agents of boid inclusion body disease. J Virol 87(20): 10918–10935. 10.1128/JVI.01123-13 - DOI - PMC - PubMed
    1. Bodewes R, Raj VS, Kik MJ, Schapendonk CM, Haagmans BL, et al. (2014) Updated phylogenetic analysis of arenaviruses detected in boid snakes. J Virol 88(2): 1399–1400. 10.1128/JVI.02753-13 - DOI - PMC - PubMed

Publication types