. 2018 Nov 13;25(7):1741-1755.e7.
doi: 10.1016/j.celrep.2018.10.051.

TP63-Mediated Enhancer Reprogramming Drives the Squamous Subtype of Pancreatic Ductal Adenocarcinoma

Affiliations

TP63-Mediated Enhancer Reprogramming Drives the Squamous Subtype of Pancreatic Ductal Adenocarcinoma

Tim D D Somerville et al. Cell Rep. .

Abstract

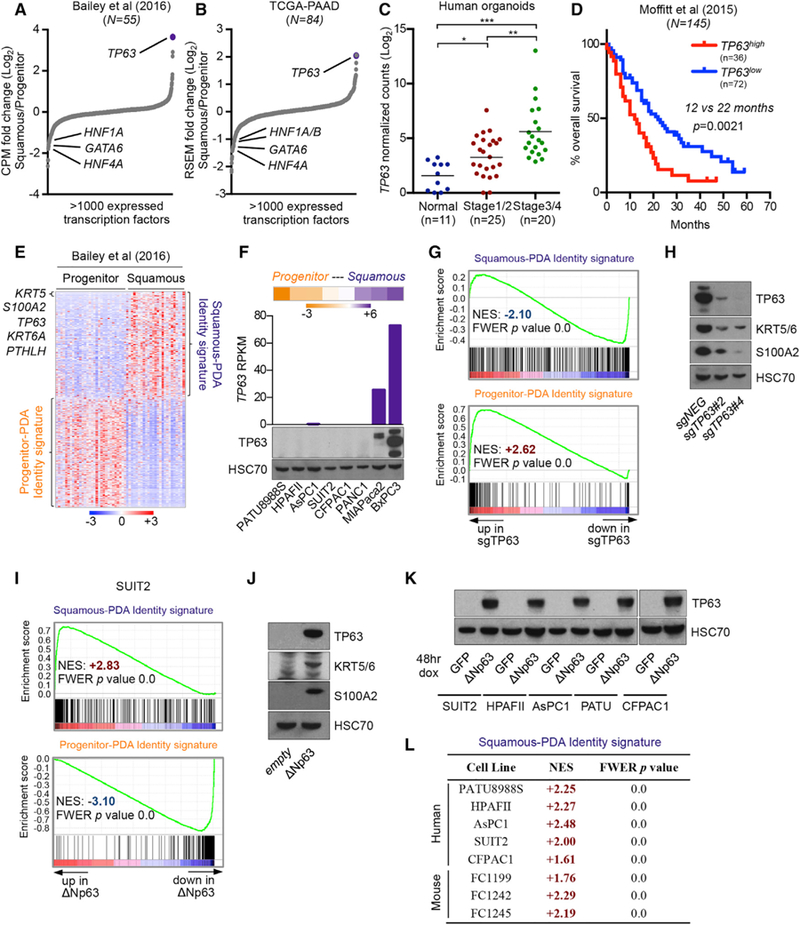
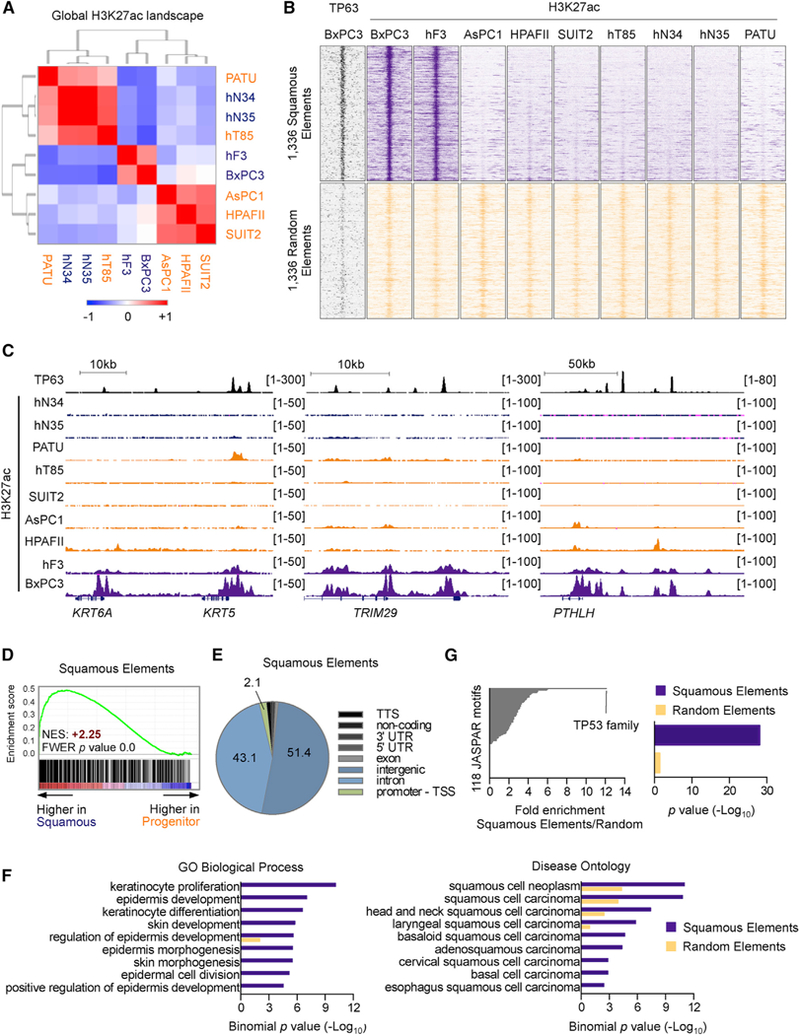
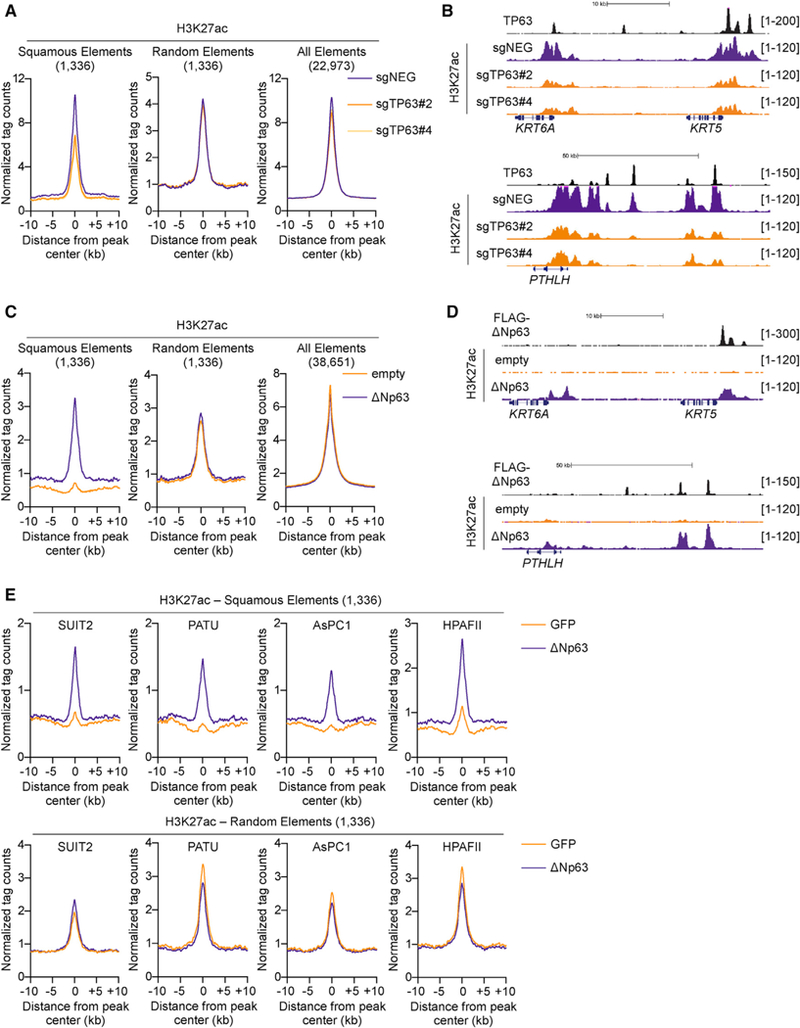
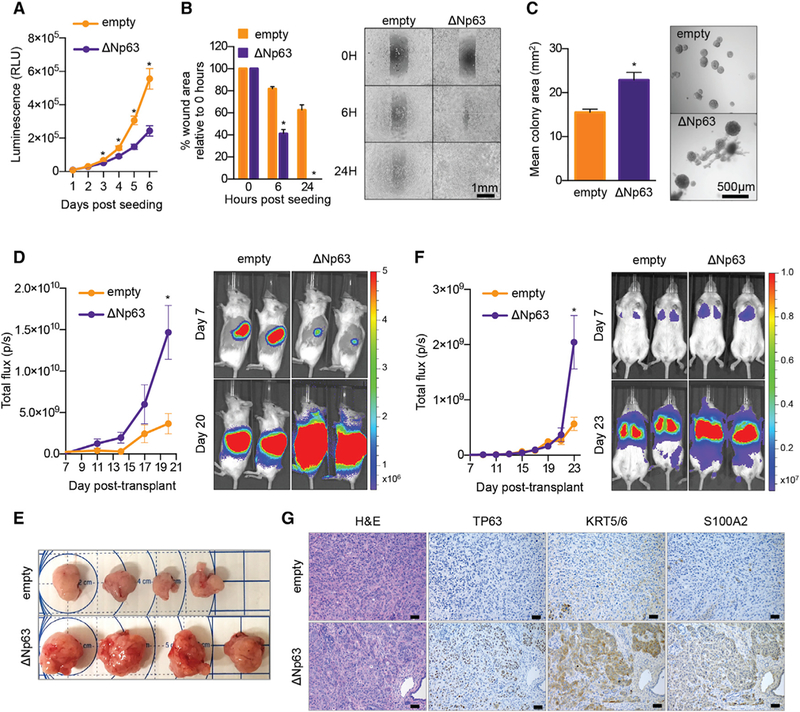
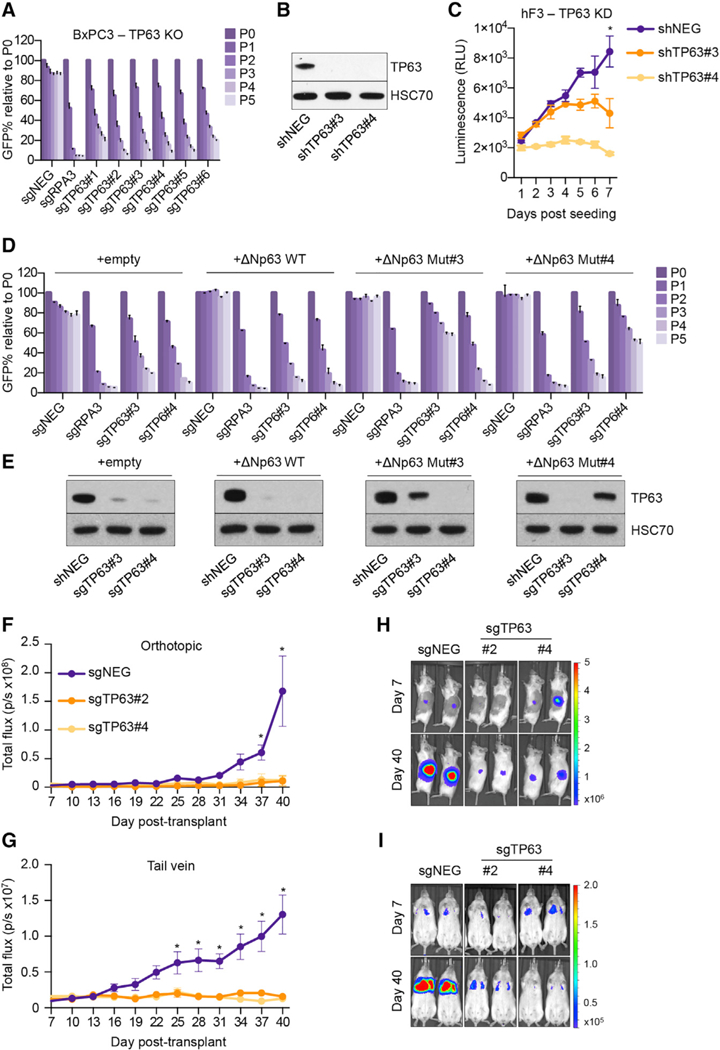
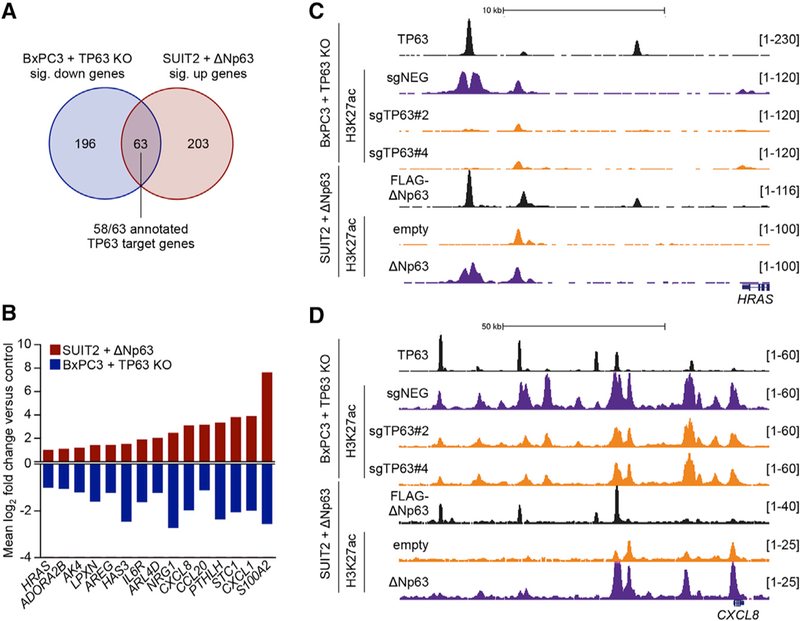
The aberrant expression of squamous lineage markers in pancreatic ductal adenocarcinoma (PDA) has been correlated with poor clinical outcomes. However, the functional role of this putative transdifferentiation event in PDA pathogenesis remains unclear. Here, we show that expression of the transcription factor TP63 (ΔNp63) is sufficient to install and sustain the enhancer landscape and transcriptional signature of the squamous lineage in human PDA cells. We also demonstrate that TP63-driven enhancer reprogramming promotes aggressive tumor phenotypes, including enhanced cell motility and invasion, and an accelerated growth of primary PDA tumors and metastases in vivo. This process ultimately leads to a powerful addiction of squamous PDA cells to continuous TP63 expression. Our study demonstrates the functional significance of squamous transdifferentiation in PDA and reveals TP63-based reprogramming as an experimental tool for investigating mechanisms and vulnerabilities linked to this aberrant cell fate transition.

Keywords: H3K27ac; TP63; chromatin; enhancer; enhancer reprogramming; master regulator; squamous.


Conflict of interest statement

DECLARATION OF INTERESTS

C.R.V. is an advisor to KSQ Therapeutics and receives research funding from Boehringer Ingelheim. D.A.T. is a member of the scientific advisory boards of Surface Oncology, Leap Therapeutics, MabImmune, VividBiosciences, and Bethyl Antibodies. D.A.T. has stock ownership in Surface Oncology and Leap Therapeutics. D.A.T. receives research support from ONO and Fibrogen.

Figures

Figure 1.
Figure 1.. ∆Np63 Is Necessary and Sufficient to Drive Progenitor-to-Squamous Transcriptional Reprogramming in Human PDA Cells
(A and B) Transcription factor expression in squamous and progenitor subtypes of PDA. Scatterplots show expressed transcription factors ranked by their mean log2 fold change in squamous versus progenitor patient samples from (A) Bailey et al. (2016) and (B) The Cancer Genome Atlas Research Network (2017). (C) TP63 expression in human organoids derived from normal pancreatic tissue or PDA tumor samples at the indicated disease stage. Data are from the study by Tiriac et al. (2018). *p < 0.05, **p < 0.01, ***p < 0.001 by unpaired Student’s t test. See also Table S1. (D) Survival curve of patients from the indicated study stratified according to high or low TP63 expression and for which survival data were available (Moffitt et al., 2015). Samples were designated as TP63high or TP63low based on Z score expression values >0.35 or <0, respectively. p value was calculated using the log rank (Mantel-Cox) test. (E) Squamous-PDA and progenitor-PDA identity signatures defined from patient samples. The top 500 protein coding genes in squamous (n = 25) or progenitor (n = 30) patient samples from the study by Bailey et al. (2016) were used to define the respective signatures. Heatmap shows expression levels of signature genes. Scale bar indicates the standardized expression value. See also Table S2. (F) TP63 expression in human PDA cell lines. Heatmap (top) shows RNA-seq analysis of human PDA cell lines ranked according to fold change in the median expression level of genes corresponding to the squamous-PDA versus progenitor-PDA identity signatures; scale bar indicates log2 fold change. Bar chart (middle) and western blot analysis (bottom) show TP63 expression in the indicated human PDA cell lines. (G and H) TP63 knock out in BxPC3 cells. (G) GSEA plots evaluating the squamous-PDA and progenitor-PDA identity signatures upon TP63 knockout.(H) Representative western blot analysis for the indicated proteins. RNA was extracted and whole-cell lysates were prepared for the respective analyses on day 5 post-infection with sgRNAs, 3 days post-selection with G418. (I and J) ∆Np63 expression in SUIT2 cells. (I) GSEA plots evaluating the squamous-PDA and progenitor-PDA identity signatures upon ∆Np63 expression.(J) Representative western blot analysis in SUIT2 cells for the indicated protiens. RNA was extracted and whole-cell lysates were prepared for the respective analyses on day 7 post-infection, 5 days following G418 selection. (K and L) Acute ∆Np63 expression in progenitor-like PDA cells. (K) Representative western blot analysis in the indicated cell lines for the indicated proteins.(L) Table summarizing RNA-seq data evaluating the squamous-PDA identity signature upon induction of ∆Np63 expression in the indicated cell lines. RNA was extracted and whole-cell lysates were prepared for the respective analyses 48 hr following dox administration. See also Figure S1.
Figure 2.
Figure 2.. A Unique Enhancer Landscape Linked to ∆Np63 Occupancy in PDA
(A) Heatmap representation of unsupervised hierarchical clustering of nine human cell lines or organoids representing PDA or normal pancreatic ducts based on H3K27ac occupancy at total H3K27ac ChIP-seq peaks. Scale bar indicates Pearson correlation coefficient. Normal organoids: hN34, hN35; PDA organoids: hF3, hT85; PATU: PATU8988S. (B) ChIP-seq density plots of TP63 and H3K27ac enrichments at squamous elements (top) or a set of 1,336 control H3K27ac regions (bottom) in the indicated cell lines. Each row represents a 10-kb interval centered on the midpoint of each H3K27ac peak. (C) ChIP-seq profiles of TP63 (top track) and H3K27ac at representative squamous elements close to KRT5 and KRT6A (left), TRIM29 (middle), and PTHLH (right). (D) GSEA plots evaluating the relative expression of genes proximal to squamous elements in squamous or progenitor patient samples from the study by Bailey et al. (2016). See also Table S5. (E) Pie chart showing the genomic distribution of squamous elements according to annotation of H3K27ac peaks by HOMER. TTS, transcription termination site; TSS, transcription start site. (F) Ontology analysis of genes located nearest to squamous elements versus control elements using GREAT. Gene Ontology (GO) terms related to biological process (left) and disease ontology (right) are shown. (G) Representation of motifs enriched at squamous elements versus control elements using TRAP. Human promoters were used as the comparison library. Left: fold change in p value. The TP53 position weight matrix is represented as TP53 family motif. Right: enrichment of the TP53 motif at squamous elements and control elements as determined by p value. See also Figure S2.
Figure 3.
Figure 3.. ∆Np63 Expression Is Sufficient to Install and Maintain a Squamous Enhancer Landscape in PDA
(A and B) TP63 knockout in BxPC3 cells and H3K27ac ChIP-seq analysis. (A) Metagene representation of H3K27ac signal in squamous elements (left), random control elements (middle), and all of the H3K27ac elements (right) in TP63 knockout and control cells. (B) ChIP-seq profiles of TP63 (top track) and H3K27ac at representative squamous elements close to KRT5 and KRT6A (top) and PTHLH (bottom). BxPC3-Cas9 cells were cross-linked and prepared for ChIP-seq analysis on day 5 post-infection, 3 days following G418 selection, with two independent TP63 or control sgRNAs (sgNEGs). (C and D) ∆Np63 expression in SUIT2 cells and H3K27ac ChIP-seq analysis. (C) Metagene representation of H3K27ac signal in squamous elements (left), random control elements (middle), and all of the H3K27ac elements (right) in SUIT2 cells expressing ∆Np63 or control cells. (D) ChIP-seq profiles of ectopically expressed FLAG-tagged TP63 (top track) and H3K27ac at representative squamous elements close to KRT5 and KRT6A (top) and PTHLH (bottom). SUIT2 cells were cross-linked and prepared for ChIP-seq analysis on day 7 post-infection, 5 days post-G418 selection. (E) Metagene representation of H3K27ac signal in squamous elements (top) and random control elements (bottom) in the indicated progenitor-like PDA cells following dox-inducible expression of ∆Np63 or GFP as a control. Cells were cross-linked and prepared for ChIP-seq analysis 48 hr following dox administration. See also Figure S3.
Figure 4.
Figure 4.. Phenotypic Consequences of ∆Np63-mediated Enhancer Reprogramming
(A–C) In vitro consequences of ∆Np63-mediated squamous lineage reprogramming. SUIT2 cells were infected with ∆Np63 cDNA or an empty vector and assayed on day 7 post-transduction, day 5 post-G418 selection. (A) Line graph showing in vitro cell growth as determined by CellTiter-Glo (Promega) assay. Means ±SEMs are shown. n = 3. (B) Bar chart (left) showing quantification of scratch assays at the indicated time points post-seeding, and representative images are shown (right). Means + SEMs are shown. n = 3. (C) Bar chart (left) showing quantification of colony size in three-dimensional (3D) Matrigel colony formation assays on day 7 post-plating, day 14 post-viral transduction. Colony size was measured using ImageJ software (NIH). Means + SEMs are shown. n = 3. Representative images at day 7 are shown (right). (D–G) In vivo consequences of ∆Np63-mediated squamous lineage reprogramming. SUIT2 cells harboring a luciferase transgene were infected with ∆Np63 cDNA or an empty vector and transplanted on day 5 post-viral transduction, day 3 post-G418 selection. (D) Line graph (left) shows quantification of the bioluminescence signal following orthotopic injection of 50,000 cells to the pancreas of NSG mice. Means ± SEMs are shown. Mice were imaged on days 7, 11, 14, 17, and 20 post-transplantation, and representative images are shown (right). n = 4 mice per group. (E) Bright-field images of tumors removed from mice shown in (D) on day 21 post-transplantation. (F) Line graph (left) shows quantification of bioluminescence signal following injection of 100,000 cells via the tail vein of NSG mice. Means ± SEMs are shown. Mice were imaged every 2 days from days 7 to 23 post-transplantation, and representative images are shown (right panel). n = 5 mice per group. Scale bar indicates luminescence signal. (G) Representative H&E (left) or immunohistochemical staining for the indicated proteins of tumor samples from (E). Scale bar indicates 50 μm. *p < 0.001 by two-way ANOVA with Sidak’s test for multiple comparisons. See also Figure S4.
Figure 5.
Figure 5.. ∆Np63 Is a Dependency in Squamous PDA Cells
(A) Competition-based proliferation assay in BxPC3 cells following infection with the indicated sgRNAs linked to GFP. Means + SEMs are shown. n= 3. (B and C) TP63 knockdown in hF3 organoids. (B) Representative western blot analysis for the indicated proteins in the indicated conditions. Whole-cell lysates were prepared on day 8 post-infection with shRNAs, 5 days post-selection with puro-mycin. (C) Line graph showing in vitro cell growth as determined by CellTiter-Glo assay following infection with the indicated shRNAs. Means ± SEMs are shown. n = 3. *p <0.01 by two-way ANOVA with Sidak’s test for multiple comparisons. (D and E) TP63 sgRNA/cDNA rescue assay in BxPC3 cells. (D) Competition-based proliferation assay in BxPC3 cells stably expressing the indicated cDNA following infection with the indicated sgRNAs linked to GFP. Means + SEMs are shown. n = 3. (E) Representative western blot analysis for the indicated proteins in the indicated conditions. Whole-cell lysates were prepared on day 5 post-infection with sgRNAs; the GFP percentage was >95% in each condition for western blot analysis. ∆Np63 WT, wild-type ∆Np63; ∆Np63 Mut#3, ∆Np63 cDNA resistant to sgTP63#3; ∆Np63 Mut#4, ∆Np63 cDNA resistant to sgTP63#4. (F and G) In vivo consequences of TP63 knockout. BxPC3-Cas9 cells expressing a luciferase transgene were infected with two independent TP63 or control (sgNEG) sgRNAs before transplantation on day 5 post-infection, 3 days post-G418 selection. Line graphs show quantification of bioluminescence signal following injection of 100,000 cells to the pancreas (F) or 250,000 cells via the tail vein (G) of NSG mice. Means ± SEMs are shown. (H and I) Representative bioluminescence images at the indicated days post-transplant following injection of cells to the pancreas (H) or via the tail vein (I) of NSG mice. Scale bar indicates luminescence signal. n = 4–5 mice per group. *p <00.1 by two-way ANOVA with Sidak’s test for multiple comparisons. See also Figure S5.
Figure 6.
Figure 6.. The Core Circuitry of ∆Np63-Mediated Enhancer Reprogramming in Squamous PDA Cells
(A) Venn diagram showing the overlap of significantly downregulated genes in BxPC3-Cas9 cells and upregulated genes in SUIT2 cells following infection with sgRNAs targeting TP63 or expression of ∆Np63 cDNA, respectively (fold change >2, p < 0.01). See also Table S6. (B) Bar graph showing the mean log2 fold change of example genes from (A). See also Table 1. (C and D) ChIP-seq profiles of TP63, FLAG-tagged ∆Np63, and H3K27ac at the ∆Np63 target genes HRAS (C) and CXCL8 (D) following TP63 knockout in BxPC3-Cas9 cells or expression of ∆Np63 in SUIT2 cells. See also Figure S6.

References

    1. Acharyya S, Oskarsson T, Vanharanta S, Malladi S, Kim J, Morris PG, Manova-Todorova K, Leversha M, Hogg N, Seshan VE, et al. (2012). A CXCL1 paracrine network links cancer chemoresistance and metastasis. Cell 150, 165–178. - PMC - PubMed
    1. Aguirre AJ, Bardeesy N, Sinha M, Lopez L, Tuveson DA, Horner J, Redston MS, and DePinho RA (2003). Activated Kras and Ink4a/Arf deficiency cooperate to produce metastatic pancreatic ductal adenocarcinoma. Genes Dev 17, 3112–3126. - PMC - PubMed
    1. Aiello NM, Rhim AD, and Stanger BZ (2016). Orthotopic injection of pancreatic cancer cells. Cold Spring Harb. Protoc 2016, pdb.prot078360. - PubMed
    1. Andricovich J, Perkail S, Kai Y, Casasanta N, Peng W, and Tzatsos A (2018). Loss of KDM6A Activates Super-Enhancers to Induce Gender-Specific Squamous-like Pancreatic Cancer and Confers Sensitivity to BET Inhibitors. Cancer Cell 33, 512–526. e8. - PMC - PubMed
    1. Bailey TL, Boden M, Buske FA, Frith M, Grant CE, Clementi L, Ren J, Li WW, and Noble WS (2009). MEME SUITE: tools for motif discovery and searching. Nucleic Acids Res 37, W202–W208. - PMC - PubMed

Publication types