. 2018;40(4):344-357.
doi: 10.1159/000494273. Epub 2018 Nov 14.

Intrauterine Growth Restriction and Hyperoxia as a Cause of White Matter Injury

Affiliations

Intrauterine Growth Restriction and Hyperoxia as a Cause of White Matter Injury

Jill L Chang et al. Dev Neurosci. 2018.

Abstract

Intrauterine growth restriction (IUGR) is estimated to occur in 5% of pregnancies, with placental insufficiency being the most common cause in developed countries. While it is known that white matter injury occurs in premature infants, the extent of IUGR on white matter injury is less defined in term infants. We used a novel murine model that utilizes a thromboxane A2 (TXA2) analog (U46619), a potent vasoconstrictor, to induce maternal hypertension and mimic human placental insufficiency-induced IUGR to study the white matter. We also investigated the role of hyperoxia as an additional risk factor for white matter injury, as IUGR infants are at increased risk of respiratory comorbidities leading to increased oxygen exposure. We found that TXA2 analog-induced IUGR results in white matter injury as demonstrated by altered myelin structure and changes in the oligodendroglial cell/oligodendrocyte population. In addition, our study demonstrates that hyperoxia exposure independently results in white matter perturbation. To our knowledge, this is the first study to report single and combined effects of IUGR with hyperoxia impacting the white matter and motor function. These results draw attention to the need for close monitoring of motor development in IUGR babies following hospital discharge as well as highlighting the importance of limiting, as clinically feasible, the degree of oxygen overexposure to potentially improve motor outcomes in this population of infants.

Keywords: Hyperoxia; Intrauterine growth restriction; Oligodendrocytes; White matter injury.


Conflict of interest statement

The authors have no conflicts of interest to declare.

Figures
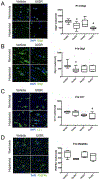
Figure 1.
Figure 1.
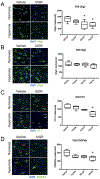
IUGR with and without hyperoxia results in decreased oligodendrocytes in the corpus callosum early in neurodevelopment. At P14 there was a significant decrease in A Olig2+ cells in the IUGR (TbxRA, n = 10) and IUGR hyperoxia group (TbxO2, n = 7) compared to the vehicle group (VehRA, n = *p = 0.02. B Olig1+ Cells in the IUGR group (TbxRA, n = 18) compared to the vehicle group (VehRA, n = 9) * p = 0.0001 and in the IUGR hyperoxia group (TbxO2, n = 5) compared to the vehicle group (VehRA, n = 9) that did not reach statistical significance. C CC1+ cells in the IUGR hyperoxia group (TbxO2, n =4) compared to the vehicle group (VehRA, n = 4) *p = 0.04. D There was no significant difference in PDGFRa positive cells between the four groups VehRA (n = 5), TbxRA (n = 4), VehO2 (n = 5), TbxO2 (n = 4)
Figure 2.
Figure 2.
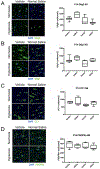
IUGR with hyperoxia results in persistent decrease in oligodendrocytes in the corpus callosum in the developed brain. At P28 there was a A Significant decrease in Olig2+ cells in the vehicle hyperoxia (VehO2, n = 6) *p = 0.01 and the IUGR hyperoxia group (TbxO2, n = 6) *p = 0.04 compared to the vehicle group (VehRA, n = 6) B No significant changes in Olig1+ cells found with IUGR or hyperoxia (TbxRA, VehO2, TbxO2, n = 5) when compared to the vehicle normoxia group (VehRA, n = 5). C Significant decrease in CC1+ cells in the IUGR hyperoxia group (TbxO2, n = 4) compared to the vehicle group (VehRA, n = 5) *p = 0.01. D Significant decrease in PDGFRa+ cells in the IUGR hyperoxia group (TbxO2, n = 4) compared to the vehicle group (VehRA, n = 4) *p = 0.03.
Figure 3.
Figure 3.
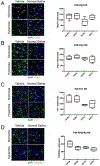
At P14 there was no significant difference in 0.5% ethanol vehicle groups with and without hyperoxia (VehRA and VehO2) and the normal saline groups (NSRA and NSO2) in the number of A Olig2+ cells/ mm2 (n = 5–7). B Olig1+ cells/ mm2 (n = 5–9). C CC1+ cells/ mm2 (n = 4–9). D PDGFRa+ cells/ mm2 (n = 5–8).
Figure 4.
Figure 4.
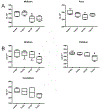
At P28 there was no significant difference in 0.5% ethanol vehicle groups with and without hyperoxia (VehRA and VehO2) and the normal saline groups (NSRA and NSO2) in the number of A Olig2+ cells/ mm2 (n = 4–6). B Olig1+ cells/ mm2 (n = 4–5). C CC1+ cells/ mm2 (n = 4–5). D PDGFRa+ cells/ mm2 (n = 4).
Figure 5.
Figure 5.
IUGR and Hyperoxia cause changes in myelin microstructure in the internal capsule at P28. A Myelin structure from the internal capsule of P28 mice was examined with transmission electron microscopy at a magnification of 6800x B Increase in g-ratio was found in the IUGR (TbxRA, n =7) *p = 0.004 and IUGR with hyperoxia (TbxO2, n =3) *p = 0.01 groups compared to the vehicle group (VehRA, n =6). C No significant difference in axon diameter between experimental groups
Figure 6.
Figure 6.
Hyperoxia alone and IUGR with hyperoxia result in changes in myelin integrity as seen with DTI MRI at P28 A Significant decreases in FA in the midbrain *p = 0.01 and pons *p=0.006 were seen in the hyperoxia group (VehO2, n =7) compared to the vehicle normoxia group (VehRA, n =7). B IUGR with hyperoxia exposure group (TbxO2, n =4) showed significant decreases in FA in the striatum *p=0.01, pallidum *p=0.005, and cerebellum p = 0.05 when compared to the vehicle group (VehRA, n =7)
Figure 7.
Figure 7.
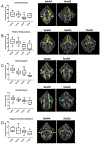
Fiber tractography show changes in white matter tract length and/or volume in the cerebral peduncle, fimbria of hippocampus, internal capsule, and cingulum of the corpus callosum. A Tract volume was significantly decreased in the cerebral peduncle with hyperoxia exposure alone (VehO2, n =7) *p=0.01 compared to the vehicle group (VehRA, n =7). Coronal section showing white matter fiber tracts** through the cerebral peduncle (red). B Tract volume was significantly decreased in the fimbria of the hippocampus in the vehicle hyperoxia (VehO2, n =7) group *p = 0.02 and IUGR with hyperoxia (TbxO2, n =4) group *p = 0.04 compared to the vehicle group (VehRA, n =8). Coronal section showing white matter fiber tracts through the fimbria of the hippocampus (orange). C White matter tract volume was significantly decreased with IUGR (TbxRA, n =7) *p = 0.01, hyperoxia exposure alone (VehO2, n = 7)* p = 0.01, and IUGR with hyperoxia (TbxO2, n =4) * p <0.0001 compared to the vehicle group (VehRA, n =7). Tract length was also significantly decreased with hyperoxia exposure alone (VehO2, n =7) * p = 0.04 and IUGR with hyperoxia (TbxO2, n =4) * p = 0.01. Coronal section showing white matter fiber tracts through the internal capsule (blue). D White matter tract volume was significantly decreased in the cingulum of the corpus callosum in IUGR with hyperoxia (TbxO2, n =4) compared to vehicle normoxia (VehRA, n = 8) (p = 0.04) (Figure 3D). Coronal section showing white matter fiber tracts through the cingulum of the corpus callosum (yellow). **For the fiber tracts the convention used for directional color mapping was red for left-right, green for anteroposterior, and blue for superior-inferior.
Figure 8.
Figure 8.
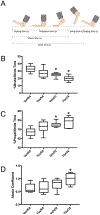
IUGR and hyperoxia result in functional motor deficits. Gait parameters were evaluated using Mouse Specifics Digigait System. Differences in gait were seen gait were seen at P28 at a speed of 15–17cm/s. A 5 main components of gait were analyzed: braking, propulsion, swing, stance, and stride time B Decreased percent brake/stride time was seen with IUGR (TbxRA, n =11), hyperoxia exposure (VehO2, n =10; *p = 0.08), and IUGR combined with hyperoxia (TbxO2, n =6; *p <0.0001) compared to the vehicle group (VehRA, n =11) C Increased percent propel/stride time was seen with IUGR (TbxRA, n =11), hyperoxia exposure (VehO2, n =10; *p = 0.002), and IUGR combined with hyperoxia (TbxO2, n =6; **p = 0.002) compared to the vehicle group (VehRA, n =11) D Increased ataxia coefficient (*p = 0.02) were found with IUGR with hyperoxia exposure (TbxO2, n =6) compared to the vehicle group (VehRA, n =11). Note: total stance and stride time was not significantly different between vehicle group and IUGR, hyperoxia, or IUGR with hyperoxia.

References

    1. Schroder H: Models of fetal growth restriction. European Journal of Obstetrics Gynecology Reproductive Biology 2003;110:S29–S39. - PubMed
    1. Battaglia F, Lubchenco L: A practical classification of newborn infants by weight and gestational age. Journal of Pediatrics 1967;71:159–163. - PubMed
    1. Tolcos M, Bateman E, O’Dowd R, Markwick R, Vrijsen K, Rehn A, Rees S: Intrauterine growth restriction affects the maturation of myelin. Experimenal Neurology 2011;232:53–65. - PubMed
    1. Mandruzzato G, Antsaklis A, Botet F, Chervenak F, Figueras F, Grunebaum A, Puerto B, Skupski D, Stanojevic M: Intrauterine restriction (IUGR). Journal of Perinatal Medicine 2008;36:327–333. - PubMed
    1. Reid M, Murray K, Marsh E, Golden J, Simmons R, Grinspan J: Delayed myelination in an intrauterine growth retardation model is mediated by oxidative stress upregulating bone morphogenetic protein 4. J Neuropathol Exp Neurol 2012;71:640–653. - PMC - PubMed

Publication types