

Myeloid sirtuin 6 deficiency accelerates experimental rheumatoid arthritis by enhancing macrophage activation and infiltration into synovium
- PMID: 30429089
- PMCID: PMC6306347
- DOI: 10.1016/j.ebiom.2018.11.005
Myeloid sirtuin 6 deficiency accelerates experimental rheumatoid arthritis by enhancing macrophage activation and infiltration into synovium
Abstract
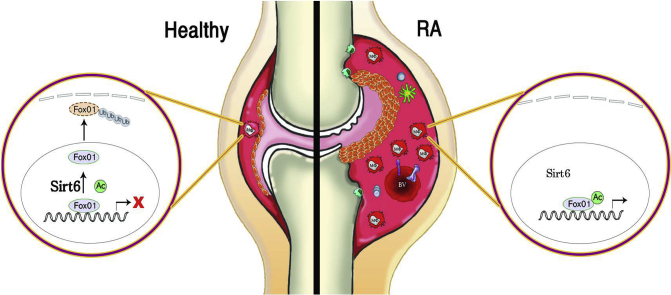
Background: We recently reported that myeloid sirtuin 6 (Sirt6) is a critical determinant of phenotypic switching and the migratory responses of macrophages. Given the prominent role of macrophages in the pathogenesis of rheumatoid arthritis (RA), we tested whether myeloid Sirt6 deficiency affects the development and exacerbation of RA.
Methods: Arthritis was induced in wild type and myeloid Sirt6 knockout (mS6KO) mice using collagen-induced and K/BxN serum transfer models. Sirt6 expression (or activity) and inflammatory activities were compared in peripheral blood mononuclear cells (PBMCs) and monocytes/macrophages obtained from patients with RA or osteoarthritis.
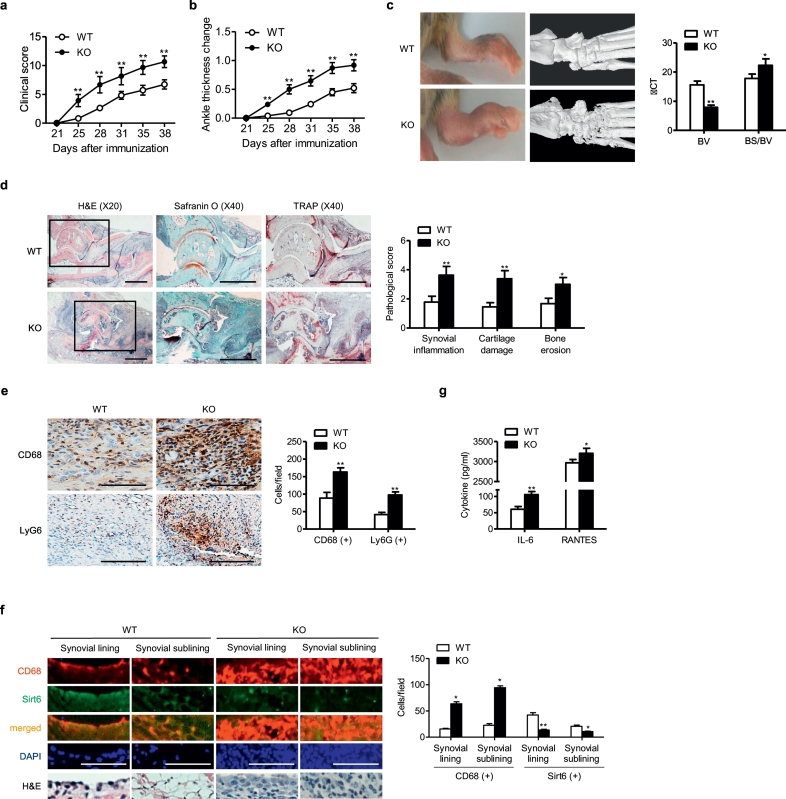
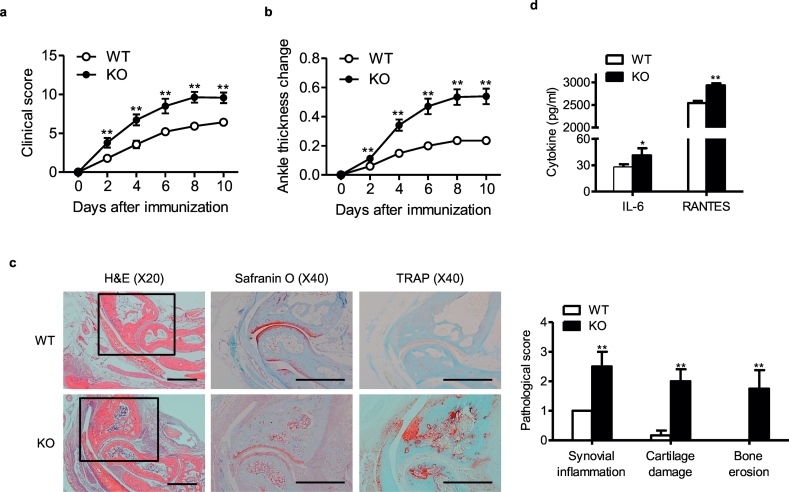
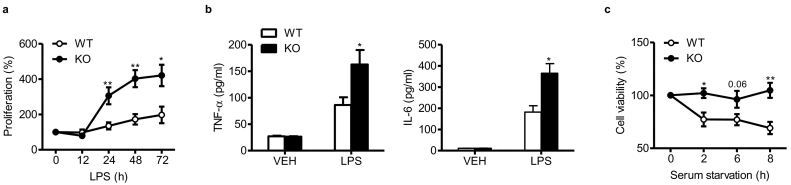
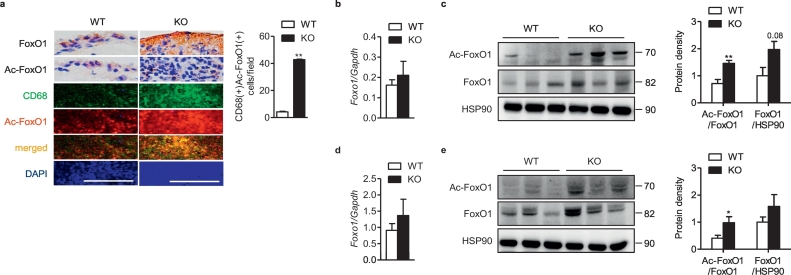
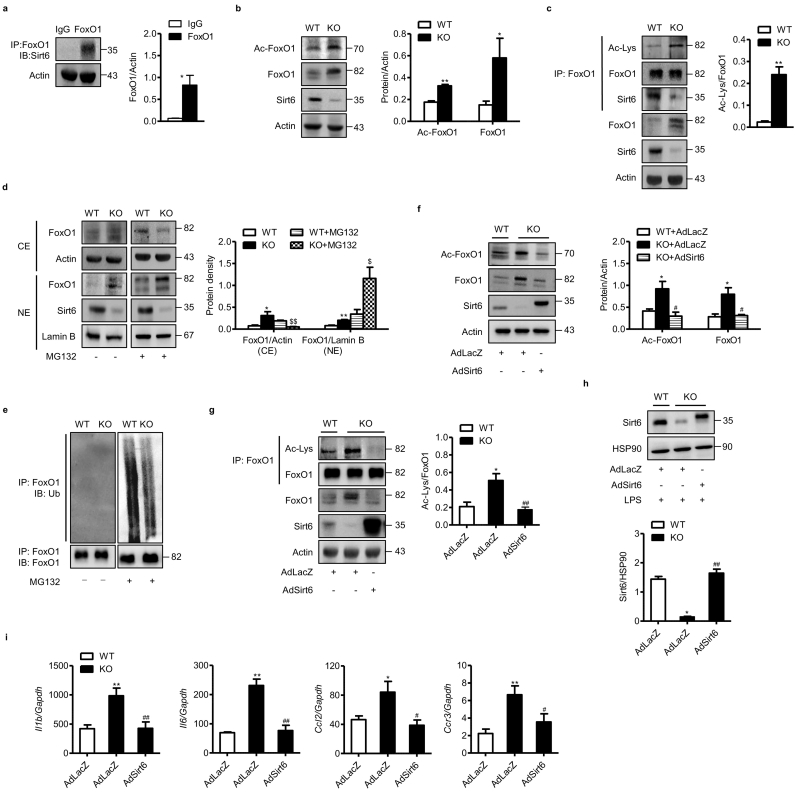
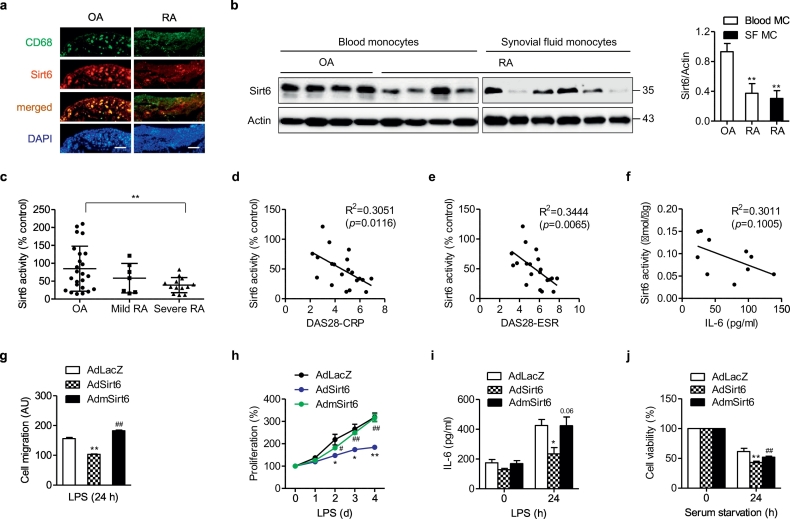
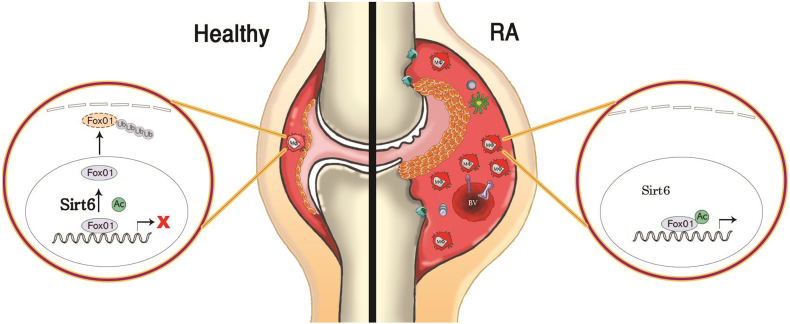
Findings: Based on clinical score, ankle thickness, pathology, and radiology, arthritis was more severe in mS6KO mice relative to wild type, with a greater accumulation of macrophages in the synovium. Consistent with these findings, myeloid Sirt6 deficiency increased the migration potential of macrophages toward synoviocyte-derived chemoattractants. Mechanistically, Sirt6 deficiency in macrophages caused an inflammation with increases in acetylation and protein stability of forkhead box protein O1. Conversely, ectopic overexpression of Sirt6 in knockout cells reduced the inflammatory responses. Lastly, PBMCs and monocytes/macrophages from RA patients exhibited lower expression of Sirt6 than those from patients with osteoarthritis, and their Sirt6 activity was inversely correlated with disease severity.
Interpretation: Our data identify a role of myeloid Sirt6 in clinical and experimental RA and suggest that myeloid Sirt6 may be an intriguing therapeutic target. FUND: Medical Research Center Program and Basic Science Research Program through the National Research Foundation of Korea.
Keywords: FoxO1; Inflammation; Macrophage; RA; Sirt6.
Copyright © 2018 The Authors. Published by Elsevier B.V. All rights reserved.
Figures

Similar articles
-
Myeloid Sirtuin 6 Deficiency Causes Insulin Resistance in High-Fat Diet-Fed Mice by Eliciting Macrophage Polarization Toward an M1 Phenotype.Diabetes. 2017 Oct;66(10):2659-2668. doi: 10.2337/db16-1446. Epub 2017 Jun 12. Diabetes. 2017. PMID: 28607107
-
Overexpression of sirtuin 6 suppresses inflammatory responses and bone destruction in mice with collagen-induced arthritis.Arthritis Rheum. 2013 Jul;65(7):1776-85. doi: 10.1002/art.37963. Arthritis Rheum. 2013. PMID: 23553536
-
Promotion of macrophage activation by Tie2 in the context of the inflamed synovia of rheumatoid arthritis and psoriatic arthritis patients.Rheumatology (Oxford). 2020 Feb 1;59(2):426-438. doi: 10.1093/rheumatology/kez315. Rheumatology (Oxford). 2020. PMID: 31377797 Free PMC article.
-
A Tale of Two Immune Cells in Rheumatoid Arthritis: The Crosstalk Between Macrophages and T Cells in the Synovium.Front Immunol. 2021 Jun 17;12:655477. doi: 10.3389/fimmu.2021.655477. eCollection 2021. Front Immunol. 2021. PMID: 34220809 Free PMC article. Review.
-
Driving chronicity in rheumatoid arthritis: perpetuating role of myeloid cells.Clin Exp Immunol. 2018 Jul;193(1):13-23. doi: 10.1111/cei.13098. Epub 2018 Feb 2. Clin Exp Immunol. 2018. PMID: 29315512 Free PMC article. Review.
Cited by
-
Sirtuin 6 promotes eosinophil differentiation by activating GATA-1 transcription factor.Aging Cell. 2021 Jul;20(7):e13418. doi: 10.1111/acel.13418. Epub 2021 Jun 14. Aging Cell. 2021. PMID: 34125994 Free PMC article.
-
Role of Sirtuins in the Pathogenesis of Rheumatoid Arthritis.Int J Mol Sci. 2023 Jan 12;24(2):1532. doi: 10.3390/ijms24021532. Int J Mol Sci. 2023. PMID: 36675041 Free PMC article. Review.
-
The role of Sirt6 in osteoarthritis and its effect on macrophage polarization.Bioengineered. 2022 Apr;13(4):9677-9689. doi: 10.1080/21655979.2022.2059610. Bioengineered. 2022. PMID: 35443857 Free PMC article.
-
Neuroprotective Potential of Dendritic Cells and Sirtuins in Multiple Sclerosis.Int J Mol Sci. 2022 Apr 14;23(8):4352. doi: 10.3390/ijms23084352. Int J Mol Sci. 2022. PMID: 35457169 Free PMC article. Review.
-
Friend or foe? The role of SIRT6 on macrophage polarized to M2 subtype in acute kidney injury to chronic kidney disease.Ren Fail. 2025 Dec;47(1):2482121. doi: 10.1080/0886022X.2025.2482121. Epub 2025 Apr 22. Ren Fail. 2025. PMID: 40260529 Free PMC article. Review.
References
-
- Muller-Ladner U., Pap T., Gay R.E., Neidhart M., Gay S. Mechanisms of disease: the molecular and cellular basis of joint destruction in rheumatoid arthritis. Nat Clin Pract Rheumatol. 2005;1:102–110. - PubMed
-
- Mulherin D., Fitzgerald O., Bresnihan B. Synovial tissue macrophage populations and articular damage in rheumatoid arthritis. Arthritis Rheum. 1996;39:115–124. - PubMed
MeSH terms
Substances
LinkOut - more resources
Full Text Sources
Medical
Molecular Biology Databases
Research Materials
Miscellaneous
