

Inherent DNA-binding specificities of the HIF-1α and HIF-2α transcription factors in chromatin
- PMID: 30429208
- PMCID: PMC6322389
- DOI: 10.15252/embr.201846401
Inherent DNA-binding specificities of the HIF-1α and HIF-2α transcription factors in chromatin
Abstract
Hypoxia-inducible factor (HIF) is the major transcriptional regulator of cellular responses to hypoxia. The two principal HIF-α isoforms, HIF-1α and HIF-2α, are progressively stabilized in response to hypoxia and form heterodimers with HIF-1β to activate a broad range of transcriptional responses. Here, we report on the pan-genomic distribution of isoform-specific HIF binding in response to hypoxia of varying severity and duration, and in response to genetic ablation of each HIF-α isoform. Our findings reveal that, despite an identical consensus recognition sequence in DNA, each HIF heterodimer loads progressively at a distinct repertoire of cell-type-specific sites across the genome, with little evidence of redistribution under any of the conditions examined. Marked biases towards promoter-proximal binding of HIF-1 and promoter-distant binding of HIF-2 were observed under all conditions and were consistent in multiple cell type. The findings imply that each HIF isoform has an inherent property that determines its binding distribution across the genome, which might be exploited to therapeutically target the specific transcriptional output of each isoform independently.
Keywords: HIF; DNA binding; hypoxia; transcription.
© 2018 The Authors. Published under the terms of the CC BY 4.0 license.
Figures
- A–D
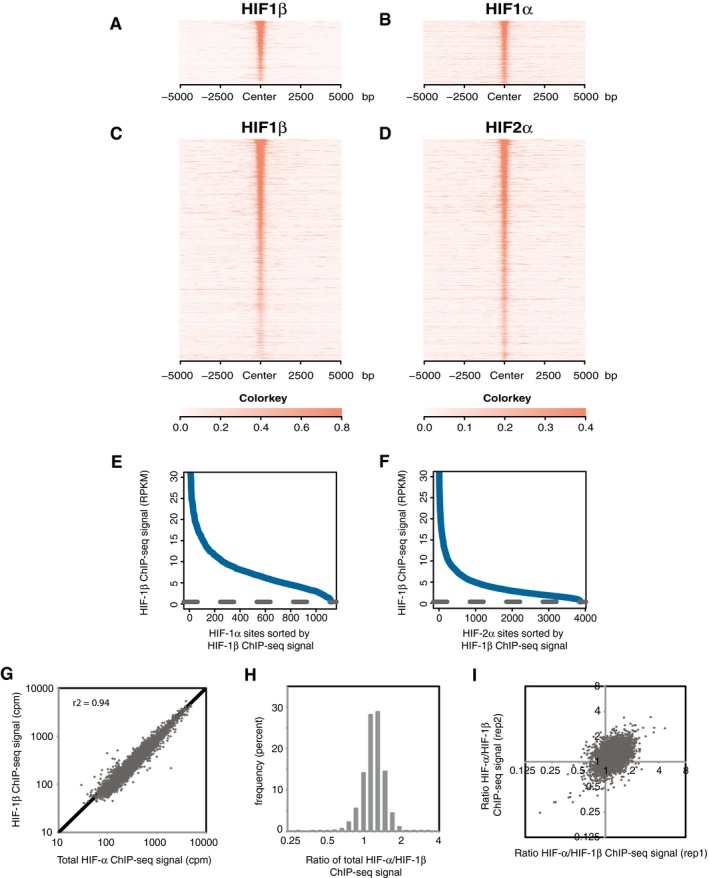
Sites that bound either HIF‐1α (A and B) or HIF‐2α (C and D) in both replicates were identified by the MACS peak caller and ordered on the y‐axis according to HIF‐1β signal intensity. Heatmaps show HIF ChIP‐seq signal (read counts per million mapped reads, CPM; expressed as colour intensity, averaged across two independent ChIP‐seq experiments) at HIF binding sites and across the flanking ±5kb regions (x‐axis). (A) HIF‐1β signal intensity and (B) HIF‐1α signal intensity at HIF‐1α binding sites and (C) HIF‐1β signal intensity and (D) HIF‐2α signal intensity at HIF‐2α binding sites. HIF‐1β signal intensity above local background levels is observed at all HIF‐1α and HIF‐2α binding sites.
- E, F
Line plots showing average (n = 2, independent ChIP‐seq experiments) HIF‐1β signal intensity (solid blue lines) within the MACS defined (E) HIF‐1α and (F) HIF‐2α binding sites compared to the average background HIF‐1β binding signal (dashed black line) at non‐HIF‐α binding accessible sites (defined by FAIRE‐seq). Sites are ranked on the x‐axis according to HIF‐1β signal. HIF‐1β signal intensity at both HIF‐1α and HIF‐2α binding sites was consistently above genome‐wide background levels.
- G
HIF‐1β signal intensity was plotted against total HIF‐α (HIF‐1α + HIF‐2α) signal intensity for all sites that bound one or more HIF subunits. A strong correlation was observed between HIF‐α and HIF‐1β signal intensities.
- H
The ratio of total HIF‐α signal to HIF‐1β signal (x‐axis) was determined for each site and plotted as a frequency distribution (y‐axis) showing a tight unimodal distribution.
- I
The non‐reproducibility of the total HIF‐α/HIF‐1β ratio was assessed by plotting the ratio in replicate 1 versus that in replicate 2.
- A, B
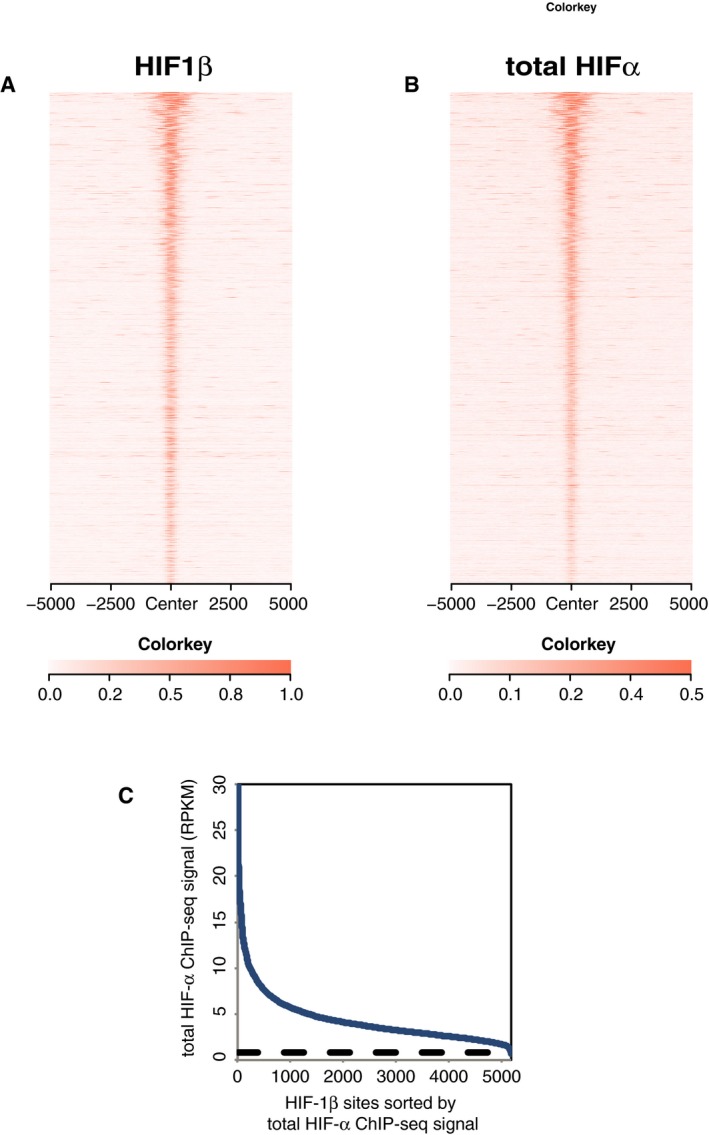
Heatmaps show (A) HIF‐1β signal intensity and (B) total HIF‐α (HIF‐1α + HIF‐2α) signal intensity (read counts per million mapped reads, CPM; expressed as colour intensity, averaged across two independent ChIP‐seq experiments) at HIF‐1β binding sites and across the flanking ±5 kb regions (x‐axis). HIF‐α signal intensity above local background levels is observed at all HIF‐1β binding sites.
- C
Line plot showing total HIF‐α signal intensity (solid blue lines) within the MACS defined HIF‐1β binding sites compared to the average background HIF‐α binding signal (dashed black line) at non‐HIF‐1β binding accessible sites (defined by FAIRE‐seq). Sites are ranked on the x‐axis according to total HIF‐α signal. HIF‐α signal intensity at HIF‐1β binding sites was consistently above genome‐wide background levels.
- A–D
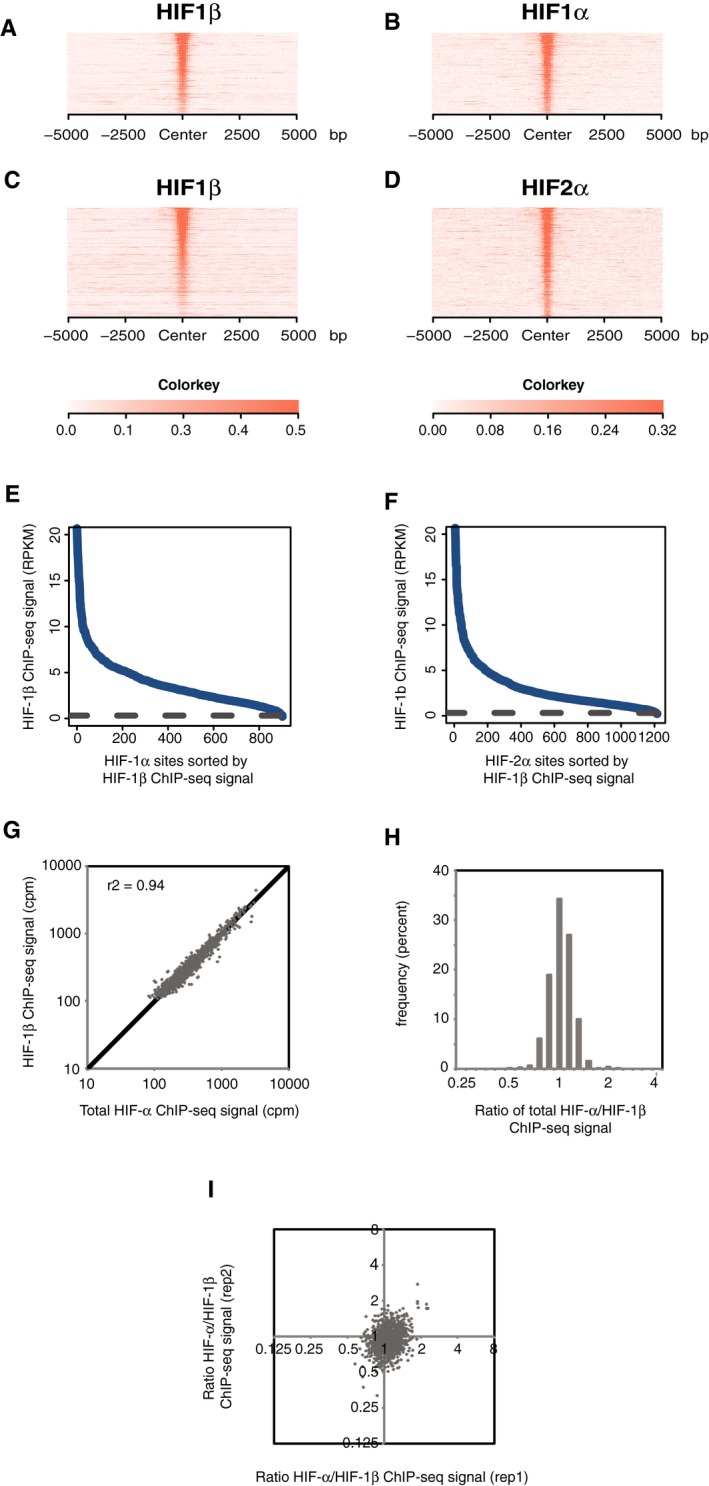
Sites that bound either HIF‐1α (A and B) or HIF‐2α (C and D) in normoxic RCC4 cells in both replicates were identified by the MACS peak caller and ordered on the y‐axis according to HIF‐1β signal intensity. Heatmaps show HIF ChIP‐seq signal (read counts per million mapped reads, CPM; expressed as colour intensity, averaged across two independent ChIP‐seq experiments) at HIF binding sites and across the flanking ±5 kb regions (x‐axis). (A) HIF‐1β signal intensity and (B) HIF‐1α signal intensity at HIF‐1α binding sites and (C) HIF‐1β signal intensity and (D) HIF‐2α signal intensity at HIF‐2α binding sites. HIF‐1β signal intensity above local background levels is observed at all HIF‐1α and HIF‐2α binding sites.
- E, F
Line plots showing average (n = 2, independent ChIP‐seq experiments) HIF‐1β signal intensity (solid blue lines) at MACS defined (E) HIF‐1α and (F) HIF‐2α binding sites compared to the average background HIF‐1β binding signal at non‐HIF‐α binding accessible sites (defined by FAIRE‐seq). Sites are ranked on the x‐axis according to HIF‐1β signal. HIF‐1β signal intensity at both HIF‐1α and HIF‐2α binding sites was consistently above genome‐wide background levels.
- G
Total HIF‐α (HIF‐1α + HIF‐2α) signal intensity was plotted against HIF‐1β signal intensity for all sites that bound one or more HIF subunits. Strong correlation was observed between HIF‐α and HIF‐1β signal intensities.
- H
The ratio of total HIF‐α signal to HIF‐1β signal (x‐axis) was determined for each site and plotted as a frequency distribution (y‐axis) showing a tight unimodal distribution.
- I
The reproducibility of total HIF‐α/HIF‐1β ratio was assessed by plotting the ratio in replicate 1 versus that in replicate 2.
- A–I
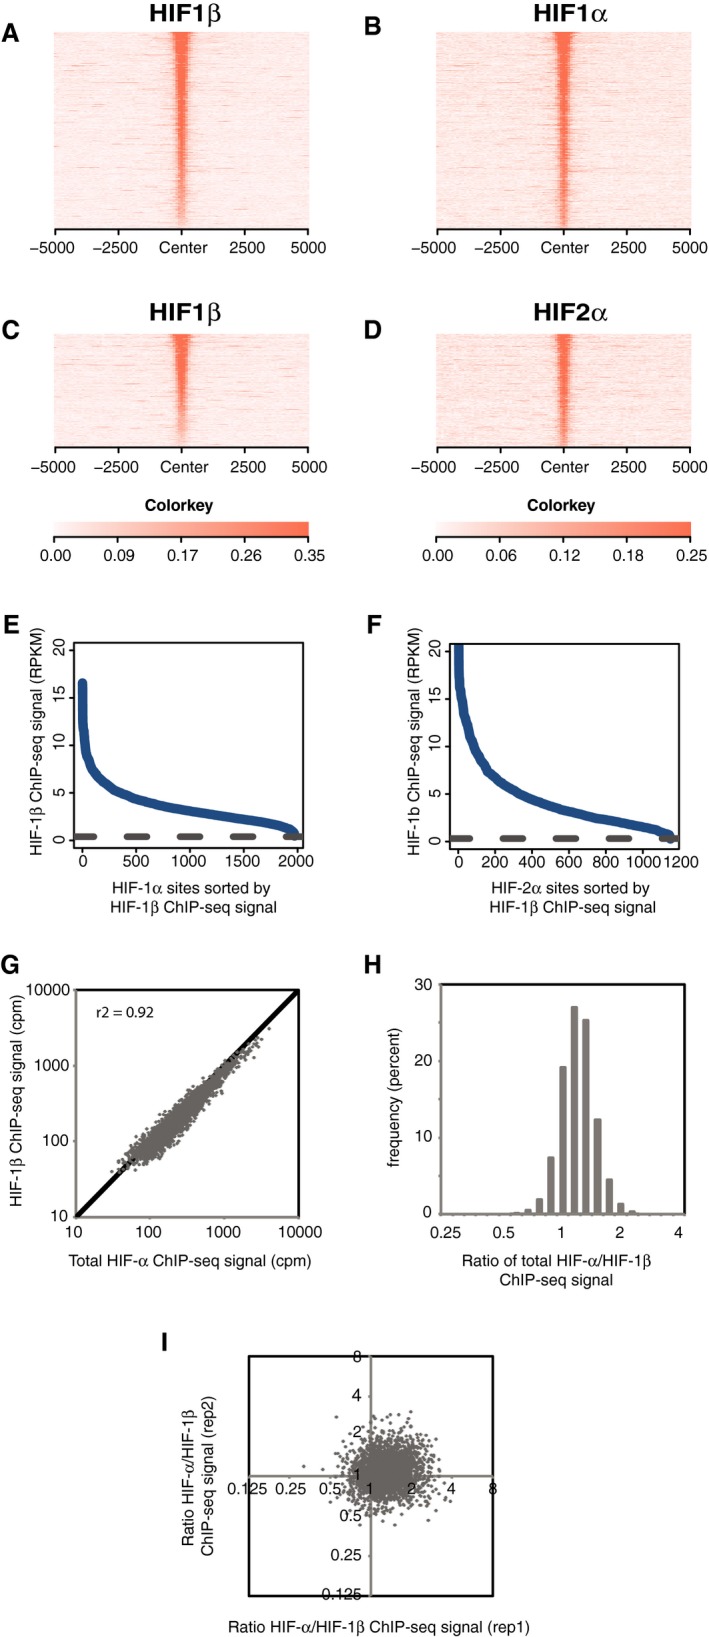
As described in Fig EV2, but in HepG2 cells that had been cultured in 0.5% oxygen for 16 h.
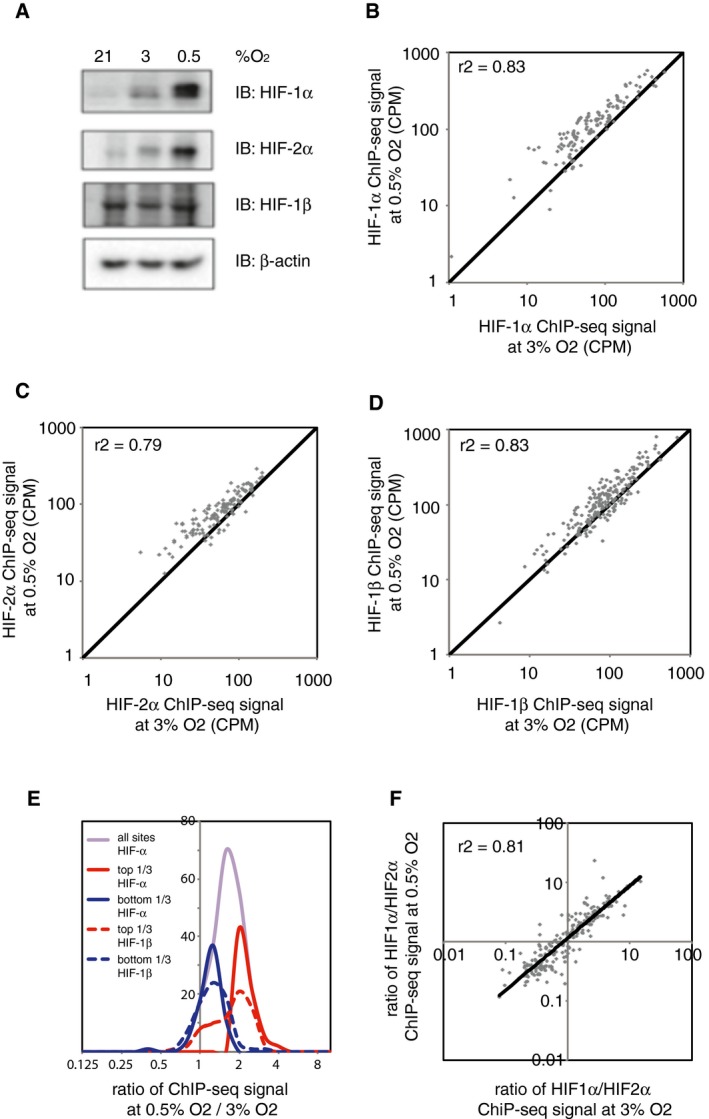
- A
Immunoblots show progressive induction of HIF‐1α and HIF‐2α protein levels with increasing severity of hypoxia.
- B–D
(B) HIF‐1α, (C) HIF‐2α and (D) HIF‐1β ChIP‐seq signal intensities (averaged across two independent ChIP‐seq experiments) at 0.5% hypoxia are plotted against those at 3% hypoxia for all canonical HIF binding sites that bound at one oxygen concentration or the other or both. ChIP‐seq signal was increased at 0.5% oxygen, but correlated well with that at 3% oxygen and no new sites were generated.
- E
Frequency distribution of ChIP‐seq signals at 0.5% oxygen compared to 3% oxygen. The ratio of total HIF‐α signal was unimodally distributed (purple line). Upper tertile HIF‐α sites (solid red line) had a significantly (P = 10−7, Wilcoxon rank sum test) higher ratio of HIF‐1β signal (dotted red line) and vice versa (blue lines).
- F
The ratio of HIF‐1α to HIF‐2α ChIP‐seq signal for all canonical HIF binding sites at 0.5% oxygen was plotted against that at 3% oxygen. A strong correlation in the HIF‐1α‐to‐HIF‐2α ratio was observed between the two oxygen concentrations.
- G
The ratio of HIF‐1α to HIF‐2α ChIP‐seq signal for all canonical HIF binding sites at 0.5% oxygen was plotted against that at 3% oxygen. A strong correlation in the HIF‐1α‐to‐HIF‐2α ratio was observed between the two oxygen concentrations.
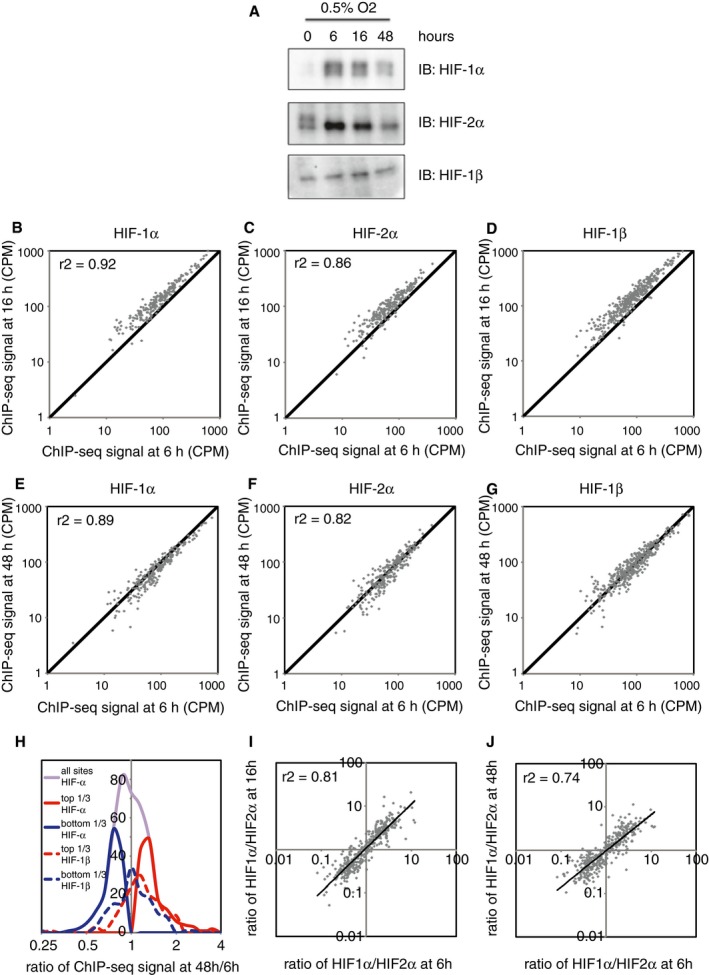
- A
Immunoblots show induction of HIF‐1α and HIF‐2α protein level, which is highest at 6 h and falls by 48 h.
- B–D
(B) HIF‐1α, (C) HIF‐2α and (D) HIF‐1β ChIP‐seq signal intensities (averaged across two independent ChIP‐seq experiments) at 16 h are plotted against those at 6 h for all canonical HIF binding sites that bound at any of the three time points. ChIP‐seq signal was increased at 16 h of hypoxia compared to 6 h of hypoxia, but correlated well between the two time points, and no novel sites were observed at either time point.
- E–G
The same plots comparing (E) HIF‐1α, (F) HIF‐2α and (G) HIF‐1β ChIP‐seq signals at 48 and 6 h of hypoxia. ChIP‐seq signal at 48 h correlated well with that at 6 h, and again, no novel sites were observed at either time point.
- H
Frequency distribution of ChIP‐seq signals at 48 h compared to 6 h of hypoxia. The ratio of total HIF‐α signal had a unimodal distribution (purple line). However, upper tertile HIF‐α sites (solid red line) had a comparable ratio of HIF‐1β signal (dotted red line) to the ratio of HIF‐1β signal in the lower tertile HIF‐α sites (blue lines), suggesting that differences in HIF‐α signal resulted from random variation rather than a true biological difference.
- I, J
The ratio of HIF‐1α to HIF‐2α ChIP‐seq signal for all canonical HIF binding sites at (I) 16 h of hypoxia and at (J) 48 h of hypoxia was plotted against that at 6 h of hypoxia. A strong correlation in the HIF‐1α‐to‐HIF‐2α ratio was observed between the various time points.
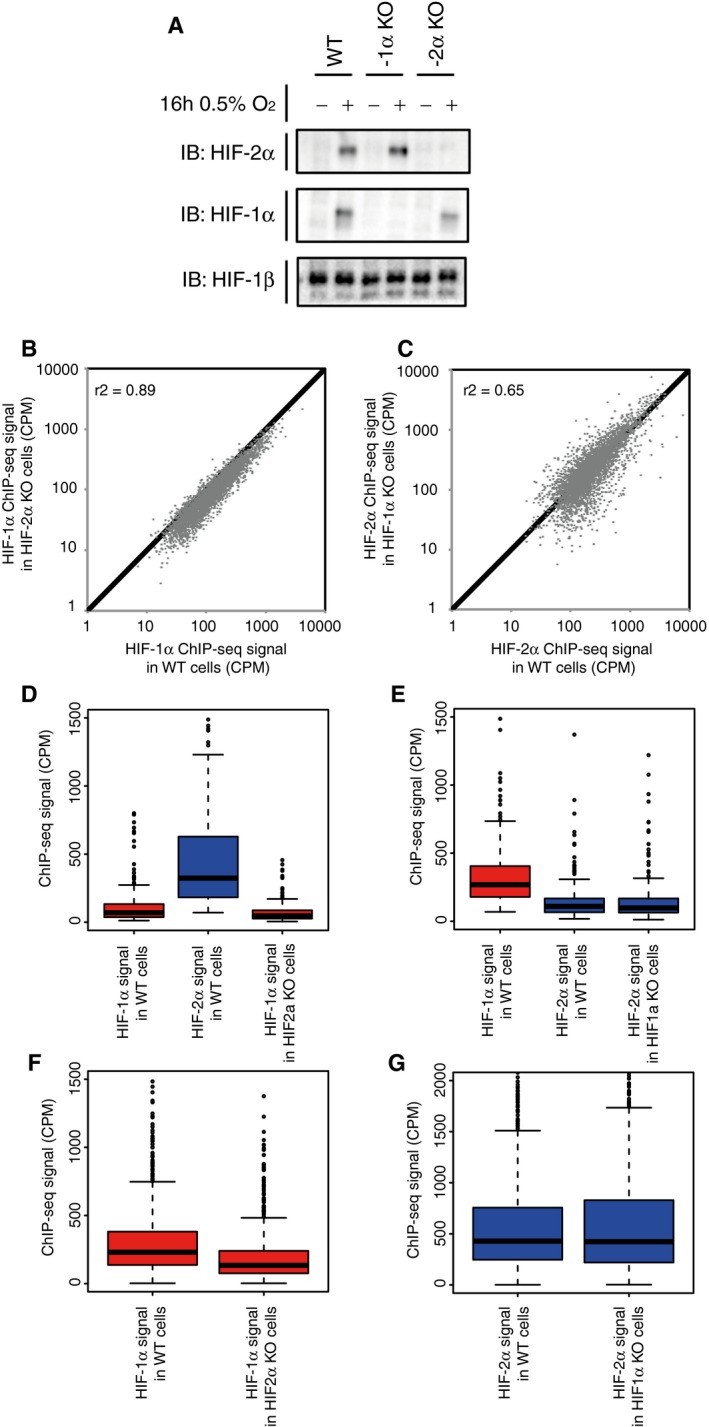
- A
Cells were incubated in 0.5% ambient oxygen for 16 h. Immunoblots show HIF‐1α, HIF‐2α and HIF‐1β protein levels in the wild‐type and single clones of CRISPR‐Cas9 engineered cell lines.
- B
HIF‐1α ChIP‐seq signal in the HIF‐2α KO cells was plotted against that in the wild‐type cells for all canonical HIF‐1 binding sites in either cell type.
- C
HIF‐2α ChIP‐seq signal in the HIF‐1α KO cells was plotted against that in the wild‐type cells for all canonical HIF‐2 binding sites in either cell type. No significant increase (Wilcoxon signed‐rank test) in binding of either isoform was observed following deletion of the other.
- D
Box‐and‐whisker plots showing the effect of HIF‐2α inactivation on HIF‐1α ChIP‐seq signal at sites that specifically bound HIF‐2α, but not HIF‐1α in wild‐type cells showing a slight, but significant (P = 4 × 10⁻⁵, Wilcoxon signed‐rank test) decrease rather than increase (compare red boxes) consistent with the reduction in HIF‐1α protein observed in panel (A).
- E
The effect of HIF‐1α inactivation on HIF‐2α ChIP‐seq signal (compare blue boxes) at sites that specifically bound HIF‐1α, but not HIF‐2α in wild‐type cells showing no significant effect (P = 0.5, Wilcoxon signed‐rank test).
- F, G
The effect, at sites that bind both isoforms in wild‐type cells, of (F) HIF‐2α inactivation on HIF‐1α binding intensity showing a similar small but significant reduction rather than increase (P = 2 × 10⁻¹⁶, Wilcoxon signed‐rank test) as above and of (G) HIF‐1α inactivation on HIF‐2α binding intensity showing no significant effect (P = 0.4, Wilcoxon signed‐rank test).
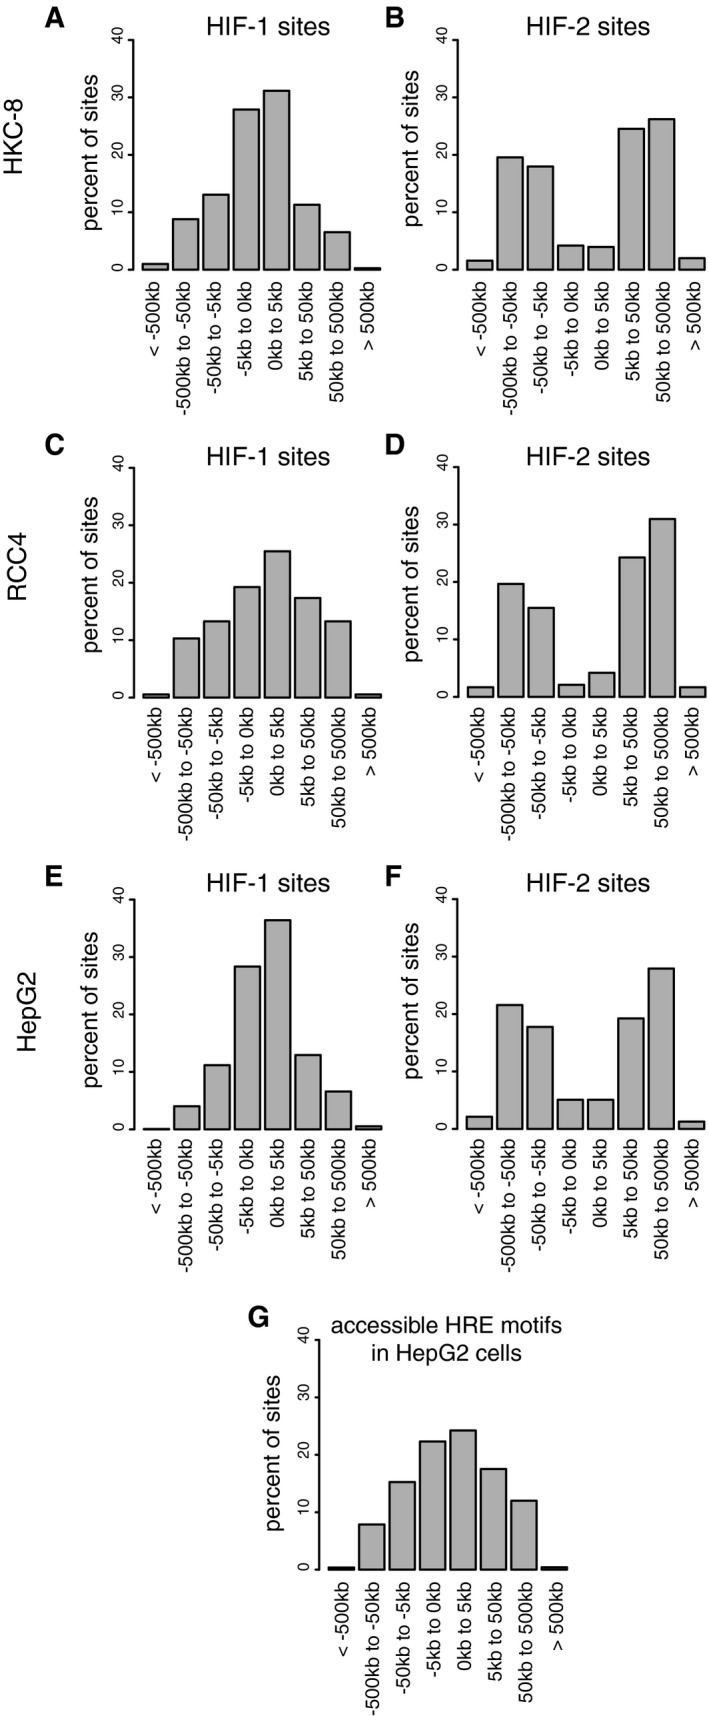
- A–F
Canonical HIF‐1 and HIF‐2 binding sites were determined by overlap of HIF‐α and HIF‐1β binding sites identified by the MACS peak caller as for Fig 4. The distance from each binding site to the nearest annotated gene promoter was determined and plotted as a frequency distribution for (A) HIF‐1 and (B) HIF‐2 sites in HKC‐8 cells, (C) HIF‐1 and (D) HIF‐2 sites in RCC4 cells, and (E) HIF‐1 and (F) HIF‐2 sites in HepG2 cells. The distribution of HIF‐1 binding sites was consistently more promoter‐proximal than HIF‐2 sites despite the sites themselves differing between cell types.
- G
The distribution of accessible HRE motifs was also plotted in HepG2 cells and differed significantly from that of both HIF‐1 (P˜10−50) and HIF‐2 (P˜10−80) binding sites (chi‐squared test).
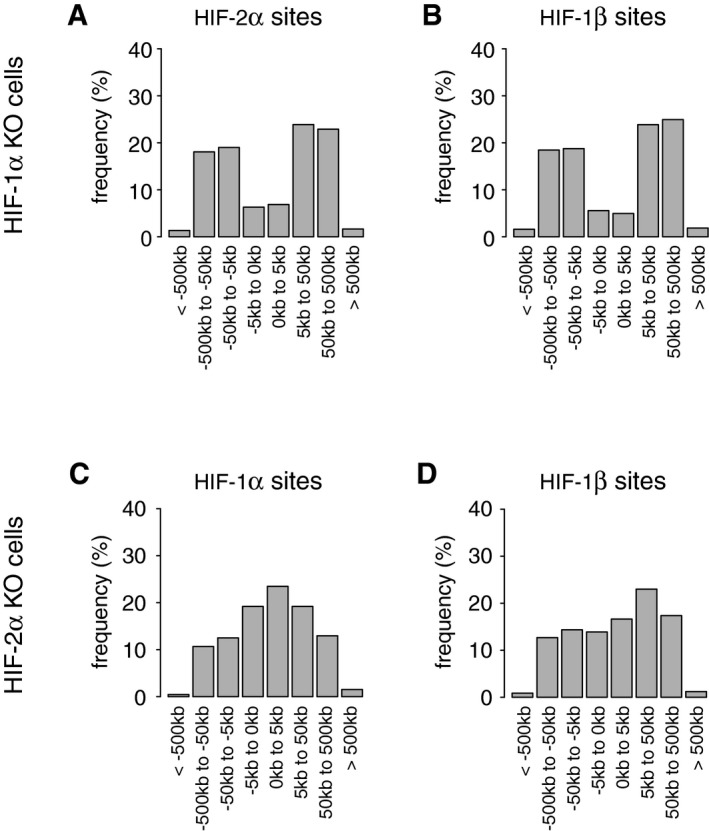
- A, B
(A) HIF‐2α and (B) HIF‐1β binding sites in HKC‐8 cells (present in both independent ChIP‐seq analyses) in which HIF‐1α had been deleted were identified using the MACS and T‐PIC peak callers. HIF‐1β had a promoter‐distant binding distribution comparable to that of HIF‐2α.
- C, D
The distributions of (C) HIF‐1α and (D) HIF‐1β binding sites in HKC‐8 cells in which HIF‐2α had been deleted show that the distribution of HIF‐1β had changed to resemble that of HIF‐1α. Cells were incubated in 0.5% oxygen for 16 h.
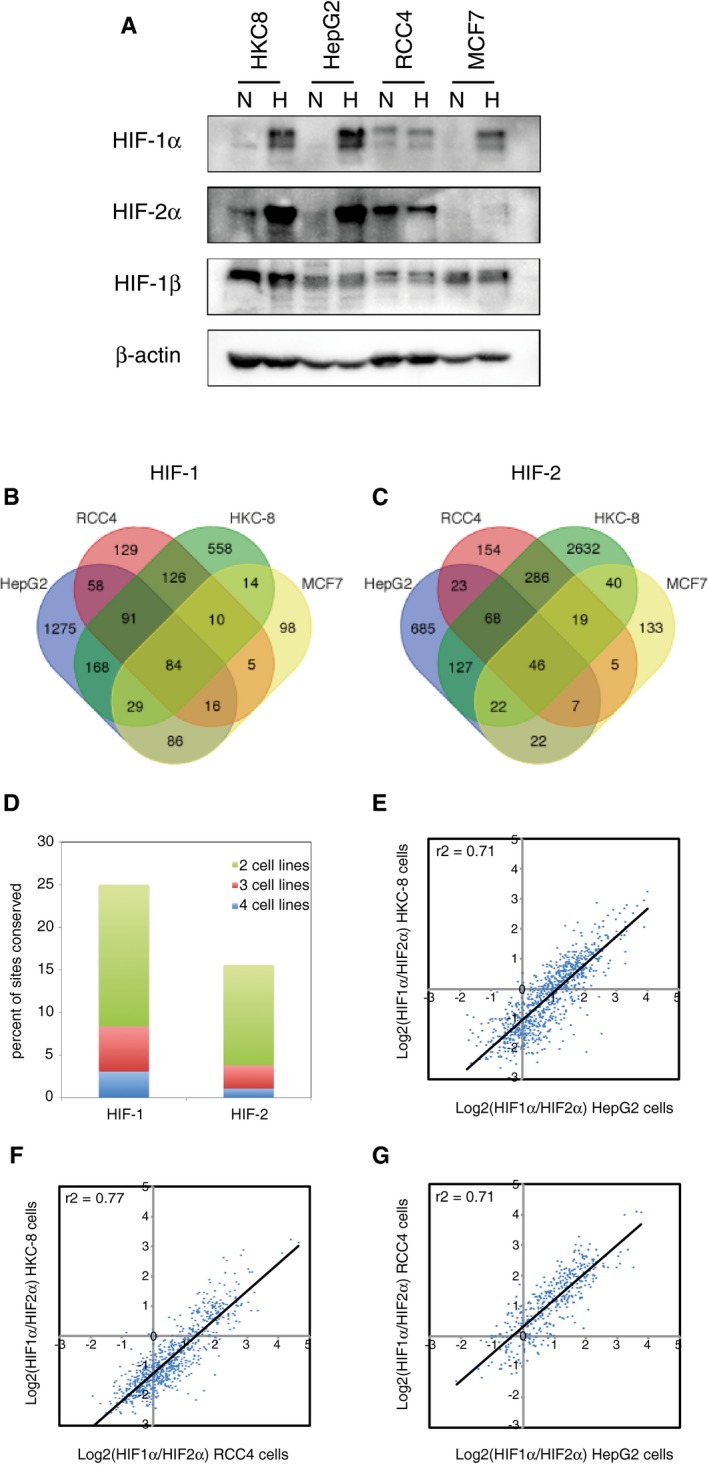
- A
Immunoblots showing HIF‐1α, HIF‐2α and HIF‐1β protein levels in HKC‐8, HepG2, RCC4 and MCF‐7 cell lines in normoxia and following 16‐h incubation at 0.5% oxygen.
- B, C
Sites that bound (B) canonical HIF‐1 (i.e. identified in both HIF‐1α and both HIF‐1β ChIP‐seq experiments) or (C) canonical HIF‐2 (i.e. identified in both HIF‐2α and both HIF‐1β ChIP‐seq experiments) were identified from ChIP‐seq datasets in HepG2 and HKC‐8 cells following 16‐h incubation in 0.5% oxygen and from normoxic RCC4 cells and compared with previously published data from MCF‐7 cells.
- D
The proportion of total HIF‐1 or HIF‐2 sites that were shared between two, three and four cell lines is plotted.
- E‐G
For sites that are shared between (E) HepG2 and HKC‐8 cells, (F) HKC‐8 and RCC4 cells, or (G) RCC4 and HepG2 cells, the ratio of HIF‐1α/HIF‐2α signal for one cell line was plotted against the other. The ratio of HIF‐1α/HIF‐2α in one cell line correlates well with that in the other. ChIP‐seq signal is averaged across two independent experiments.
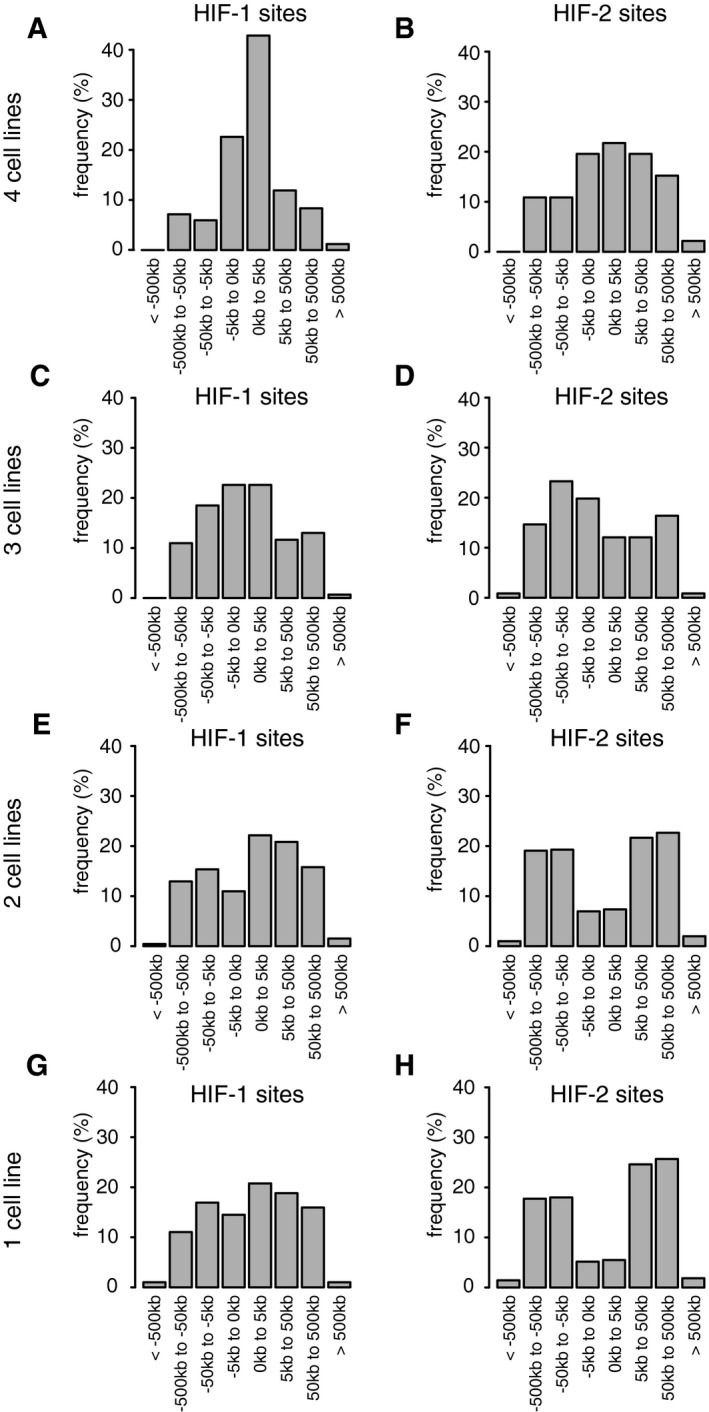
- A–H
Canonical HIF‐1 (A, C, E and G) and HIF‐2 (B, D, F and H) binding sites (present in both independent ChIP‐seq analyses) were identified using the MACS and T‐PIC peak callers. For sites conserved in four (A and B), three (C and D), two (E and F) cell lines or unique to one cell line only (G and H), the distribution of sites around the nearest promoter was plotted. The more highly conserved sites were more promoter‐proximal than unique sites, particularly for HIF‐1. Cells were incubated in 0.5% oxygen for 16 h.
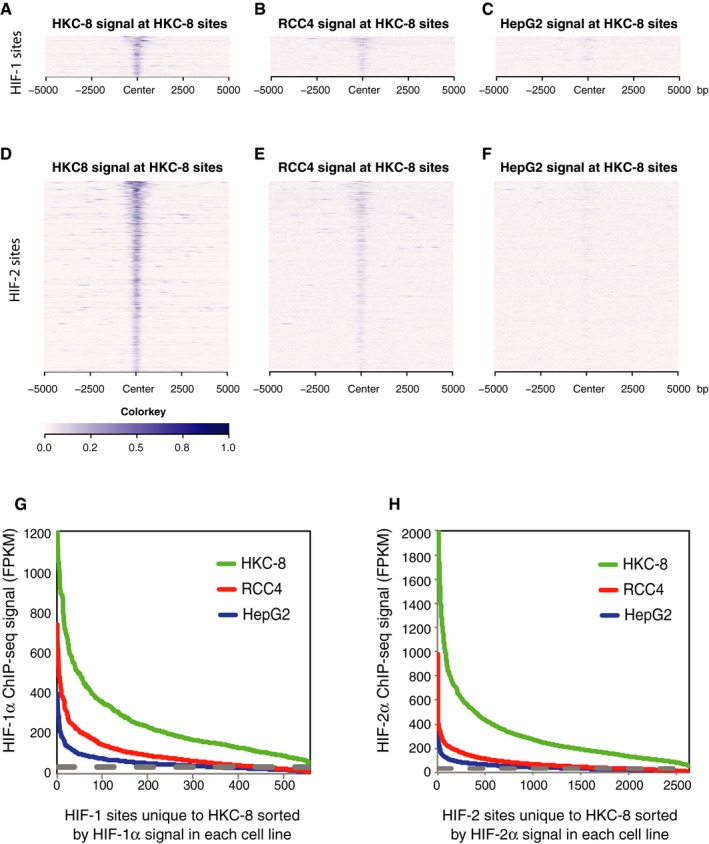
- A–C
Heatmaps show HIF‐1α ChIP‐seq signal (read counts per million mapped reads, CPM; expressed as colour intensity, averaged across two independent ChIP‐seq experiments) at these HIF‐1α sites and across the flanking ±5 kb regions (x‐axis) in (A) HKC‐8 cells, (B) RCC4 cells and (C) HepG2 cells.
- D–F
The same analysis for HIF‐2α signal at HIF‐2α sites unique to HKC‐8 cells.
- G
Line plots showing HIF‐1α signal intensity at HIF‐1α binding sites identified by the MACS peak caller as binding in HKC‐8 cells, but not RCC4 or HepG2 cells and ranked according to signal intensity in each individual cell type.
- H
The same analysis for HIF‐2α signal at HIF‐2α sites unique to HKC‐8 cells.
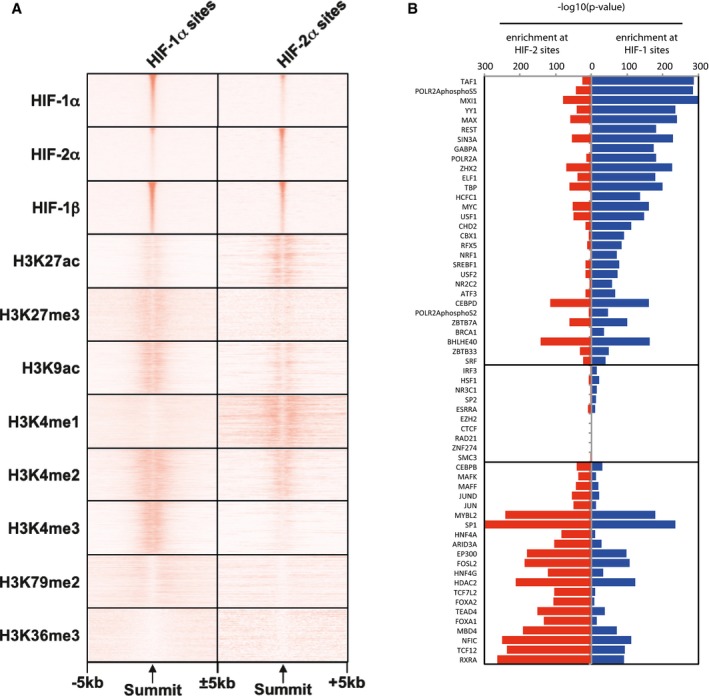
Heatmaps showing average (n = 2, independent ChIP‐seq experiments) ChIP‐seq signal (read counts per million mapped reads, CPM; expressed as colour intensity) at canonical HIF‐1 and HIF‐2 binding sites and across the flanking ±5 kb regions (x‐axis) in HepG2 cells incubated in 0.5% oxygen for 16 h. Sites are ordered on the y‐axis according to HIF signal derived from HepG2 cells incubated in hypoxia. ChIP‐seq signal for histone modifications was obtained from ENCODE and was derived from HepG2 cells incubated in normoxia.
Bar chart showing enrichment of transcription factor binding sites (TFBSs) at canonical HIF‐1 and HIF‐2 sites in HepG2 cells (identified as in Fig 4). TFBSs for 61 additional DNA‐binding proteins were determined from ENCODE ChIP‐seq data in normoxic HepG2 cells. The significance of the overlap between each set of binding sites and canonical HIF‐1 and HIF‐2 sites was determined using a hypergeometric test. Accessible sites determined from ENCODE DNase‐seq data in HepG2 cells were used as a negative control.
References
-
- Ortiz‐Barahona A, Villar D, Pescador N, Amigo J, del Peso L (2010) Genome‐wide identification of hypoxia‐inducible factor binding sites and target genes by a probabilistic model integrating transcription‐profiling data and in silico binding site prediction. Nucleic Acids Res 38: 2332–2345 - PMC - PubMed
-
- Holmquist‐Mengelbier L, Fredlund E, Lofstedt T, Noguera R, Navarro S, Nilsson H, Pietras A, Vallon‐Christersson J, Borg A, Gradin K et al (2006) Recruitment of HIF‐1alpha and HIF‐2alpha to common target genes is differentially regulated in neuroblastoma: HIF‐2alpha promotes an aggressive phenotype. Cancer Cell 10: 413–423 - PubMed
-
- Kaelin WG Jr, Ratcliffe PJ (2008) Oxygen sensing by metazoans: the central role of the HIF hydroxylase pathway. Mol Cell 30: 393–402 - PubMed
-
- Wenger RH, Stiehl DP, Camenisch G (2005) Integration of oxygen signaling at the consensus HRE. Sci STKE 2005: re12 - PubMed
Publication types
MeSH terms
Substances
Grants and funding
LinkOut - more resources
Full Text Sources
Molecular Biology Databases
Research Materials
