

Obesity-associated exosomal miRNAs modulate glucose and lipid metabolism in mice
- PMID: 30429322
- PMCID: PMC6275521
- DOI: 10.1073/pnas.1808855115
Obesity-associated exosomal miRNAs modulate glucose and lipid metabolism in mice
Abstract
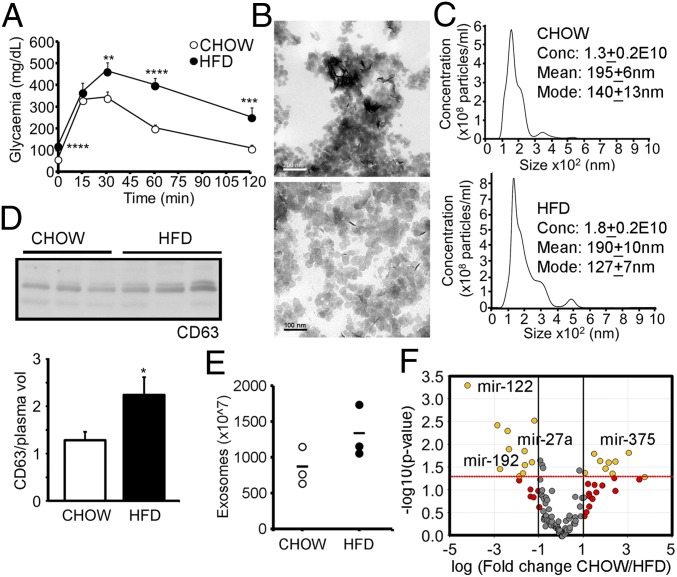
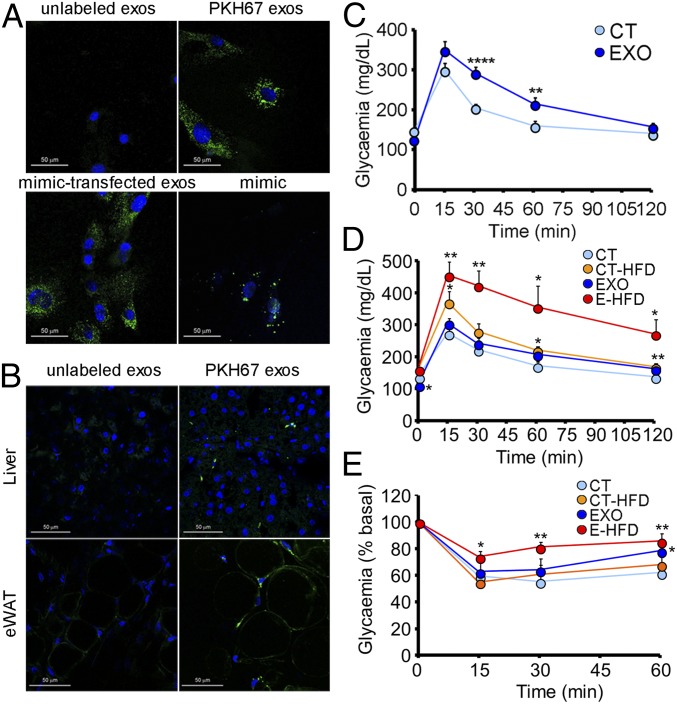
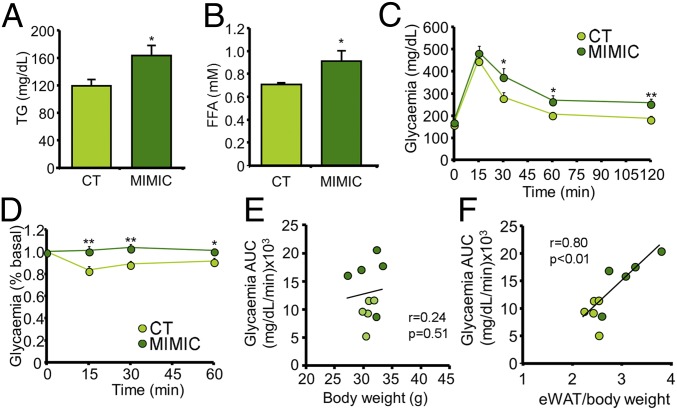
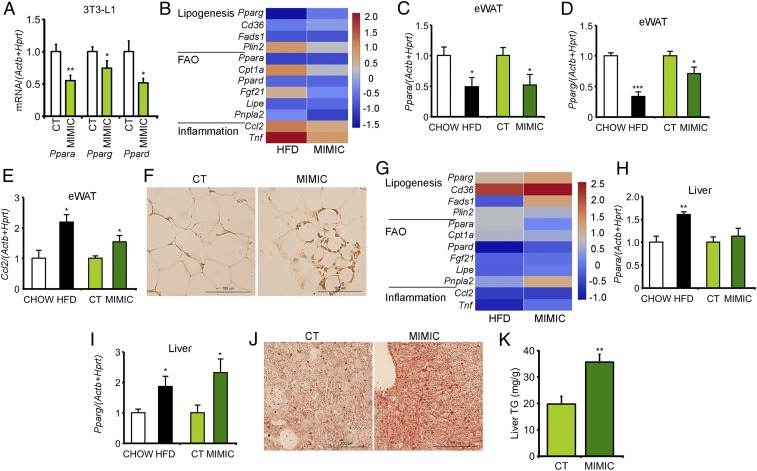
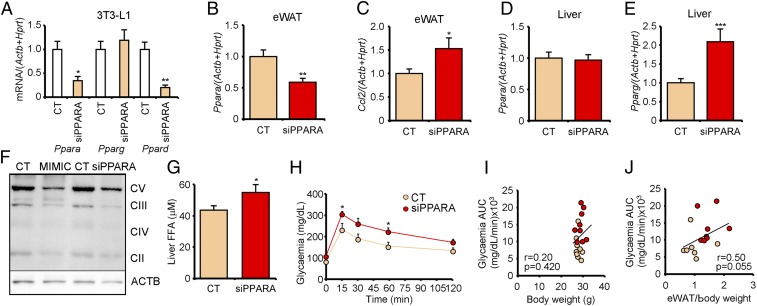
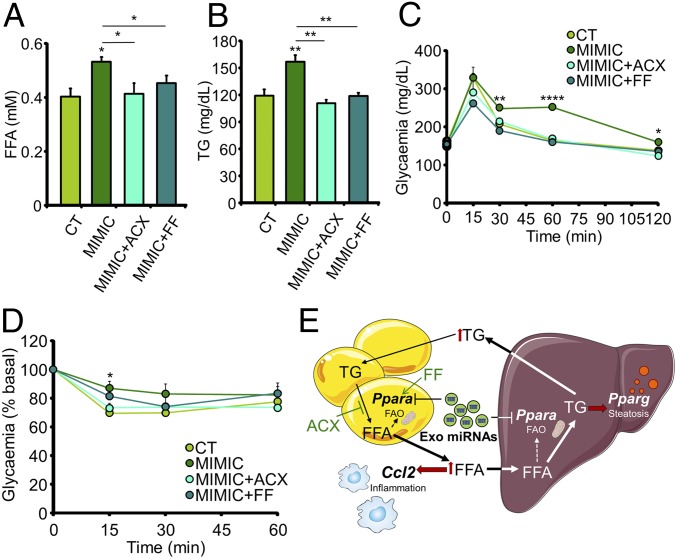
Obesity is frequently associated with metabolic disease. Here, we show that obesity changes the miRNA profile of plasma exosomes in mice, including increases in miR-122, miR-192, miR-27a-3p, and miR-27b-3p Importantly, treatment of lean mice with exosomes isolated from obese mice induces glucose intolerance and insulin resistance. Moreover, administration of control exosomes transfected with obesity-associated miRNA mimics strongly induces glucose intolerance in lean mice and results in central obesity and hepatic steatosis. Expression of the candidate target gene Ppara is decreased in white adipose tissue but not in the liver of mimic-treated (MIMIC) mice, and this is accompanied by increased circulating free fatty acids and hypertriglyceridemia. Treatment with a specific siRNA targeting Ppara transfected into exosomes recapitulates the phenotype induced by obesity-associated miRNAs. Importantly, simultaneously reducing free fatty acid plasma levels in MIMIC mice with either the lipolysis inhibitor acipimox or the PPARα agonist fenofibrate partially protects against these metabolic alterations. Overall, our data highlight the central role of obesity-associated exosomal miRNAs in the etiopathogeny of glucose intolerance and dyslipidemia.
Keywords: adiposity; dyslipidemia; exosome; glucose intolerance; miRNA.
Conflict of interest statement
The authors declare no conflict of interest.
Figures
Similar articles
-
Hepatic exosome-derived miR-130a-3p attenuates glucose intolerance via suppressing PHLPP2 gene in adipocyte.Metabolism. 2020 Feb;103:154006. doi: 10.1016/j.metabol.2019.154006. Epub 2019 Nov 10. Metabolism. 2020. PMID: 31715176
-
Delivery of muscle-derived exosomal miRNAs induced by HIIT improves insulin sensitivity through down-regulation of hepatic FoxO1 in mice.Proc Natl Acad Sci U S A. 2020 Dec 1;117(48):30335-30343. doi: 10.1073/pnas.2016112117. Epub 2020 Nov 16. Proc Natl Acad Sci U S A. 2020. PMID: 33199621 Free PMC article.
-
Exosomal miR-27b-3p secreted by visceral adipocytes contributes to endothelial inflammation and atherogenesis.Cell Rep. 2023 Jan 31;42(1):111948. doi: 10.1016/j.celrep.2022.111948. Epub 2023 Jan 6. Cell Rep. 2023. PMID: 36640325
-
MicroRNAs and other non-coding RNAs in adipose tissue and obesity: emerging roles as biomarkers and therapeutic targets.Clin Sci (Lond). 2019 Jan 3;133(1):23-40. doi: 10.1042/CS20180890. Print 2019 Jan 15. Clin Sci (Lond). 2019. PMID: 30606812 Review.
-
Adipose-derived exosomes: A novel adipokine in obesity-associated diabetes.J Cell Physiol. 2019 Aug;234(10):16692-16702. doi: 10.1002/jcp.28354. Epub 2019 Feb 26. J Cell Physiol. 2019. PMID: 30807657 Review.
Cited by
-
Obesity-related hypoxia via miR-128 decreases insulin-receptor expression in human and mouse adipose tissue promoting systemic insulin resistance.EBioMedicine. 2020 Sep;59:102912. doi: 10.1016/j.ebiom.2020.102912. Epub 2020 Jul 29. EBioMedicine. 2020. PMID: 32739259 Free PMC article.
-
Men and women display distinct extracellular vesicle biomarker signatures in response to military operational stress.J Appl Physiol (1985). 2022 May 1;132(5):1125-1136. doi: 10.1152/japplphysiol.00664.2021. Epub 2022 Mar 17. J Appl Physiol (1985). 2022. PMID: 35297690 Free PMC article.
-
Differences in liver microRNA profiling in pigs with low and high feed efficiency.J Anim Sci Technol. 2022 Mar;64(2):312-329. doi: 10.5187/jast.2022.e4. Epub 2022 Mar 31. J Anim Sci Technol. 2022. PMID: 35530409 Free PMC article.
-
microRNA-27b regulates hepatic lipase enzyme LIPC and reduces triglyceride degradation during hepatitis C virus infection.J Biol Chem. 2022 Jun;298(6):101983. doi: 10.1016/j.jbc.2022.101983. Epub 2022 Apr 25. J Biol Chem. 2022. PMID: 35483451 Free PMC article.
-
Role of Exosomes in Chronic Liver Disease Development and Their Potential Clinical Applications.J Immunol Res. 2022 May 6;2022:1695802. doi: 10.1155/2022/1695802. eCollection 2022. J Immunol Res. 2022. PMID: 35571570 Free PMC article. Review.
References
-
- Guay C, Regazzi R. Exosomes as new players in metabolic organ cross-talk. Diabetes Obes Metab. 2017;19:137–146. - PubMed
-
- Chen X, et al. Characterization of microRNAs in serum: A novel class of biomarkers for diagnosis of cancer and other diseases. Cell Res. 2008;18:997–1006. - PubMed
-
- Párrizas M, Novials A. Circulating microRNAs as biomarkers for metabolic disease. Best Pract Res Clin Endocrinol Metab. 2016;30:591–601. - PubMed
-
- Párrizas M, et al. Circulating miR-192 and miR-193b are markers of prediabetes and are modulated by an exercise intervention. J Clin Endocrinol Metab. 2015;100:E407–E415. - PubMed
Publication types
MeSH terms
Substances
LinkOut - more resources
Full Text Sources
Medical
Molecular Biology Databases
