

Epstein-Barr virus enhances genome maintenance of Kaposi sarcoma-associated herpesvirus
- PMID: 30429324
- PMCID: PMC6275488
- DOI: 10.1073/pnas.1810128115
Epstein-Barr virus enhances genome maintenance of Kaposi sarcoma-associated herpesvirus
Abstract
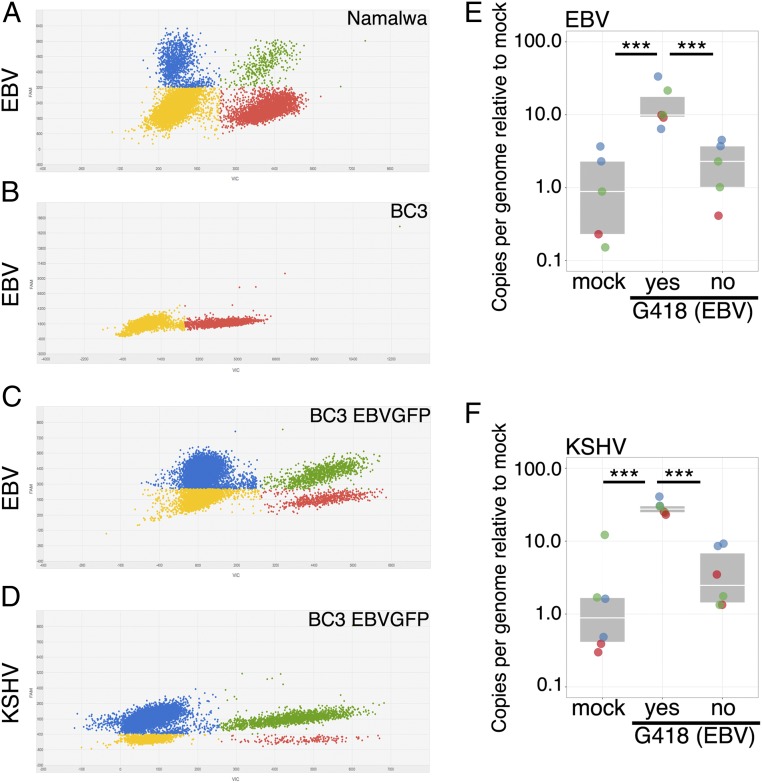
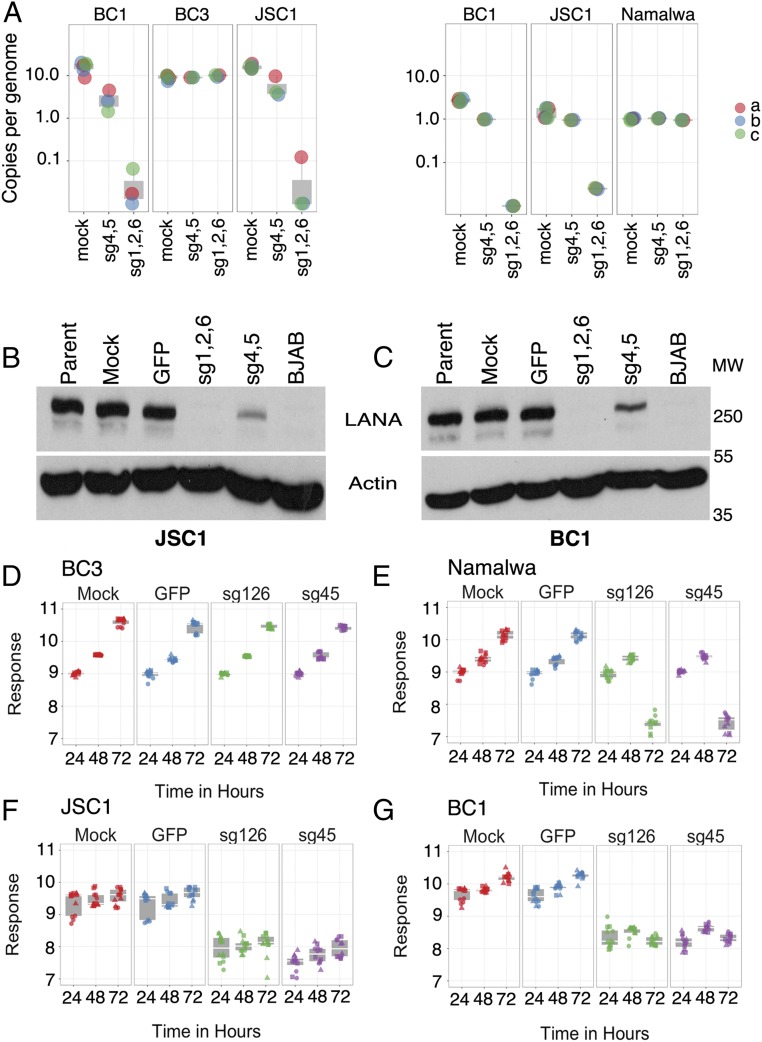
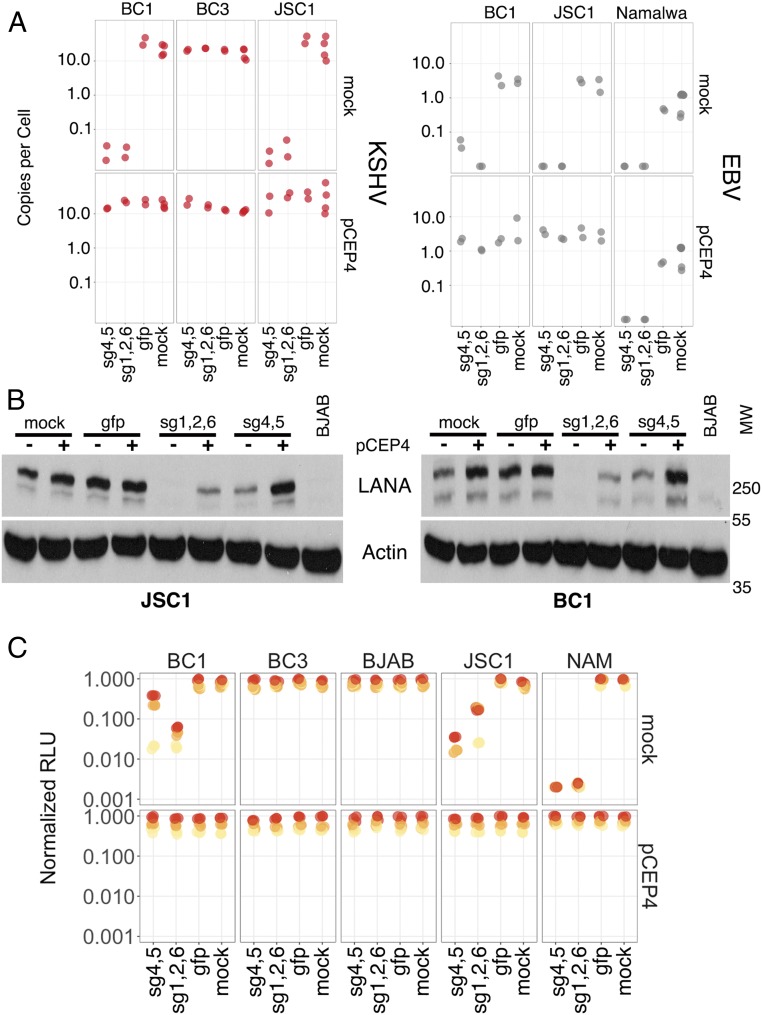
Primary effusion lymphoma (PEL) is a B cell lymphoma that is always associated with Kaposi's sarcoma-associated herpesvirus (KSHV) and in many cases also with Epstein-Barr virus (EBV); however, the requirement for EBV coinfection is not clear. Here, we demonstrate that adding exogenous EBV to KSHV+ single-positive PEL leads to increased KSHV genome maintenance and KSHV latency-associated nuclear antigen (LANA) expression. To show that EBV was necessary for naturally coinfected PEL, we nucleofected KSHV+/EBV+ PEL cell lines with an EBV-specific CRISPR/Cas9 plasmid to delete EBV and observed a dramatic decrease in cell viability, KSHV genome copy number, and LANA expression. This phenotype was reversed by expressing Epstein-Barr nuclear antigen 1 (EBNA-1) in trans, even though EBNA-1 and LANA do not colocalize in infected cells. This work reveals that EBV EBNA-1 plays an essential role in the pathogenesis of PEL by increasing KSHV viral load and LANA expression.
Keywords: EBV; KSHV; Kaposi sarcoma; LANA; primary effusion lymphoma.
Conflict of interest statement
The authors declare no conflict of interest.
Figures


Similar articles
-
Activated Nrf2 Interacts with Kaposi's Sarcoma-Associated Herpesvirus Latency Protein LANA-1 and Host Protein KAP1 To Mediate Global Lytic Gene Repression.J Virol. 2015 Aug;89(15):7874-92. doi: 10.1128/JVI.00895-15. Epub 2015 May 20. J Virol. 2015. PMID: 25995248 Free PMC article.
-
Reduction of Kaposi's Sarcoma-Associated Herpesvirus Latency Using CRISPR-Cas9 To Edit the Latency-Associated Nuclear Antigen Gene.J Virol. 2019 Mar 21;93(7):e02183-18. doi: 10.1128/JVI.02183-18. Print 2019 Apr 1. J Virol. 2019. PMID: 30651362 Free PMC article.
-
Convergence of Kaposi's sarcoma-associated herpesvirus reactivation with Epstein-Barr virus latency and cellular growth mediated by the notch signaling pathway in coinfected cells.J Virol. 2010 Oct;84(20):10488-500. doi: 10.1128/JVI.00894-10. Epub 2010 Aug 4. J Virol. 2010. PMID: 20686042 Free PMC article.
-
[Epstein-Barr virus (EBV) and Kaposi's sarcoma-associated herpesvirus (KSHV, HHV-8)].Uirusu. 2010 Dec;60(2):237-45. doi: 10.2222/jsv.60.237. Uirusu. 2010. PMID: 21488336 Review. Japanese.
-
KSHV Genome Replication and Maintenance in Latency.Adv Exp Med Biol. 2018;1045:299-320. doi: 10.1007/978-981-10-7230-7_14. Adv Exp Med Biol. 2018. PMID: 29896673 Review.
Cited by
-
Roles of Lytic Viral Replication and Co-Infections in the Oncogenesis and Immune Control of the Epstein-Barr Virus.Cancers (Basel). 2021 May 10;13(9):2275. doi: 10.3390/cancers13092275. Cancers (Basel). 2021. PMID: 34068598 Free PMC article. Review.
-
The Double-Edged Sword Role of Viruses in Gastric Cancer.Cancers (Basel). 2020 Jun 24;12(6):1680. doi: 10.3390/cancers12061680. Cancers (Basel). 2020. PMID: 32599870 Free PMC article. Review.
-
Natural Killer Cell Responses during Human γ-Herpesvirus Infections.Vaccines (Basel). 2021 Jun 15;9(6):655. doi: 10.3390/vaccines9060655. Vaccines (Basel). 2021. PMID: 34203904 Free PMC article. Review.
-
Designer nucleases to treat malignant cancers driven by viral oncogenes.Virol J. 2021 Jan 13;18(1):18. doi: 10.1186/s12985-021-01488-1. Virol J. 2021. PMID: 33441159 Free PMC article. Review.
-
Molecular Mechanisms of Kaposi Sarcoma-Associated Herpesvirus (HHV8)-Related Lymphomagenesis.Cancers (Basel). 2024 Oct 31;16(21):3693. doi: 10.3390/cancers16213693. Cancers (Basel). 2024. PMID: 39518131 Free PMC article. Review.
References
-
- Gloghini A, et al. Multiple viral infections in primary effusion lymphoma: A model of viral cooperation in lymphomagenesis. Expert Rev Hematol. 2017;10:505–514. - PubMed
-
- Arvanitakis L, et al. Establishment and characterization of a primary effusion (body cavity-based) lymphoma cell line (BC-3) harboring Kaposi’s sarcoma-associated herpesvirus (KSHV/HHV-8) in the absence of Epstein-Barr virus. Blood. 1996;88:2648–2654. - PubMed
-
- Cesarman E, et al. In vitro establishment and characterization of two acquired immunodeficiency syndrome-related lymphoma cell lines (BC-1 and BC-2) containing Kaposi’s sarcoma-associated herpesvirus-like (KSHV) DNA sequences. Blood. 1995;86:2708–2714. - PubMed
-
- Boshoff C, et al. Establishing a KSHV+ cell line (BCP-1) from peripheral blood and characterizing its growth in Nod/SCID mice. Blood. 1998;91:1671–1679. - PubMed
Publication types
MeSH terms
Substances
Grants and funding
LinkOut - more resources
Full Text Sources
Medical
Molecular Biology Databases
Research Materials
