. 2018 Nov 14;10(467):eaat5933.
doi: 10.1126/scitranslmed.aat5933.

Sodium-glucose transporter 2 is a diagnostic and therapeutic target for early-stage lung adenocarcinoma

Affiliations

Sodium-glucose transporter 2 is a diagnostic and therapeutic target for early-stage lung adenocarcinoma

Claudio R Scafoglio et al. Sci Transl Med. .

Abstract

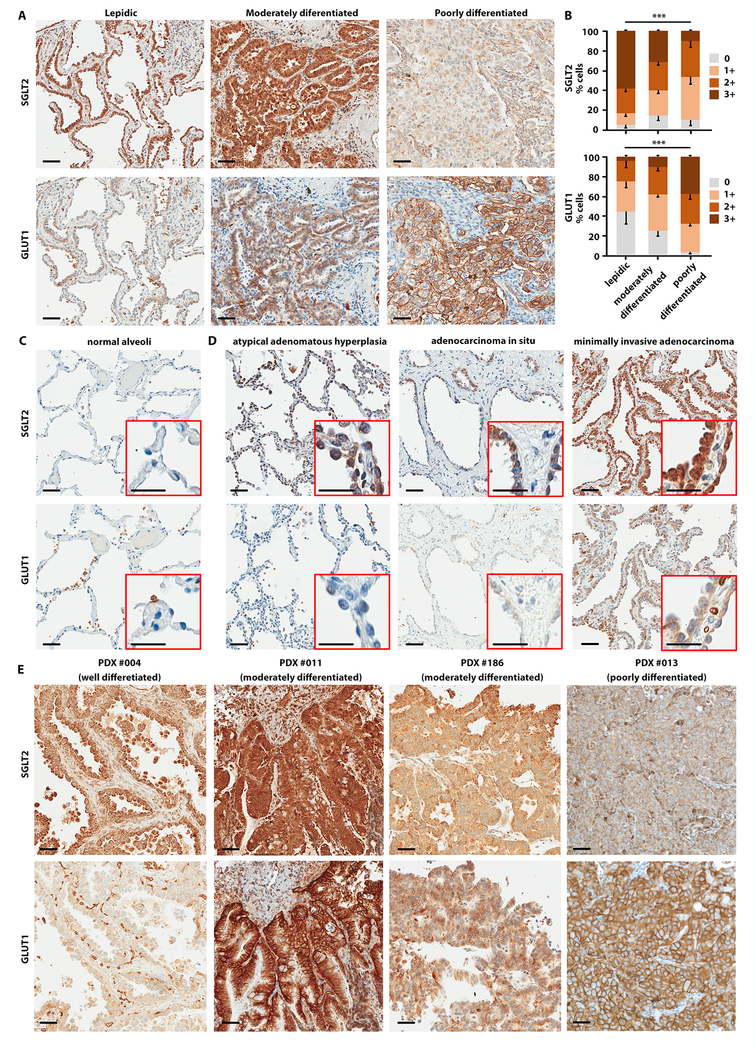
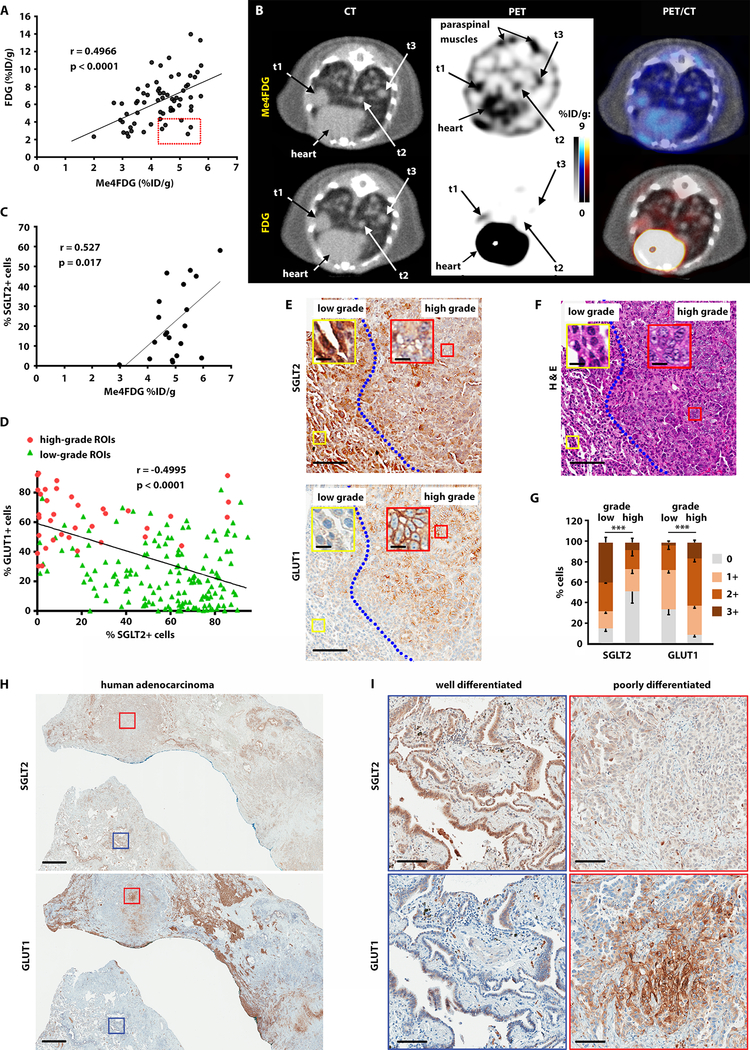
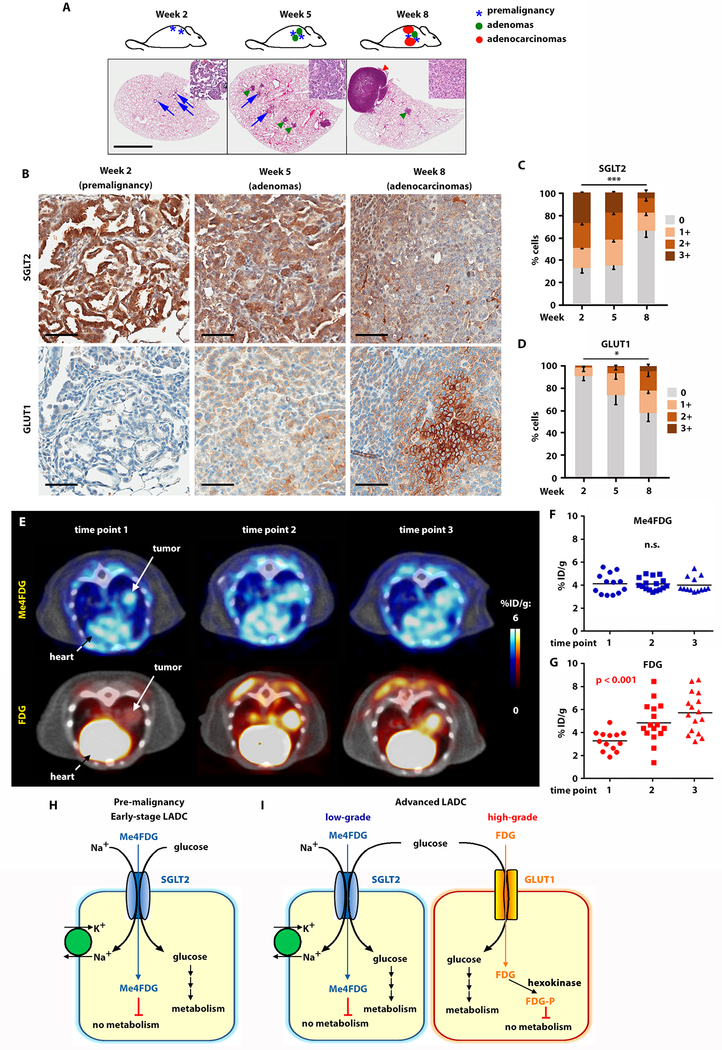
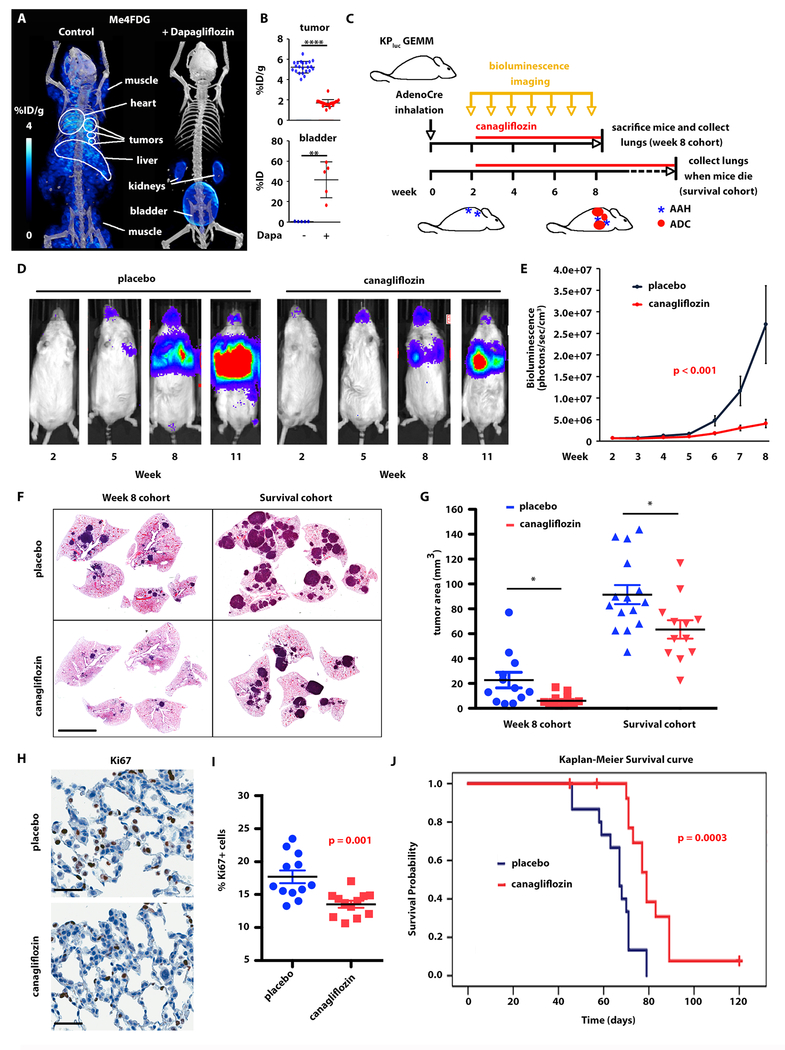
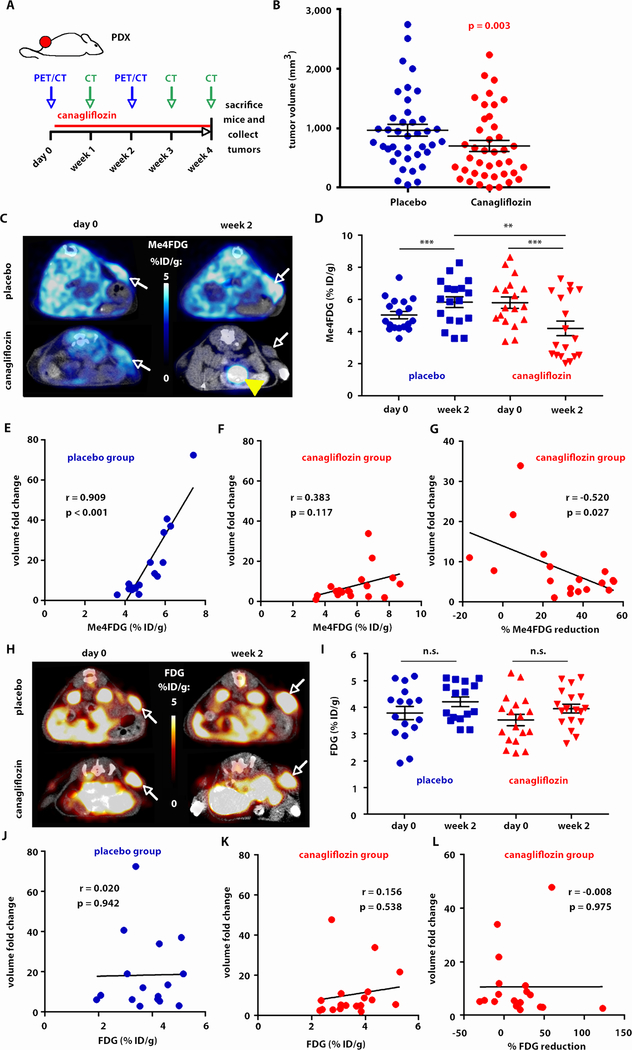
The diagnostic definition of indeterminate lung nodules as malignant or benign poses a major challenge for clinicians. We discovered a potential marker, the sodium-dependent glucose transporter 2 (SGLT2), whose activity identified metabolically active lung premalignancy and early-stage lung adenocarcinoma (LADC). We found that SGLT2 is expressed early in lung tumorigenesis and is found specifically in premalignant lesions and well-differentiated adenocarcinomas. SGLT2 activity could be detected in vivo by positron emission tomography (PET) with the tracer methyl 4-deoxy-4-[18F] fluoro-alpha-d-glucopyranoside (Me4FDG), which specifically detects SGLT activity. Using a combination of immunohistochemistry and Me4FDG PET, we identified high expression and functional activity of SGLT2 in lung premalignancy and early-stage/low-grade LADC. Furthermore, selective targeting of SGLT2 with FDA-approved small-molecule inhibitors, the gliflozins, greatly reduced tumor growth and prolonged survival in autochthonous mouse models and patient-derived xenografts of LADC. Targeting SGLT2 in lung tumors may intercept lung cancer progression at early stages of development by pairing Me4FDG PET imaging with therapy using SGLT2 inhibitors.


Conflict of interest statement

Competing interests: S.M.D. is on the Advisory Board of Early Diagnostics, Inc., T-Cure, and AstraZeneca. The tracer Me4FDG is covered by a UCLA patent application: Tracers for monitoring the activity of sodium/glucose co-transporters in health and disease. E.M. Wright, J.R. Barrio, B. Hirayama, and V. Kepe. IP filing date: 05/23/2006; 11/920,904; U.S. Patent 8,845,999. All other authors declare that they have no competing interests.

Figures

Fig. 1.
Fig. 1.. SGLT2 is expressed in low-grade and GLUT1 in high-grade human lung adenocarcinoma
Immunohistochemistry was performed in human LADC samples with antibodies specific for SGLT2 and GLUT1. A) Invasive adenocarcinomas, different disease grades, as indicated. B) Quantification of SGLT2 (upper panel) and GLUT1 (lower panel) staining in different disease grades of LADC, measured by Jonchkeere-Terpstra test. ***p < 0.001. Scale bars: 50 μm. C) Normal alveoli. D) Pre-malignant lesions: atypical adenomatous hyperplasia, adenocarcinoma in situ, and minimally invasive adenocarcinoma. Scale bars: 50 μm (insert: 25 μm). E) Expression of SGLT2 and GLUT1 in different PDX models of LADC: well-moderately differentiated (PDX #004), moderately differentiated (PDXs #186 and #011), and poorly differentiated (PDX # 013). Scale bars: 50 μm.
Fig. 2.
Fig. 2.. Glucose transporter expression and activity in lung adenocarcinoma is heterogeneous.
A) KPluc mice were imaged with Me4FDG and FDG; the scatter plot reports the uptake of ROIs corresponding to single LADC nodules, expressed as percentage of injected dose per gram of tissue (%ID/g). The red box highlights tumors with high Me4FDG and low FDG uptake. The correlation was calculated using Pearson’s coefficient (r). B) Representative transverse sections of the PET/CT images show three distinct tumor nodules, t1, t2, and t3. Uptake of Me4FDG is detectable in small nodules (t2 and t3), which are FDG-negative. C) Pearson correlation between Me4FDG uptake in lung adenocarcinomas and SGLT2 protein expression as measured by immunohistochemistry. The p-value was calculated from generalized estimating equation (GEE) models (56). D) Pearson correlation between SGLT2 and GLUT1 protein expression in regions of interest corresponding to small areas of the tumor which were clearly identified in the H&E staining as purely low-grade or high-grade, as outlined in fig. S2F. The ROIs encompassing tumor areas with high-grade histology are reported as red circles, and the ROIs corresponding to low-grade tumor areas are represented by green triangles. E) Representative images of SGLT2 and GLUT1 expression in low- and high-grade tumor areas. Scale bars: 100 μm (inserts: 10 μm). F) Hematoxylin and eosin stain in an adjacent section shows the different morphology of the low- and high-grade tumor areas. Scale bars: 100 μm (inserts: 10 μm). G) SGLT2 and GLUT1 protein expression was compared between low- and high-grade tumors using GEE models. ***p < 0.001. H) Representative images of a human adenocarcinoma, adjacent slices of which were stained for SGLT2 (upper panel) or GLUT1 (lower panel). Scale bar: 1 mm. I) Higher magnification of a well-differentiated (blue squares) and a poorly differentiated (red squares) area of the samples presented in H. Scale bar: 100 μm.
Fig. 3.
Fig. 3.. SGLT2 is expressed in early LADC and GLUT1 in advanced LADC in KPluc GEMMs
A) Schematic representation and whole-lung hematoxylin and eosin stain of LADC progression in KPluc mice at different time points after tumor induction, as indicated. Scale bar: 1 mm. B) Time course of SGLT2 and GLUT1 expression in KPluc mouse lung lesions at different time points after tumor induction. Scale bar: 50 μm. C-D) Quantification of the SGLT2 (C) and GLUT1 (D) immunohistochemistry signal at different time points after tumor induction in KPluc mice, measured by Jonchkeere-Terpstra test. *p ≤ 0.05; ***p ≤ 0.01. E) Time course of Me4FDG and FDG imaging in KPluc mice. The first time point was taken when tumor nodules reached an average diameter of 7 mm, and the subsequent time points were performed at 2-week intervals. F-G) Quantification of Me4FDG (F) and FDG (G) signal in all 7 mice included in the cohort (with a total of 16 tumors). H-I) Schematic representation of glucose transporter expression in different stages of LADC: premalignant lesions and early-stage LADC express only SGLT2 (H), whereas advanced tumors show spatial heterogeneity of glucose transport expression, with SGLT2 in well-differentiated and GLUT1 in poorly differentiated areas of the same tumor (I).
Fig. 4.
Fig. 4.. SGLT2 inhibition delays development of lung adenocarcinomas in KPluc GEMMs.
A-B) The effect of single-dose SGLT2 inhibitor dapagliflozin on SGLT activity was evaluated by Me4FDG PET. A) Representative 3D rendering of the PET/CT in the same KPluc mouse imaged on different days with Me4FDG without or with co-injection of dapagliflozin. B) Comparison of Me4FDG uptake in n = 5 mice, expressed in percent of injected dose per gram of tissue (% ID/g) in regions of interest corresponding to single lung nodules (upper panel) and to the bladder (lower panel). Uptake was compared between groups using the two-sample t-test. ****p < 0.0001; **p < 0.01. C) Schematic representation of the therapeutic trials. GEMM: genetically engineered mouse model. AdenoCre: adenovirally encoded Cre recombinase. AAH: atypical adenomatous hyperplasia. ADC: adenocarcinoma. D-J) Therapeutic trial in KPluc mice treated with placebo or canagliflozin starting 2 weeks after tumor induction and carried on for either 6 weeks (Week 8 cohort) or up to 3 months (Survival cohort). D) Representative images of bioluminescence in two mice belonging to the two treatment groups. E) Quantification of the bioluminescent signal in the two therapeutic groups over time. The p-value presented was from the interaction term between time/group from a generalized estimating equation (GEE) model (56). F) Representative hematoxylin and eosin stain of mouse lungs in the two treatment groups from both trials. Scale bar: 5 mm. G) Quantification of the tumor area in the Week 8 and Survival cohorts. Tumor size was compared between placebo and canagliflozin groups using the two-sample t-test. *p < 0.05. H-I) Ki67 staining in premalignant lesions: H) representative images; I) quantification of the signal in the two groups. The groups were compared using t-test. Scale bars: 50 μm. J) Overall survival curves for each group were constructed using the Kaplan-Meier method and formally compared using the log-rank test.
Fig. 5.
Fig. 5.. SGLT2 inhibition of Me4FDG positive LADC slows down tumor growth in patient-derived xenografts (PDXs).
A) The mice carrying PDXs were treated with 30 mg/kg canagliflozin for 1 month. They were imaged with Me4FDG and FDG PET/CT one day before and two weeks after the beginning of treatment; in addition, the mice received weekly CT scans to monitor tumor growth. B) Final tumor volumes on the last day of the trial, as measured by CT; the groups were compared using a linear mixed effects model for log (volume) with adjustment for trial and mouse random effects. C-G) Results of the Me4FDG PET imaging in the mice included in the therapeutic trial. C) Representative PET/CT images in transversal section of two mice, one in the placebo and one in the canagliflozin group, injected with Me4FDG before (day 0) and after (week 2) the beginning of the treatment. The Me4FDG scans presented are from the same two mice. White arrows: tumor. Yellow arrowhead: bladder. D) Quantification of Me4FDG uptake in the tumors, expressed as percentage of injected dose per gram of tissue, in all the mice included in the trial, measured by t-test. ***p < 0.001, **p < 0.01. E) Correlation between pre-treatment Me4FDG uptake in the tumors in the placebo group and the fold increase in volume from the beginning to the end of the therapeutic trial. Pearson’s correlation coefficient (r) and p-value are reported. F) Correlation between pre-treatment Me4FDG uptake in the tumors in the canagliflozin group and the fold increase in volume from the beginning to the end of the therapeutic trial. Pearson’s correlation coefficient (r) and p-value are reported. G) Correlation between the percent change in Me4FDG uptake from the beginning to week 2 of the therapeutic trial and the fold increase in volume from the beginning to the end of the therapeutic trial; Pearson’s correlation coefficient (r) and p-value are reported. H-L) Results of the FDG PET imaging in the mice included in the therapeutic trial. The panels report the data relative to FDG uptake in the same mice presented in C-G. H) Representative PET/CT images in transversal section. White arrows: tumor. I) Quantification of FDG uptake in the tumors (n.s.: not significant). J) Correlation between pre-treatment FDG uptake in the tumors in the placebo group and the fold increase in volume. K) Correlation between pre-treatment FDG in the canagliflozin group and the fold increase in volume. L) Correlation between the percent change in FDG uptake and the fold increase in volume from the beginning to the end of the therapeutic trial.

Similar articles

Cited by

References

    1. Remon J, Besse B, Immune checkpoint inhibitors in first-line therapy of advanced non-small cell lung cancer. Curr Opin Oncol 29, 97–104 (2017). - PubMed
    1. Assi HI, Kamphorst AO, Moukalled NM, Ramalingam SS, Immune checkpoint inhibitors in advanced non-small cell lung cancer. Cancer 124, 248–261 (2018). - PubMed
    1. Weichert W, Warth A, Early lung cancer with lepidic pattern: adenocarcinoma in situ, minimally invasive adenocarcinoma, and lepidic predominant adenocarcinoma. Curr Opin Pulm Med 20, 309–316 (2014). - PubMed
    1. Kadara H, Kabbout M, Wistuba II, Pulmonary adenocarcinoma: a renewed entity in 2011. Respirology 17, 50–65 (2012). - PMC - PubMed
    1. Sivakumar S et al., Genomic Landscape of Atypical Adenomatous Hyperplasia Reveals Divergent Modes to Lung Adenocarcinoma. Cancer Res 77, 6119–6130 (2017). - PMC - PubMed

Publication types

MeSH terms

Substances