. 2018 Nov 15;3(22):e122958.
doi: 10.1172/jci.insight.122958.

NF-κB/MAPK activation underlies ACVR1-mediated inflammation in human heterotopic ossification

Affiliations

NF-κB/MAPK activation underlies ACVR1-mediated inflammation in human heterotopic ossification

Emilie Barruet et al. JCI Insight. .

Abstract

Background: Inflammation helps regulate normal growth and tissue repair. Although bone morphogenetic proteins (BMPs) and inflammation are known contributors to abnormal bone formation, how these pathways interact in ossification remains unclear.

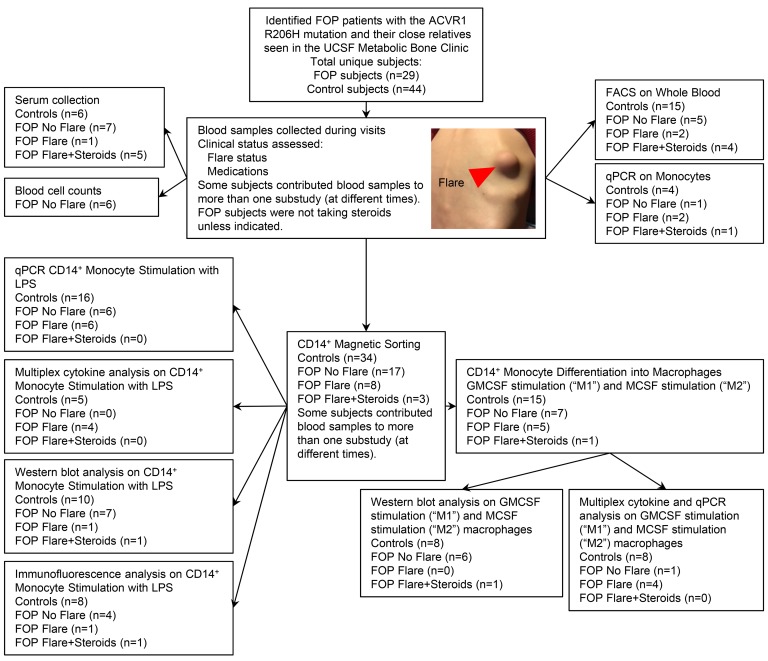
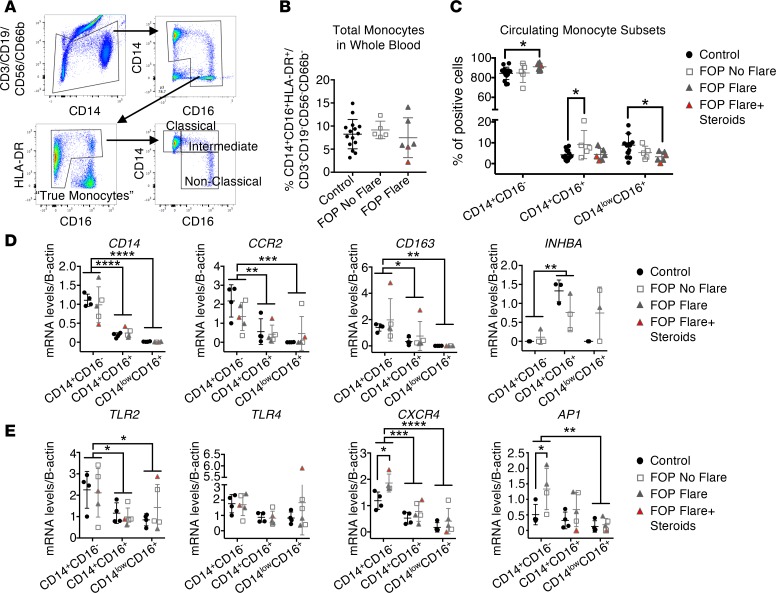
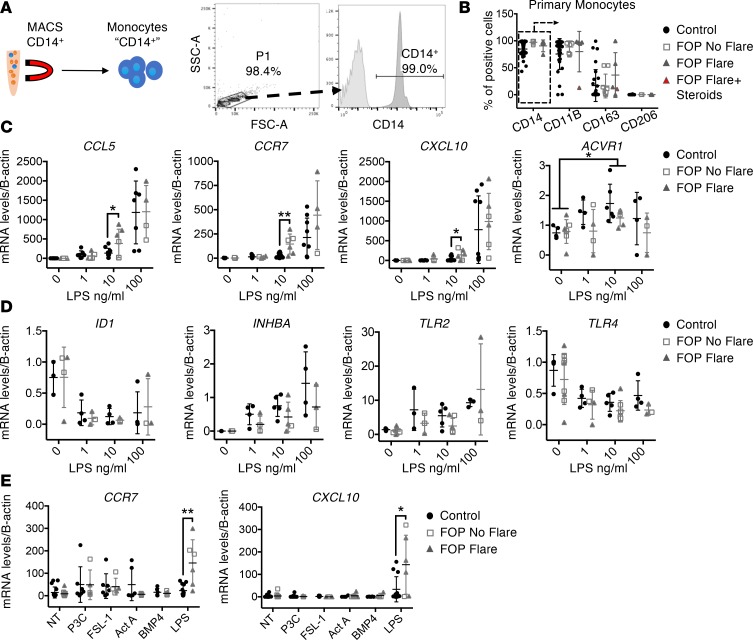
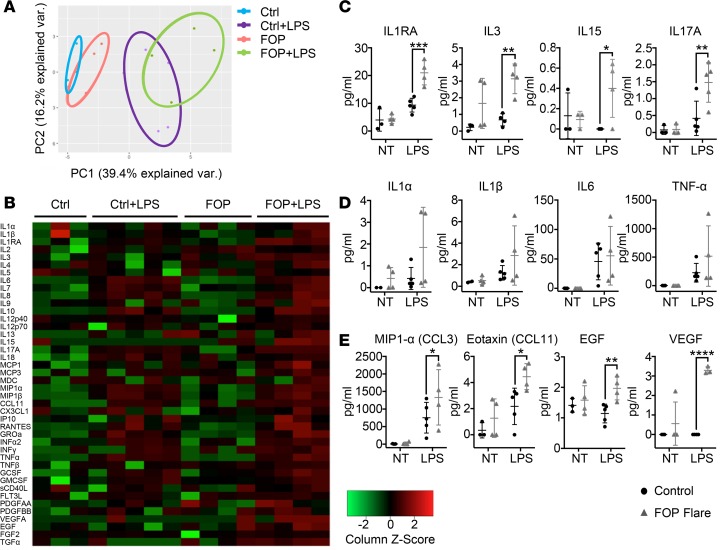
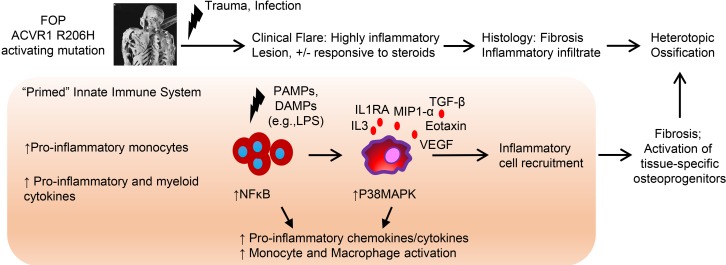
Methods: We examined this potential link in patients with fibrodysplasia ossificans progressiva (FOP), a genetic condition of progressive heterotopic ossification caused by activating mutations in the Activin A type I receptor (ACVR1/ALK2). FOP patients show exquisite sensitivity to trauma, suggesting that BMP pathway activation may alter immune responses. We studied primary blood, monocyte, and macrophage samples from control and FOP subjects using multiplex cytokine, gene expression, and protein analyses; examined CD14+ primary monocyte and macrophage responses to TLR ligands; and assayed BMP, TGF-β activated kinase 1 (TAK1), and NF-κB pathways.

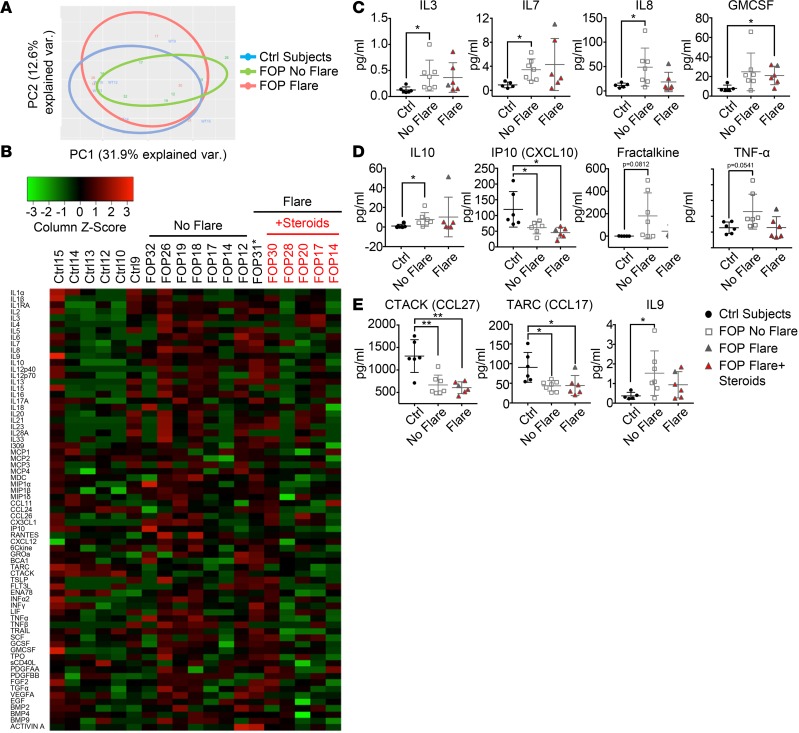
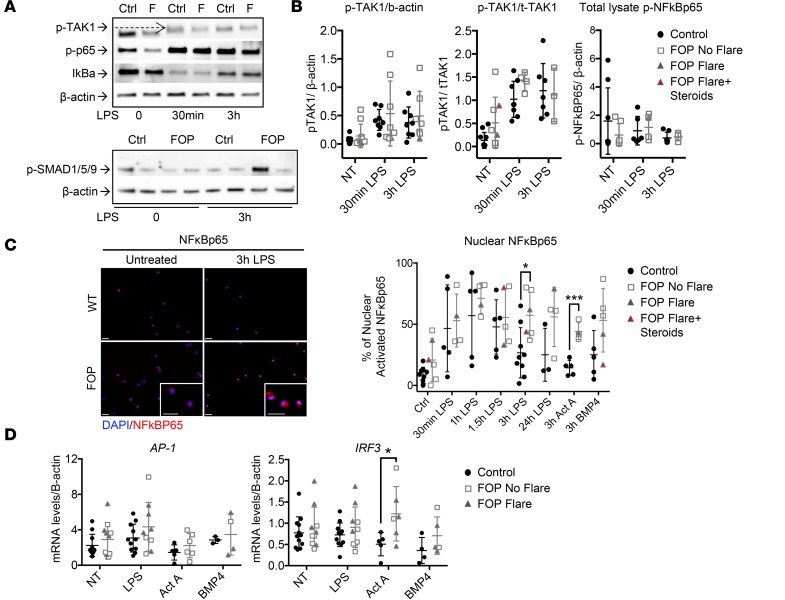
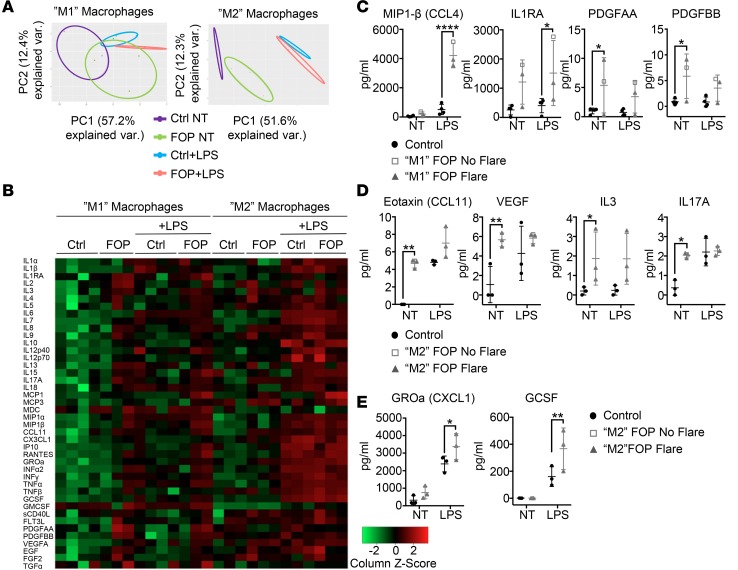
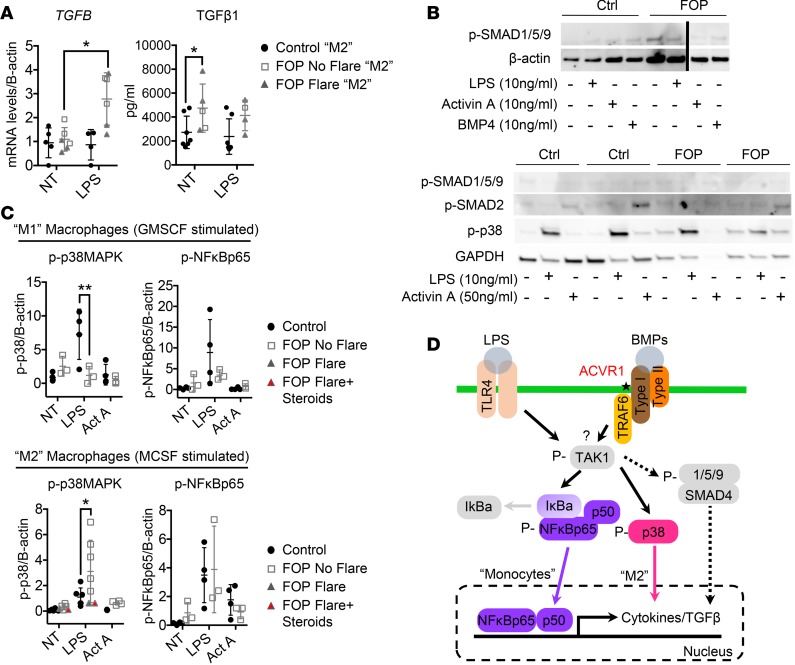
Results: FOP subjects at baseline without clinically evident heterotopic ossification showed increased serum IL-3, IL-7, IL-8, and IL-10. CD14+ primary monocytes treated with the TLR4 activator LPS showed increased CCL5, CCR7, and CXCL10; abnormal cytokine/chemokine secretion; and prolonged activation of the NF-κB pathway. FOP macrophages derived from primary monocytes also showed abnormal cytokine/chemokine secretion, increased TGF-β production, and p38MAPK activation. Surprisingly, SMAD phosphorylation was not significantly changed in the FOP monocytes/macrophages.

Conclusions: Abnormal ACVR1 activity causes a proinflammatory state via increased NF-κB and p38MAPK activity. Similar changes may contribute to other types of heterotopic ossification, such as in scleroderma and dermatomyositis; after trauma; or with recombinant BMP-induced bone fusion. Our findings suggest that chronic antiinflammatory treatment may be useful for heterotopic ossification.

Keywords: Bone Biology; Bone disease; Cellular immune response; Genetic diseases; Inflammation.


Conflict of interest statement

Conflict of interest: ECH, TVC, and KLW receive clinical trial research funding support from Clementia Pharmaceuticals. ECH received clinical trial research funding support from Regeneron Pharmaceuticals and serves in an unpaid capacity on the International FOP Association Medical Registry Advisory Board, on the International Clinical Council on FOP, and on the Fibrous Dysplasia Foundation Medical Advisory Board.

Figures

Figure 1
Figure 1. Patient samples flow diagram.
Picture represents a flare from a FOP patient. Red arrow indicates the flare site over the right scapula. FOP subjects with no clinically evident flare were termed FOP No Flare. FOP subjects with a documented clinically ongoing flare and who were receiving standard-of-care glucocorticoid treatment for their flare at the time of the blood draw were termed FOP Flare+Steroids. Flaring FOP subjects who were not yet receiving steroids were termed FOP Flare. Control family subjects (either siblings or parents) were termed Control Subjects.
Figure 2
Figure 2. Sera of FOP patients show elevated proinflammatory cytokines.
Multiplex assays for 69 cytokines on serum of control (n = 6), FOP subjects with clinical documented flare (n = 6), and FOP subjects without a flare (n = 7). (A) Principle component analysis of the 69 cytokines. (B) Heatmap representing color-coded cytokines/chemokines detected in the serum of control and FOP subjects, showing that FOP patients without a flare tend to show increased cytokine levels. Asterisk indicates that FOP31 was not taking steroids at the time of collection. (C and D) Myeloid and proinflammatory cytokine were significantly increased in FOP subjects with no flare. (E) Lymphoid cytokines CTACK (cutaneous T cell–attracting chemokine) and TARC (thymus and activation–regulated chemokine) were significantly lower in all FOP subjects. IL-9, which can be secreted by lymphocytes and mast cells, was elevated in FOP subjects with no flare. The distribution of the subjects is described in Supplemental Table 1. Error bars represent mean ± 1 SD. *P < 0.05, **P < 0.01, by Student’s t test.
Figure 3
Figure 3. Increased proinflammatory monocyte subsets in FOP subjects with no clinically ongoing flare.
Whole blood samples from control and FOP subjects were collected, analyzed, and sorted via flow cytometry. (A) The gating strategy for identification of monocytes. (B) Total monocytes in the whole blood were not different between control and FOP subjects. (C) The intermediate monocytes (CD14+/CD16+) were significantly increased in FOP subjects with no flare. The nonclassical monocytes (CD14+/CD16+) were significantly decreased in all FOP subjects. Supplemental Table 3 shows the distribution of the subjects (Control, n = 15; No Flare, n = 5; Flare, n = 6). *P < 0.05, by Student’s t test. (D) Monocyte subtypes were sorted, and RNA was extracted. Gene expression analysis of monocyte receptors. CD14, CCR2, and CD163 were decreased in the CD14+CD16+ and CD14loCD16+ population in both control and FOP monocytes. INHBA (a subunit of Activin A) was significantly increased in the CD14+CD16+ monocytes of both control and FOP. (E) TLR2 and TLR4 were not increased in FOP monocytes, while CXCR4, a potential marker of premature monocytes, and AP1 were significantly increased in FOP CD14+CD16 monocytes compared with control. Supplemental Table 4 shows the distribution of the subjects (Control, n = 4; FOP, n ≥ 3). *P < 0.05, **P < 0.01, by 2-way ANOVA Sidak or Tukey’s multiple comparison test. Error bars represent mean ± 1 SD.
Figure 4
Figure 4. Increased response to LPS by primary FOP monocytes.
(A) Primary monocyte FOP subjects were purified via MACS for CD14. (B) CD14+ cells (in rectangle) from control or FOP subjects showed no significant differences in CD11B, CD163, or CD206 expression. (C) FOP CD14+ monocytes showed a significant increase in gene expression of CCL5, CCR7, and CXCL10 at lower LPS concentration. (D) SMAD1/5-driven expression of ID1 (inhibitor of DNA binding 1) was not increased in FOP monocytes. INHBA was substantially increased in all monocytes when stimulated with increasing amounts of LPS. The increased LPS response was not due to an increase in TLR receptor expression. (E) Control and FOP monocytes were stimulated with TLR2 ligands, BMP4, or Activin A. Control and LPS samples from C were presented again in E for comparison with other ligands. The distribution of the subjects is described in Supplemental Table 5 (control, n ≥ 3; FOP, n ≥ 3). *P < 0.05, **P < 0.01, by multiple comparison Student’s t test. Error bars represent mean ± SD.
Figure 5
Figure 5. LPS-stimulated FOP monocytes show abnormal proinflammatory cytokine secretion.
Supernatants were collected from monocytes of control (n ≥ 3) and FOP (n = 4) subjects. Monocytes untreated (NT) and LPS-stimulated (10 ng/ml) for 24 hours were assayed for 41 cytokines. (A) Shapes represent expression profiles of the different donors in principle component analysis (PCA). (B) Heatmap representing color-coded cytokine secretion by Control, Control+LPS, FOP, FOP+LPS samples. (C) Proinflammatory cytokines IL-1RA, IL-3, IL-15, and IL-17A were significantly increased in FOP LPS-stimulated monocytes. (D) Typical proinflammatory cytokines IL-1α/β, IL-6, and TNF-α production were increased upon LPS stimulation but not significantly different among control and FOP subjects. (E) Chemokine ligands CCL3 and CCL11 and growth factors EGF and VEGF were significantly increased in FOP monocytes stimulated with LPS. The distribution of the subjects is described in Supplemental Table 6. *P < 0.05, **P < 0.01, ***P < 0.001 by Sidak’s multiple comparison test. Error bars represent means ± 1 SD.
Figure 6
Figure 6. Increased NF-κB activity in FOP monocytes.
(A) Representative Western blots (repeated for at least 3 different biological samples) showing activation of TGF-β activated kinase 1 (TAK1) and NF-κBp65 phosphorylation, as well as IkBa degradation (top) in control and FOP monocytes. The SMAD1/5/9 pathway is not activated in FOP monocytes (bottom). (B) TAK1 phosphorylation is increased upon LPS stimulation (10 ng/ml) in both control (n ≥ 5) and FOP (n ≥ 4) monocytes. There were no significant differences in total lysate NF-κBp65 phosphorylation upon LPS stimulation. (C) Time course of LPS-induced NF-κBp65 nuclear translocation in cells stimulated with LPS (10 ng/ml), BMP4 (50 ng/ml), or Activin A (50 ng/ml). Immunofluorescence staining of NF-κBp65 and quantification of nuclear staining (NF-κBp65:Dapi) shows a significant increase of NF-κBp65 nuclear translocation in FOP monocytes when stimulated with LPS and Activin A for 3 hours (control, n ≥ 3; FOP, n ≥ 4). Scale bars: 50μm. *P < 0.05 and ***P < 0.005 by multiple comparison Student’s t test. Error bars represent means ± 1 SD. At least 100 nuclei were evaluated per condition. (D) mRNA levels of IRF3 were increased with Activin A stimulation in FOP monocyte (control, n ≥ 3; FOP, n ≥ 3). *P < 0.05, by multiple comparison Student’s t test. Error bars represent mean ± 1 SD. The distribution of the subjects is described in Supplemental Tables 7 and 8.
Figure 7
Figure 7. LPS-stimulated FOP macrophages show abnormal proinflammatory cytokine secretion.
Primary CD14+ monocytes were differentiated into proinflammatory (stimulated with GMCSF, M1) or antiinflammatory (stimulated with MCSF, M2) macrophages. Multiplex assay for 41 cytokines on M1 (control, n = 4; FOP, n = 3) and M2 (control, n = 3; FOP, n = 3) macrophages were either untreated (NT) or treated with 10 ng/ml of LPS for 24 hours. (A) Principle component analysis. Shapes represent expression profiles of the different groups. (B) Heatmap representing color-coded cytokine secretion by Control, Control+LPS, FOP, FOP+LPS for M1 and M2 macrophage samples. (C) Cytokines MIP1-β and IL-1RA were significantly increased in FOP M1 polarized macrophages stimulated with LPS. PDGFAA and PDGFBB were significantly increased in nonstimulated FOP M1 polarized macrophages. (D) Chemokine ligands eotaxin, VEGF, IL-3, and IL-17A were increased at baseline in FOP subject M2 macrophages. (E) GROα and GCSF were significantly increased in FOP monocytes stimulated with LPS. The distribution of the subjects is described in Supplemental Table 9. *P < 0.05, **P < 0.01, and ****P < 0.0001 by Sidak’s multiple comparison test. Error bars represent means ± 1 SD.
Figure 8
Figure 8. p38MAPK pathway is dysregulated antiinflammatory macrophages.
(A) Control (n ≥ 4) and FOP (n = 6) macrophages were stimulated with LPS. TGFB gene expression was significantly increased in LPS-stimulated FOP M2 macrophages. TGF-β1 ELISA on cell supernatant revealed a significant increase in FOP M2 macrophages. (B) Representative Western blots (conducted on 2 different biological samples for control and FOP) showing SMAD1/5/9 pathway is not activated in FOP macrophages upon LPS, Activin A, or BMP stimulation (top). SMAD2 phosphorylation is not upregulated in FOP macrophages upon Activin A stimulation (bottom). (C) Quantification of p38 and NF-κBp65 phosphorylation of control (n ≥ 4) and FOP (n ≥ 3) M-CSF polarized macrophages when stimulated with LPS or Activin A for 2 hours. *P < 0.05 by 2-way Anova Sidak’s multiple comparison test. Error bars represent mean ± 1 SD. The distribution of the subjects is described in Supplemental Tables 10 and 11. (D) Summary of the possible activated pathways responsible for the FOP monocyte/macrophage increased inflammatory responses.
Figure 9
Figure 9. Summary of the innate immune system dysfunction in FOP and other forms of heterotopic ossification.
FOP patients showed increases of several proinflammatory and myeloid cytokines in their serum and increased proinflammatory monocytes, suggesting a proinflammatory state at baseline. We found that FOP CD14+ monocytes and M1/M2 macrophages are hyperresponsive to TLR4 ligand LPS, which may increase and propagate the inflammatory response leading to the recruitment of other inflammatory cells and tissue-specific osteoprogenitors, which are critical steps in heterotopic bone formation.

References

    1. Eming SA, Wynn TA, Martin P. Inflammation and metabolism in tissue repair and regeneration. Science. 2017;356(6342):1026–1030. doi: 10.1126/science.aam7928. - DOI - PubMed
    1. Frangogiannis NG. The Inflammatory Response in Tissue Repair. In: Cavaillon JM, Singer M, eds. Inflammation: From Molecular and Cellular Mechanisms to the Clinic. Hoboken, NJ: Wiley; 2017:1517–1537.
    1. Mountziaris PM, Mikos AG. Modulation of the inflammatory response for enhanced bone tissue regeneration. Tissue Eng Part B Rev. 2008;14(2):179–186. doi: 10.1089/ten.teb.2008.0038. - DOI - PMC - PubMed
    1. Charles JF, Nakamura MC. Bone and the innate immune system. Curr Osteoporos Rep. 2014;12(1):1–8. doi: 10.1007/s11914-014-0195-2. - DOI - PMC - PubMed
    1. Claes L, Recknagel S, Ignatius A. Fracture healing under healthy and inflammatory conditions. Nat Rev Rheumatol. 2012;8(3):133–143. doi: 10.1038/nrrheum.2012.1. - DOI - PubMed

Publication types

MeSH terms