. 2018 Nov 15;3(22):e121689.
doi: 10.1172/jci.insight.121689.

The mitochondrial calcium uniporter underlies metabolic fuel preference in skeletal muscle

Affiliations

The mitochondrial calcium uniporter underlies metabolic fuel preference in skeletal muscle

Jennifer Q Kwong et al. JCI Insight. .

Abstract

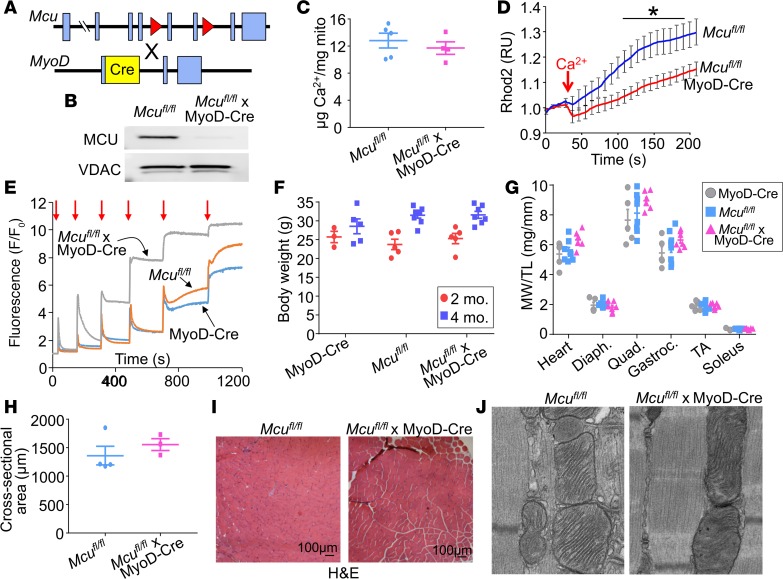
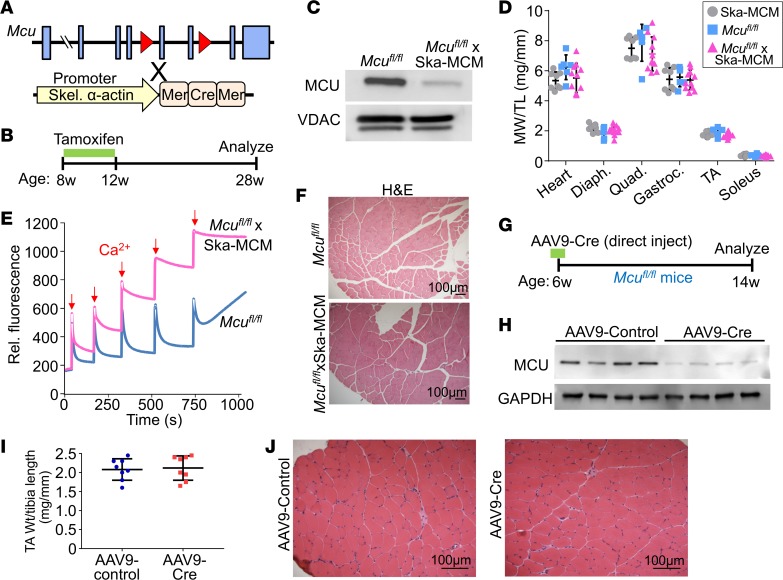
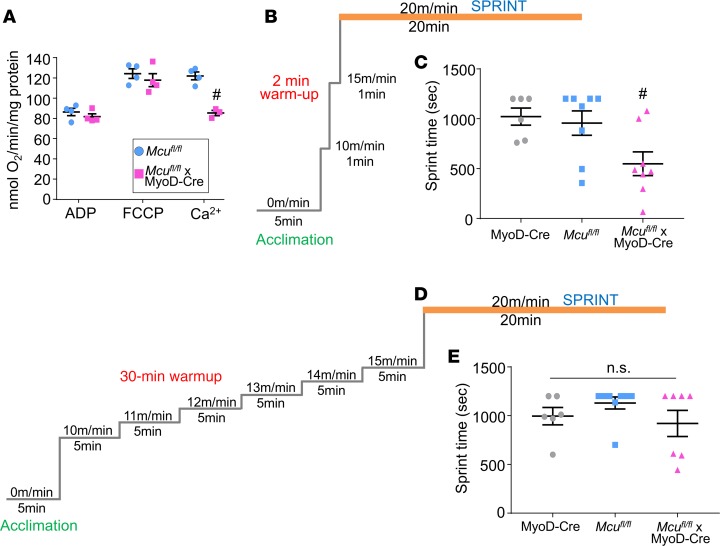
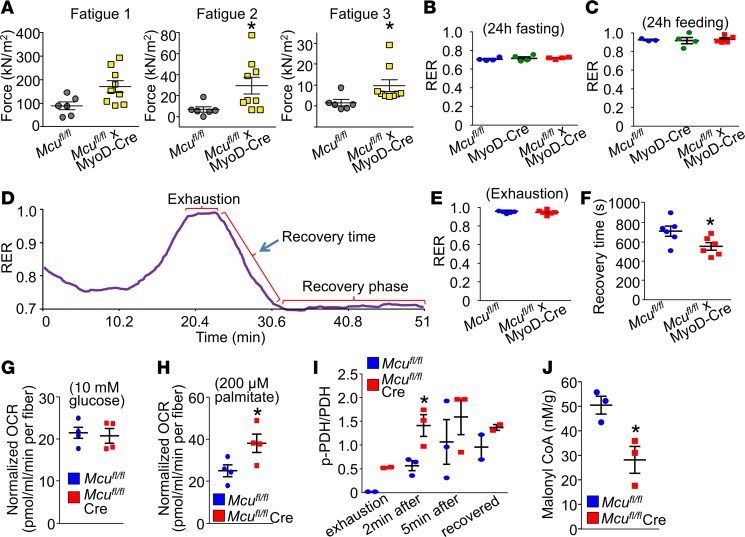
The mitochondrial Ca2+ uniporter (MCU) complex mediates acute mitochondrial Ca2+ influx. In skeletal muscle, MCU links Ca2+ signaling to energy production by directly enhancing the activity of key metabolic enzymes in the mitochondria. Here, we examined the role of MCU in skeletal muscle development and metabolic function by generating mouse models for the targeted deletion of Mcu in embryonic, postnatal, and adult skeletal muscle. Loss of Mcu did not affect muscle growth and maturation or otherwise cause pathology. Skeletal muscle-specific deletion of Mcu in mice also did not affect myofiber intracellular Ca2+ handling, but it did inhibit acute mitochondrial Ca2+ influx and mitochondrial respiration stimulated by Ca2+, resulting in reduced acute exercise performance in mice. However, loss of Mcu also resulted in enhanced muscle performance under conditions of fatigue, with a preferential shift toward fatty acid metabolism, resulting in reduced body fat with aging. Together, these results demonstrate that MCU-mediated mitochondrial Ca2+ regulation underlies skeletal muscle fuel selection at baseline and under enhanced physiological demands, which affects total homeostatic metabolism.

Keywords: Calcium; Cardiology; Mitochondria; Muscle Biology.


Conflict of interest statement

Conflict of interest: The authors have declared that no conflict of interest exists.

Figures

Figure 1
Figure 1. Loss of Mcu during skeletal muscle embryonic development does not cause growth impairment.
(A) Strategy to generate the Mcufl/fl-MyoD-Cre mice. (B) Western blot analysis of MCU expression from muscle mitochondria isolated from 2-month-old animals. The voltage-dependent anion channel (VDAC) was used as the protein loading control. (C) Quantification of total Ca2+ content in isolated muscle mitochondria (mito) from the indicated groups; n = 5 (Mcufl/fl), n = 4 (Mcufl/fl-MyoD-Cre). Student’s t-test was used to analyze groups for statistical significance. (D) Stimulated Ca2+ uptake in saponin permeabilized FDB myofibers challenged with a 20 μM Ca2+ bolus (arrow); average axial mitochondrial Rhod-2 fluorescence (relative units, RU) was tracked from the given genotypes. Mcufl/fl-MyoD-Cre, n = 24 cells from 4 isolations/mice; Mcufl/fl n = 24 cells from 4 isolations/mice. Data are plotted as mean ± SEM. *P ≤ 0.05 by 2-way ANOVA with Bonferroni’s post hoc test. Average peak data are shown in Supplemental Figure 1B. (E) Mitochondrial Ca2+ uptake from isolated muscle mitochondria of the genotypes shown measured using the Calcium Green-5N uptake assay. Calcium Green-5N signal was a ratio to baseline fluorescence values (F/F0). Mitochondria were challenged with 10 μM CaCl2 (red arrows). (F) Body weights of mice (g) from the indicated groups at 2 and 4 months of age. For animals at 2 months of age, n = 3 (MyoD-Cre), n = 5 (Mcufl/fl), and n = 5 (Mcufl/fl-MyoD-Cre). For animals at 4 months of age, n = 3 (MyoD-Cre), n = 5 (Mcufl/fl), and n = 8 (Mcufl/fl-MyoD-Cre). One-way ANOVA with Dunnett’s multiple comparisons test was used for statistical analysis. (G) Muscle weight normalized to tibia length (MW/TL) at 4 months of age. Muscles analyzed are shown, and heart weight was normalized to tibia length; n = 5 (MyoD-Cre), n = 8 (Mcufl/fl), and n = 8 (Mcufl/fl-MyoD-Cre). One-way ANOVA with Dunnett’s test was used for statistical analysis. (H) Quantification of myofiber cross-sectional area from 4-month-old animals from the indicated genotypes; n = 3 per group; Student’s 2-tailed t-test was used to analyze groups. (I) Transverse H&E-stained quadriceps histological sections from 4-month-old mice. (J) Representative electron micrographs of quadriceps sections at ×4,000 magnification. Scatter plots show individual values and mean ± SEM.
Figure 2
Figure 2. Mitochondrial Ca2+ influx does not regulate postnatal skeletal muscle growth.
(A) Strategy for the generation of the Mcufl/fl-Ska-MCM mice. Skel, skeletal muscle. (B) Tamoxifen dosing regimen to induce Mcu deletion. Mice were fed tamoxifen chow for 4 weeks (400 mg/kg) and examined at 28 weeks of age. (C) Western blot analysis of MCU expression from isolated muscle mitochondria prepared at 28 weeks of age from the indicated groups. The VDAC was used as the protein loading control. (D) MW/TL from the indicated groups. Muscles analyzed are shown, and heart weight is also normalized to tibia length. n = 8 (Ska-MCM), n = 5 (Mcufl/fl), and n = 11 (Mcufl/fl-Ska-MCM). One-way ANOVA with Dunnett’s multiple comparisons test was used for statistical analysis. (E) Calcium Green-5N assay for mitochondrial Ca2+ uptake in isolated muscle mitochondria. Mitochondria were challenged with 10 μM CaCl2 pulses (red arrows). Rel, relative. (F) Representative transverse H&E-stained TA histological muscle sections at ×100 magnification. (G) Schematic for experiments using direct AAV9 TA muscle injections. Mcufl/fl animals were injected with virus at 6 weeks of age and analyzed at 14 weeks of age. (H) Western blot analysis of MCU expression from total TA protein lysates of AAV9-Cre– or AAV9-GFP–transduced Mcufl/fl animals. GAPDH was used as a protein loading control. (I) TA MW/TL from the indicated AAV9 experimental groups; n = 8 per group. Student’s 2-tailed t-test was used to analyze groups for statistical significance. (J) Representative H&E-stained TA muscle sections 8 weeks after AAV9 viral transduction. Scatter plots show individual values and mean ± SEM.
Figure 3
Figure 3. Uniporter-dependent mitochondrial Ca2+ signaling controls rapid upregulation of mitochondrial energy production.
(A) State 3 mitochondrial oxygen consumption rate of isolated muscle mitochondria with ADP from the indicated groups of mice at baseline, after stimulation with 5 μM FCCP, or after stimulation with 100 μM CaCl2. n = 4 per group. Student’s 2-tailed t-test was used to analyze groups for statistical significance. #P < 0.05 versus Mcufl/fl control. (B) Treadmill regimen for acute sprinting of mice. (C) Quantification of sprint capacity in the indicated groups of mice following the acute running protocol depicted in (B). n = 6 (MyoD-Cre), n = 8 (Mcufl/fl), and n = 8 (Mcufl/fl-MyoD-Cre). One-way ANOVA with Dunnett’s multiple comparisons test was used for statistical analysis. #P < 0.05 versus Mcufl/fl control. (D) The treadmill regimen for the prolonged acclimatization protocol and (E) quantification in the indicated groups following this regimen. n = 6 (MyoD-Cre), n = 8 (Mcufl/fl), and n = 7 (Mcufl/fl-MyoD-Cre). One-way ANOVA with Dunnett’s multiple comparisons test was used for statistical analysis. Scatter plots show individual values and mean ± SEM.
Figure 4
Figure 4. Mcu deletion in skeletal muscle causes a metabolic shift toward fatty acid oxidation.
(A) Quantification of TA muscle–specific force following multiple rounds of fatigue in the indicated genotypes of mice. n = 6 (Mcufl/fl), n = 9 (Mcufl/fl-MyoD-Cre). Student’s 2-tailed t-test was used to analyze groups for statistical significance. *P < 0.05 versus Mcufl/fl control. kN, kilonewton. (B) Average RER values from 2-month-old mice of the indicated genotypes following 24 hours of fasting or (C) 24 hours of feeding. n = 4 per group. (D) Representative graph tracing of RER measurements taken throughout the rest-exhaustion-recovery experiment for mice subjected to treadmill running in metabolic cages. Exhaustion, recovery time, and recovery phases are indicated. (E) Quantification of average RER values at exhaustion and (F) during recovery time in the indicated groups. n = 8 per group. (G) O2 consumption rate (OCR) of isolated FDB myofibers when glucose was given as a metabolic substrate or (H) palmitate was given at the shown concentrations. The myofibers were isolated from n = 4 (Mcufl/fl), n = 4 (Mcufl/fl-MyoD-Cre) mice. (I) Western blot analysis-based quantification of phosphorylated PDHE1α (p-PDHE1α) and total PDH in gastrocnemius muscle harvested at exhaustion (n = 2 per group), 2 minutes after exhaustion (n = 3 per group), 5 minutes after exhaustion (n = 3 per group), and during recovery (n = 2 per group). (J) Malonyl-CoA levels measured by ELISA from quadriceps taken from mice 2 minutes after exhaustion. n = 3 per group. Student’s 2-tailed t-test was used for statistical analysis. Scatter plots show individual values and mean ± SEM. *P < 0.05 versus Mcufl/fl control.

Similar articles

Cited by

References

    1. Boncompagni S, et al. Mitochondria are linked to calcium stores in striated muscle by developmentally regulated tethering structures. Mol Biol Cell. 2009;20(3):1058–1067. doi: 10.1091/mbc.e08-07-0783. - DOI - PMC - PubMed
    1. Denton RM. Regulation of mitochondrial dehydrogenases by calcium ions. Biochim Biophys Acta. 2009;1787(11):1309–1316. - PubMed
    1. Jouaville LS, Pinton P, Bastianutto C, Rutter GA, Rizzuto R. Regulation of mitochondrial ATP synthesis by calcium: evidence for a long-term metabolic priming. Proc Natl Acad Sci U S A. 1999;96(24):13807–13812. doi: 10.1073/pnas.96.24.13807. - DOI - PMC - PubMed
    1. Baughman JM, et al. Integrative genomics identifies MCU as an essential component of the mitochondrial calcium uniporter. Nature. 2011;476(7360):341–345. doi: 10.1038/nature10234. - DOI - PMC - PubMed
    1. De Stefani D, Raffaello A, Teardo E, Szabò I, Rizzuto R. A forty-kilodalton protein of the inner membrane is the mitochondrial calcium uniporter. Nature. 2011;476(7360):336–340. doi: 10.1038/nature10230. - DOI - PMC - PubMed

Publication types