

Epstein-Barr virus-specific T cell therapy for progressive multiple sclerosis
- PMID: 30429369
- PMCID: PMC6302936
- DOI: 10.1172/jci.insight.124714
Epstein-Barr virus-specific T cell therapy for progressive multiple sclerosis
Erratum in
-
Epstein-Barr virus-specific T cell therapy for progressive multiple sclerosis.JCI Insight. 2020 Oct 15;5(20):e144624. doi: 10.1172/jci.insight.144624. JCI Insight. 2020. PMID: 33055421 Free PMC article. No abstract available.
Abstract
Background: Increasing evidence indicates a role for EBV in the pathogenesis of multiple sclerosis (MS). EBV-infected autoreactive B cells might accumulate in the CNS because of defective cytotoxic CD8+ T cell immunity. We sought to determine the feasibility and safety of treating progressive MS patients with autologous EBV-specific T cell therapy.
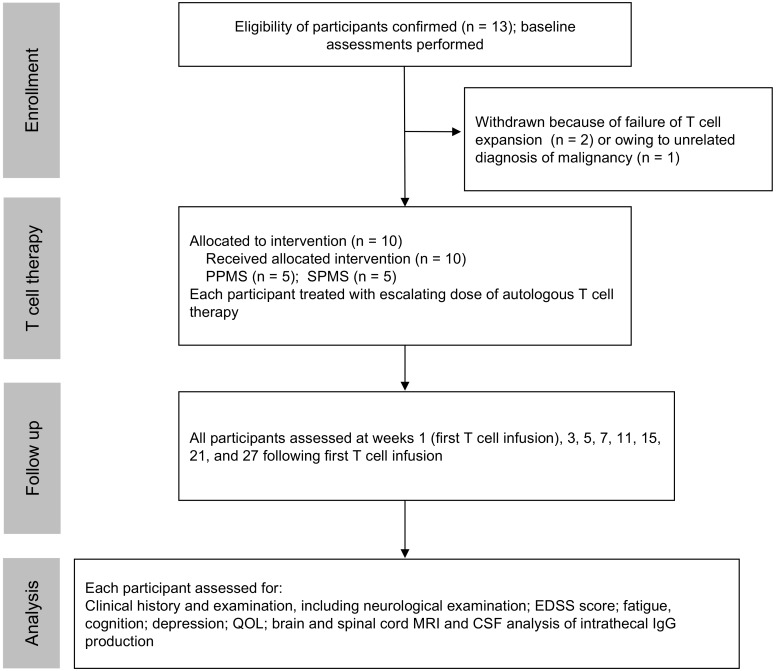
Methods: An open-label phase I trial was designed to treat 5 patients with secondary progressive MS and 5 patients with primary progressive MS with 4 escalating doses of in vitro-expanded autologous EBV-specific T cells targeting EBV nuclear antigen 1, latent membrane protein 1 (LMP1), and LMP2A. Following adoptive immunotherapy, we monitored the patients for safety and clinical responses.
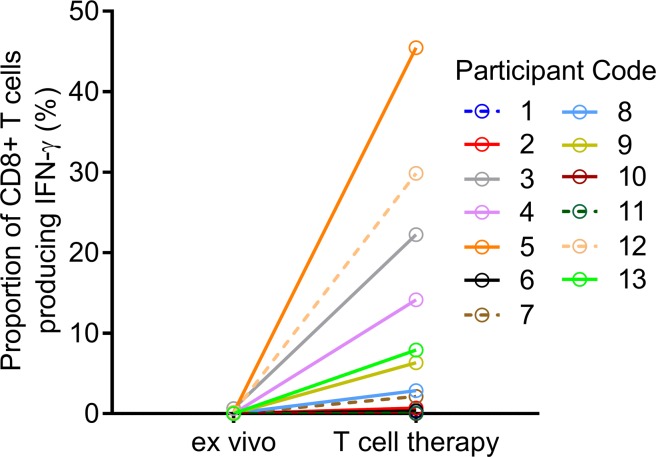
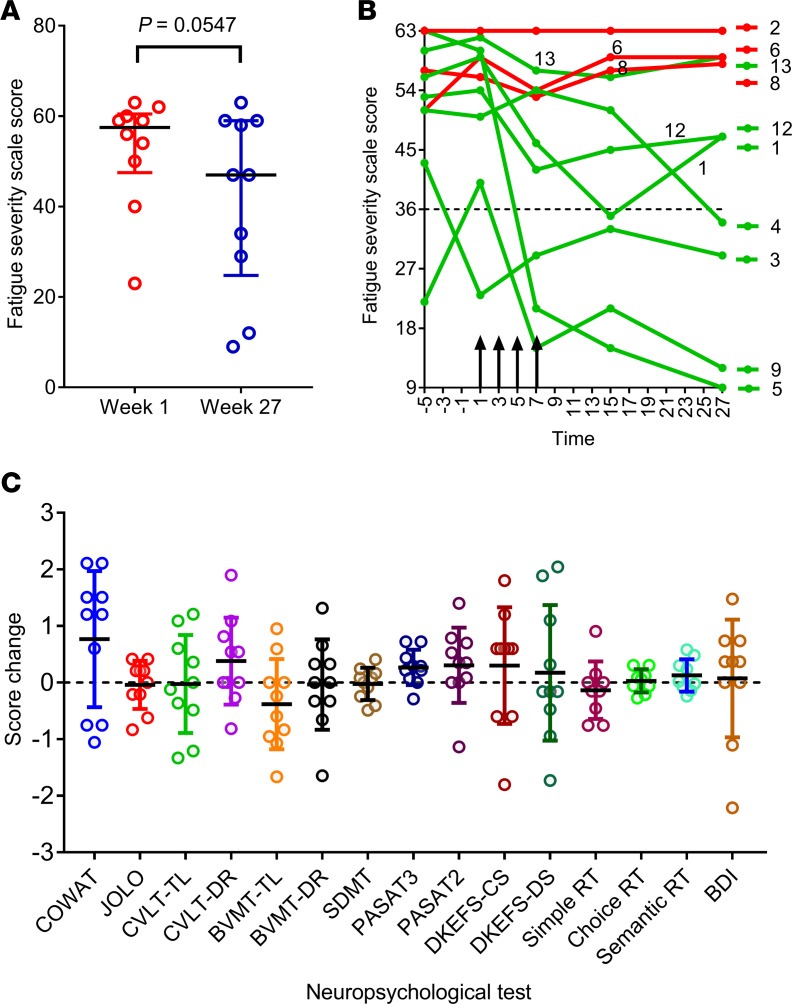
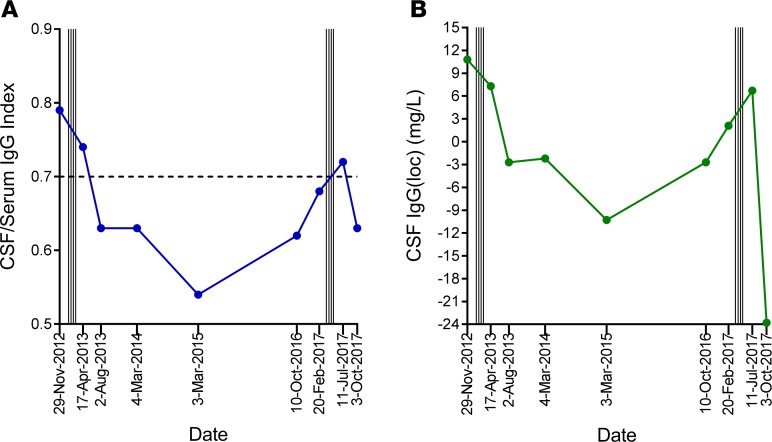
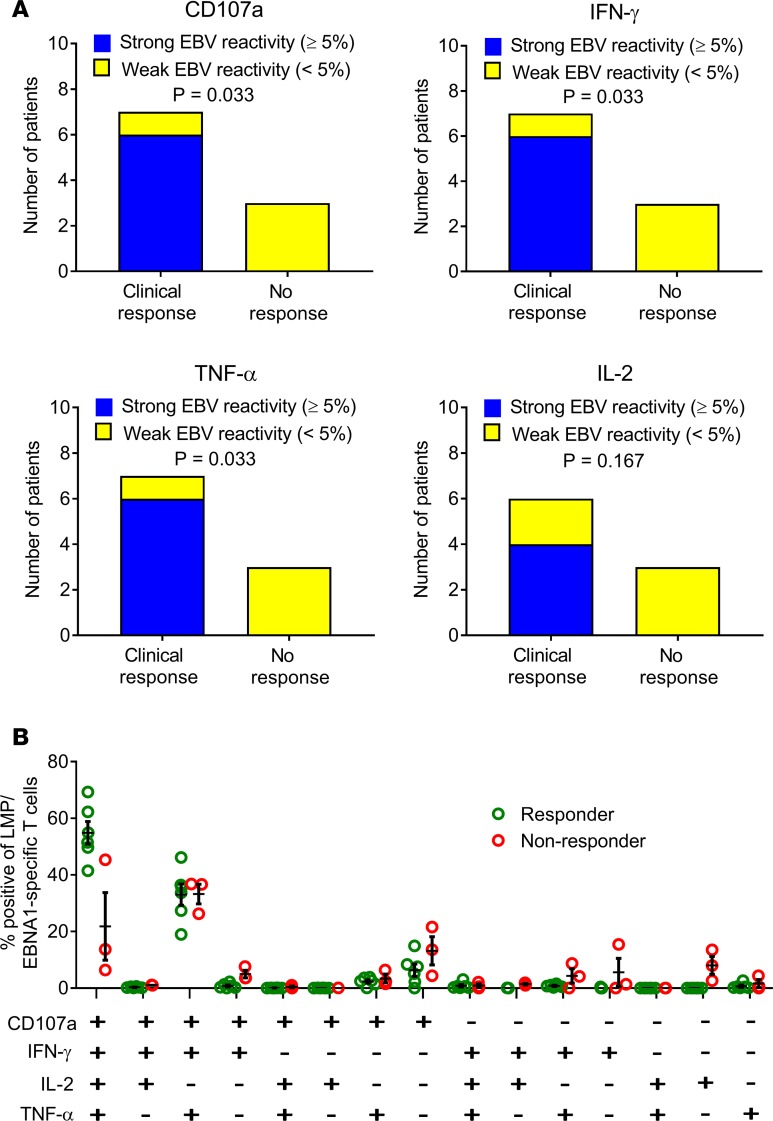
Results: Of the 13 recruited participants, 10 received the full course of T cell therapy. There were no serious adverse events. Seven patients showed improvement, with 6 experiencing both symptomatic and objective neurological improvement, together with a reduction in fatigue, improved quality of life, and, in 3 patients, reduced intrathecal IgG production. All 6 patients receiving T cells with strong EBV reactivity showed clinical improvement, whereas only 1 of the 4 patients receiving T cells with weak EBV reactivity showed improvement (P = 0.033, Fisher's exact test).
Conclusion: EBV-specific adoptive T cell therapy was well tolerated. Clinical improvement following treatment was associated with the potency of EBV-specific reactivity of the administered T cells. Further clinical trials are warranted to determine the efficacy of EBV-specific T cell therapy in MS.
Trial registration: Australian New Zealand Clinical Trials Registry, ACTRN12615000422527.
Funding: MS Queensland, MS Research Australia, Perpetual Trustee Company Ltd., and donations from private individuals who wish to remain anonymous.
Keywords: Autoimmune diseases; Clinical Trials; Neuroscience; T cells.
Conflict of interest statement
Figures
Similar articles
-
Epstein-Barr virus-specific adoptive immunotherapy for progressive multiple sclerosis.Mult Scler. 2014 Oct;20(11):1541-4. doi: 10.1177/1352458514521888. Epub 2014 Feb 3. Mult Scler. 2014. PMID: 24493474 Free PMC article.
-
Strong EBV-specific CD8+ T-cell response in patients with early multiple sclerosis.Brain. 2008 Jul;131(Pt 7):1712-21. doi: 10.1093/brain/awn108. Epub 2008 Jun 11. Brain. 2008. PMID: 18550621
-
Cumulative Roles for Epstein-Barr Virus, Human Endogenous Retroviruses, and Human Herpes Virus-6 in Driving an Inflammatory Cascade Underlying MS Pathogenesis.Front Immunol. 2021 Nov 1;12:757302. doi: 10.3389/fimmu.2021.757302. eCollection 2021. Front Immunol. 2021. PMID: 34790199 Free PMC article.
-
EBV-specific T-cell immunity: relevance for multiple sclerosis.Front Immunol. 2024 Dec 24;15:1509927. doi: 10.3389/fimmu.2024.1509927. eCollection 2024. Front Immunol. 2024. PMID: 39776919 Free PMC article. Review.
-
Epstein-Barr virus and multiple sclerosis: potential opportunities for immunotherapy.Clin Transl Immunology. 2014 Oct 31;3(10):e27. doi: 10.1038/cti.2014.25. eCollection 2014 Oct. Clin Transl Immunology. 2014. PMID: 25505955 Free PMC article. Review.
Cited by
-
Adoptive T-cell therapy targeting Epstein-Barr virus as a treatment for multiple sclerosis.Clin Transl Immunology. 2023 Mar 21;12(3):e1444. doi: 10.1002/cti2.1444. eCollection 2023. Clin Transl Immunology. 2023. PMID: 36960148 Free PMC article. Review.
-
Epstein-Barr Virus and Multiple Sclerosis.Front Immunol. 2020 Dec 17;11:587078. doi: 10.3389/fimmu.2020.587078. eCollection 2020. Front Immunol. 2020. PMID: 33391262 Free PMC article. Review.
-
Autologous Epstein-Barr virus-specific adoptive T-cell therapy in a patient with lupus nephritis.Clin Transl Immunology. 2024 Nov 19;13(11):e70015. doi: 10.1002/cti2.70015. eCollection 2024. Clin Transl Immunology. 2024. PMID: 39564002 Free PMC article.
-
TianTan vaccinia virus-based EBV vaccines targeting both latent and lytic antigens elicits potent immunity against lethal EBV challenge in humanized mice.Emerg Microbes Infect. 2024 Dec;13(1):2412640. doi: 10.1080/22221751.2024.2412640. Epub 2024 Oct 13. Emerg Microbes Infect. 2024. PMID: 39387189 Free PMC article.
-
Epstein-Barr Virus in Multiple Sclerosis: Theory and Emerging Immunotherapies.Trends Mol Med. 2020 Mar;26(3):296-310. doi: 10.1016/j.molmed.2019.11.003. Epub 2019 Dec 17. Trends Mol Med. 2020. PMID: 31862243 Free PMC article. Review.
References
Publication types
MeSH terms
Substances
Associated data
LinkOut - more resources
Full Text Sources
Other Literature Sources
Medical
Research Materials
