. 2018 Nov 15;3(22):e123538.
doi: 10.1172/jci.insight.123538.

AAV-mediated follistatin gene therapy improves functional outcomes in the TIC-DUX4 mouse model of FSHD

Affiliations

AAV-mediated follistatin gene therapy improves functional outcomes in the TIC-DUX4 mouse model of FSHD

Carlee R Giesige et al. JCI Insight. .

Abstract

Facioscapulohumeral muscular dystrophy (FSHD) is an autosomal dominant or digenic disorder linked to derepression of the toxic DUX4 gene in muscle. There is currently no pharmacological treatment. The emergence of DUX4 enabled development of cell and animal models that could be used for basic and translational research. Since DUX4 is toxic, animal model development has been challenging, but progress has been made, revealing that tight regulation of DUX4 expression is critical for creating viable animals that develop myopathy. Here, we report such a model - the tamoxifen-inducible FSHD mouse model called TIC-DUX4. Uninduced animals are viable, born in Mendelian ratios, and overtly indistinguishable from WT animals. Induced animals display significant DUX4-dependent myopathic phenotypes at the molecular, histological, and functional levels. To demonstrate the utility of TIC-DUX4 mice for therapeutic development, we tested a gene therapy approach aimed at improving muscle strength in DUX4-expressing muscles using adeno-associated virus serotype 1.Follistatin (AAV1.Follistatin), a natural myostatin antagonist. This strategy was not designed to modulate DUX4 but could offer a mechanism to improve muscle weakness caused by DUX4-induced damage. AAV1.Follistatin significantly increased TIC-DUX4 muscle mass and strength even in the presence of DUX4 expression, suggesting that myostatin inhibition may be a promising approach to treat FSHD-associated weakness. We conclude that TIC-DUX4 mice are a relevant model to study DUX4 toxicity and, importantly, are useful in therapeutic development studies for FSHD.

Keywords: Gene therapy; Mouse models; Muscle Biology; Neuromuscular disease; Therapeutics.


Conflict of interest statement

Conflict of interest: The authors have declared that no conflict of interest exists.

Figures

Figure 1
Figure 1. Generation of the ROSA26-DUX4 knock-in mouse and DUX4 expression validation in TIC-DUX4 mice.
(A) Top, WT Rosa26 locus. Asterisk marks pRosa26-DUX4 insertion site. Black rectangles represent Rosa26 5′ and 3′ flanks. Gray rectangles depict Rosa26 genomic DNA sequences not included in the targeting construct. Middle, targeting construct inserted into Rosa26. The 5′ end contains a LoxP-flanked (floxed) neomycin resistance gene (NeoR) driven by the PGK promoter (not shown). Adjacent to the NeoR cassette is 1 DUX4 ORF (exon 1) fused to a V5 epitope sequence, followed by introns (Int1, Int2) and 3′ UTR exons (Ex2 and Ex3) from the last repeat of DUX4 (labeled 3′ UTR/pLAM). Exon 3 derives from the chrom 4q pLAM region and contains the noncanonical 5′-ATTAAA-3′ polyA signal utilized by the last DUX4 copy in FSHD patients. When present, the floxed NeoR cassette inhibits DUX4 expression from the Rosa26 promoter. A bovine growth hormone polyA signal (BGH pA; 5′-AATAAA-3′) was included next to DUX4/pLAM. The HSA-mER-Cre-mER (HSA-MCM) mouse was previously published. HSA, human skeletal actin promoter with β-globin intron (βGlobin-int); mER, mutated estrogen receptor. Arrows indicate PCR primers used to detect WT Rosa26 and the knocked-in transgene in mouse genomic DNA. PCR products sizes are indicated. (B) Southern blot screening of 6 ES cell clones for pRosa26-DUX4 knock-in. DNA was digested with EcoRV and probed with the probe indicated in A. WT ROSA26 alleles produce an 11,517-bp EcoRV band, while correctly targeted clones produced a 4,084-bp band. (C) Configuration of 2 DUX4 transcripts detected in induced TIC-DUX4 mice via nested 3′ RACE RT-PCR. Thirty-five of 36 clones contained correctly spliced products, while 1 clone had a retained intron 1. All transcripts utilized the BGH polyA signal. (D) Western blot of DUX4 expression in TIC-DUX4 mouse tissue. H, high dose tamoxifen; L, low dose tamoxifen; –, untreated. Positive control (+ ctrl) is protein extracted from CMV. DUX4-transfected HEK293 cells. (E) Wfdc3 cDNA, a biomarker of DUX4 in mice, was significantly increased 1,395- and 1,438-fold in high (H) and low (L) Tam– induced TIC-DUX4 muscles compared with untreated (U, sunflower oil) or WT control littermates (–), respectively. Data are measured from qPCR assays (P < 0.01; 1-way ANOVA with Tukey’s multiple comparison test). n = 4 for high Tam dose TIC-DUX4; n = 3 for all other groups.
Figure 2
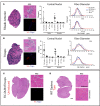
Figure 2. Histopathology in TIC-DUX4 mice following a medium-dose tamoxifen regimen.
(A and B) Left panels show tibialis anterior (TA) and triceps muscles from TIC-DUX4 mice 4 weeks after induction with 5 mg/kg tamoxifen, 3 times per week. Far left images show representative 10× muscle cryosections tiled to display an entire muscle in cross-section. Navy blue coloring was digitally added to each low-power image to easily visualize histopathology, including degenerating myofibers, regenerated myofibers containing central nuclei, and immune infiltration, which are features evident in the adjacent 20× images. The bottom higher-power images show immunofluorescence for DUX4 (V5 epitope, red) or nuclei (DAPI, blue). Widespread damage was present throughout induced TIC-DUX4 muscles. Increased percentage of myofibers with central nuclei and a shift toward smaller bore myofibers in induced TIC-DUX4 muscles support that muscles underwent degeneration and subsequent regeneration during this time course. Tamoxifen-induced TIC-DUX4 mice (TIC-DUX4 I) were significantly different from uninduced TIC-DUX4 (TIC-DUX4 U) and WT animals (2-way ANOVA with Tukey’s multiple comparison test; P < 0.05 for TA and P < 0.01 for triceps). No significant sex differences were measured in induced TIC-DUX4 animals. Mean central nuclei percentages for TA muscle of induced TIC-DUX4 males: 23.4%; uninduced TIC-DUX4 mice, 2.2%; WT, Tam-treated 2.0%; WT untreated, 1.1%. For female TA muscles: induced TIC-DUX4 23.9%; uninduced TIC-DUX4, 2.3%; WT, Tam-treated 2.6%; WT untreated, 1.3%. For triceps, mean central nucleic percentages in induced TIC-DUX4 males: 34.8%; uninduced TIC-DUX4, 4.5%; WT, Tam-treated 1.9%; WT untreated, 1.2%. For induced TIC-DUX4 female triceps: 27.3%; uninduced TIC-DUX4, 4.4%; WT,Tam-treated 2.3%; WT untreated 1.7%. Animals were 8–12 weeks of age during this experiment. For male mice: n = 9 induced and uninduced TIC-DUX4 mice; 4 tamoxifen-treated WT littermates; 4 untreated WT littermates. For females: n = 9 induced and 10 uninduced TIC-DUX4 mice; 4 tamoxifen-treated WT littermates; 4 untreated WT littermates. (C) Representative uninduced triceps muscle of 8- to 12-week-old TIC-DUX4 mice. (D) Representative tiled 10× image showing tamoxifen-treated gas muscle of 8- to 12-week-old WT mice. 20× H&E image (top right) demonstrated that tamoxifen treatment alone has no impact on muscle histology. Scale bars: 500 μm in low-power images; 100 μm at 20×.
Figure 3
Figure 3. Functional deficits in TIC-DUX4 mice following a medium-dose tamoxifen regimen.
(A) TIC-DUX4 animals treated with 5 mg/kg tamoxifen, 3× per week for 4 weeks showed significantly reduced overall cage activity and rearing behavior compared with vehicle (untreated) or WT controls. Induced TIC-DUX4 male and female mice had a mean activity of 2,616 and 1,719 mean beam breaks, respectively, compared with 5,999 and 6,173 mean beam breaks in uninduced TIC-DUX4 mice and 4,646 and 4,770 mean beam breaks in WT mice, respectively. Induced mice had a rearing frequency mean of 131.9 (male) and 124.3 (female) beam breaks compared with 659.9 (male) and 580.4 (female) beam breaks in uninduced TIC-DUX4 mice. WT animals had 468.6 (male) and 482.8 (female) mean beam breaks. Error bars show ± SD. I, tamoxifen induced; U, untreated. n = 8 induced male and 5 induced female TIC-DUX4 mice; 12 male and 11 female uninduced TIC-DUX4 mice; and 7 male and 6 female tamoxifen-treated WT littermate controls. For both total activity and rearing, induced TIC-DUX4 animals were significantly different from all control groups (2-way ANOVA with Tukey’s multiple comparison test; P < 0.05). (B) TIC-DUX4 mice treated with 5 mg/kg tamoxifen, 3× per week for 4 weeks developed significant weakness in the tibialis anterior muscles, as measured by absolute and specific force reductions compared with all control groups (P < 0.0001, 2-way ANOVA with Tukey’s multiple comparison test). Animals treated with 10-fold less tamoxifen concentration (0.5 mg/kg) during the same time course showed no measurable deficits. There were no significant differences between sexes, and data presented here are grouped only by treatment and genotype. Error bars represent ± SD. Mean absolute force: TIC-DUX4 mice (5 mg/kg Tam), 363.6 mN; TIC-DUX4 mice (0.5 mg/kg Tam), 1,135 mN; uninduced TIC-DUX4 mice, 1,349 mN; WT (5 mg/kg Tam), 1,231 mN; WT untreated, 1,125 mN. Mean specific force: TIC-DUX4 mice (5 mg/kg Tam), 120 mN/mm2; TIC-DUX4 (0.5 mg/kg Tam), 286.1 mN/mm2; uninduced TIC-DUX4 mice, 274.9 mN/mm2; WT (5 mg/kg Tam), 281.8 mN/mm2; WT untreated, 269.7 mN/mm2. n = 6 (5 mg/kg) induced TIC-DUX4 legs; 9 (0.5mg/kg) induced TIC-DUX4 legs; 7 uninduced TIC-DUX4 legs; 7 (5mg/kg) tamoxifen-treated WT littermate legs; and 14 untreated WT littermate legs. mN = milliNewtons.
Figure 4
Figure 4. Variable histopathology and no significant functional deficits in TIC-DUX4 diaphragm muscles following a medium-dose tamoxifen regimen.
Animals were treated with 5 mg/kg tamoxifen, or sunflower oil vehicle (U), 3× per week for 4 weeks. (A) Muscle cryosections from mice treated with indicated tamoxifen doses were stained with H&E and immunofluorescence for DUX4 (V5 epitope, red) or nuclei (DAPI, blue). The top 2 rows show the range of histopathology seen in diaphragm muscles within this cohort. First row shows examples of tamoxifen-induced TIC-DUX4 diaphragms displaying histopathology (mild inflammation, central nuclei, reduced eosin staining) colocalizing with DUX4 protein labeling. DUX4 can be visualized in the nucleus of intact myofibers, as well as in the cytoplasm of cells showing decreased eosinophilic staining. Second row shows examples of tamoxifen-induced TIC-DUX4 diaphragms with few or no degenerating fibers, despite having DUX4-positive nuclei. Third row, uninduced TIC-DUX4 diaphragms do not stain positive for DUX4 protein and have normal histology. Fourth row, tamoxifen-treated WT littermate diaphragms do not stain positive for DUX4 protein and have normal histology. Magnification, 20×. Scale bar: 100 μm. (B) Male and female induced TIC-DUX4 diaphragm fiber size distributions overlap with those of uninduced TIC-DUX4 controls and WT littermates. (C) Scatter plot showing that male and female tamoxifen-induced TIC-DUX4 diaphragms have myofibers with variable central nuclei (CN) percentages. The mean CN percentages were increased in TIC-DUX4 mice induced with tamoxifen (males, 8% mean CN with 0.8%–26.6% range; females, 6% mean CN with 0.3%–15.7% range), but values were not significantly different from controls (all uninduced TIC-DUX4 or WT controls groups showed <2.1% CN; 2-way ANOVA with Tukey’s repeated measures test). Nevertheless, 5 tamoxifen-induced TIC-DUX4 animals showed elevated CN above 10%, topping out at 28% in 1 male. Males, n = 9 induced and uninduced TIC-DUX4 mice; 4 tamoxifen-treated WT littermates; 4 uninduced WT littermates. Females n = 9 induced and 10 uninduced TIC-DUX4 mice; 4 tamoxifen-treated WT littermates; 4 untreated WT littermates. (D) Diaphragm contractile force was normal in tamoxifen-induced TIC-DUX4 animals. Six-month-old mice were treated with 5 mg/kg tamoxifen 3× per week for 4 weeks. Plots show absolute force and specific force (absolute force normalized to muscle cross sectional area). n = 4 male and 4 female tamoxifen-induced TIC-DUX4 animals; 4 male and 4 female uninduced TIC-DUX4 animals; 3 tamoxifen-treated WT littermates; and 3 uninduced WT littermate muscles. No significant changes; 2-way ANOVA with Tukey’s multiple comparisons test.
Figure 5
Figure 5. Progressive pathology in TIC-DUX4 mice treated with a low-dose tamoxifen regimen.
Data for this figure were generated with 8- to 12-week-old mice induced with 5 mg/kg tamoxifen given 1×/week for 1–4 months, as indicated. (A) H&E-stained cryosections (20×) from indicated muscles of TIC-DUX4 mice induced for 4 weeks to 16 weeks show progressive muscle degeneration and regeneration with time. WT littermates were treated with this tamoxifen regimen for 16 weeks and show normal muscle histology. (B) Total activity and rearing behavior were measured in all mice throughout the study. Top graph shows total cage activity from tamoxifen-treated TIC-DUX4 mice and WT littermates mice, measured monthly for 3 months, where baseline represents a pretreatment data point. The bottom graph shows rearing frequency in the same cohort over the same time course. There was a significant and progressive decline in Tam-induced TIC-DUX4 mouse activity and rearing that reached significance at 1 and 2 months, compared with TIC-DUX4 baseline (2-way ANOVA repeated measures; P < 0.05). In contrast, activity and rearing behavior in WT animals was not significantly different across the time course. n = 7 animal per group. When comparing TIC-DUX4 with WT animals at each time point, there was a significant difference between the groups only at the 2 month time point, for both overall activity and rearing behavior (Tukey’s post-hoc test; P < 0.01) (C and D) Low-dose Tam treatment caused significant absolute force deficits in the TA (P < 0.0001) and gas (P < 0.01) muscles and significantly decreased specific force in the gas (P < 0.05) compared with uninduced TIC-DUX4 mice. Test results were obtained with 1-way ANOVA using Tukey’s multiple comparisons test. For TA absolute force: Induced TIC-DUX4 mice, 601.3 mN; uninduced TIC-DUX4, 1,349 mN; WT, 1,148 mN). TA specific force: Induced TIC-DUX4 mice, 212.2 mN/mm2; uninduced TIC-DUX4, 274.9 mN/mm2; WT, 259.4 mN/mm2. For gas absolute force: Induced TIC-DUX4 mice, 693.6 mN; uninduced TIC-DUX4, 2,184 mN; WT, 2,356 mN). Gas specific force: Induced TIC-DUX4 mice, 103.9 mN/mm2; uninduced TIC-DUX4, 280.9 mN/mm2; WT, 253.3 mN/mm2. For TA muscles, n = 5 tamoxifen-induced TIC-DUX4 legs, 7 uninduced TIC-DUX4 legs, and 8 WT littermate legs. For gas, n = 5 tamoxifen-induced TIC-DUX4 legs, 8 uninduced legs, and 7 WT littermate legs.
Figure 6
Figure 6. AAV1.Follistatin increases TA muscle mass and absolute force in the presence of DUX4 expression.
(A) Six- to 7-week-old TIC-DUX4 and control mice were i.m. injected with 1 × 10¹¹ particles of AAV1.Follistatin. One week later, mice were treated with 5 mg/kg tamoxifen dosed 1×/week for 8 weeks. AAV1.Follistatin-injected TA muscles from tamoxifen-treated TIC-DUX4 were overtly larger than saline-injected TIC-DUX4 controls and WT muscles. Image magnification 4×. (B) H&E-stained cryosections show evidence of histopathology (myofibers with central nuclei) in tamoxifen-treated TIC-DUX4 TA muscles expressing follistatin and saline injected TIC-DUX4 controls. Tamoxifen-treated WT controls injected with saline appeared normal. Scale bar: 100μm. (C) Follistatin treatment significantly increased TA muscle weight compared with untreated controls (1-way ANOVA with Tukey’s multiple comparisons test; P < 0.001). Mean TA muscle weights: Follistatin-treated, induced TIC-DUX4 mice, 81 mg; saline-treated induced TIC-DUX4 mice, 29 mg; uninduced TIC-DUX4 mice, 37 mg; age-matched WT, 50 mg. n = 14 AAV1.Follistatin-treated, tamoxifen-induced TIC-DUX4 muscles; 10 saline-treated, tamoxifen-induced TIC-DUX4 muscles; 12 uninduced TIC-DUX4 muscles; 9 untreated C57/BL6 controls. (D) TA absolute force was significantly increased in induced TIC-DUX4 mice treated with AAV1.Follistatin compared with induced, saline-treated TIC-DUX4 controls (1-way ANOVA with Tukey’s multiple comparisons test; P < 0.0001). Mean TA absolute force: Follistatin-treated, induced TIC-DUX4 mice, 1,558 mN; saline-treated induced TIC-DUX4 mice, 601.3 mN; uninduced TIC-DUX4 mice, 1,349 mN; age-matched WT, 1,148 mN. (E) Specific force was determined by normalizing absolute force to muscle cross-sectional area. Follistatin treatment in induced TIC-DUX4 mice did not significantly improve specific force compared with all groups (1-way ANOVA with Tukey’s multiple comparisons test). n = 6 AAV1.Follistatin-treated, tamoxifen-induced TIC-DUX4 muscles; 5 saline-treated, tamoxifen-induced TIC-DUX4 muscles; 7 uninduced TIC-DUX4 muscles; 8 untreated WT controls.

Similar articles

Cited by

References

    1. Flanigan K. Facioscapulohumeral muscular dystrophy and scapuloperoneal disorders. In: Engel A, Franzini-Armstrong C, eds. Myology. New York, NY: McGraw-Hill Medical Publishing Division; 2004:1123-1133.
    1. Deenen JC, et al. Population-based incidence and prevalence of facioscapulohumeral dystrophy. Neurology. 2014;83(12):1056–1059. doi: 10.1212/WNL.0000000000000797. - DOI - PMC - PubMed
    1. Padberg G. Facioscapulohumeral Disease. Netherlands; Leiden University: 1982.
    1. Statland JM, Tawil R. Risk of functional impairment in Facioscapulohumeral muscular dystrophy. Muscle Nerve. 2014;49(4):520–527. doi: 10.1002/mus.23949. - DOI - PubMed
    1. Statland J, Tawil R. Facioscapulohumeral muscular dystrophy. Neurol Clin. 2014;32(3):721–728. - PMC - PubMed

Publication types