. 2018 Nov 14;9(11):1137.
doi: 10.1038/s41419-018-1172-y.

Glucocorticoid-mediated ER-mitochondria contacts reduce AMPA receptor and mitochondria trafficking into cell terminus via microtubule destabilization

Affiliations

Glucocorticoid-mediated ER-mitochondria contacts reduce AMPA receptor and mitochondria trafficking into cell terminus via microtubule destabilization

Gee Euhn Choi et al. Cell Death Dis. .

Abstract

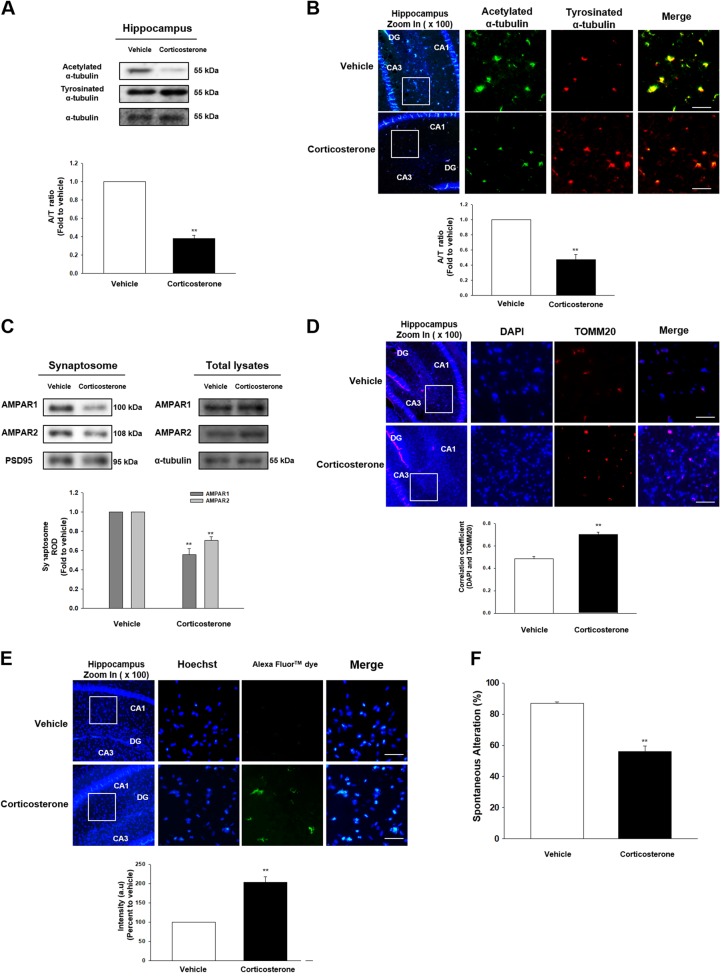
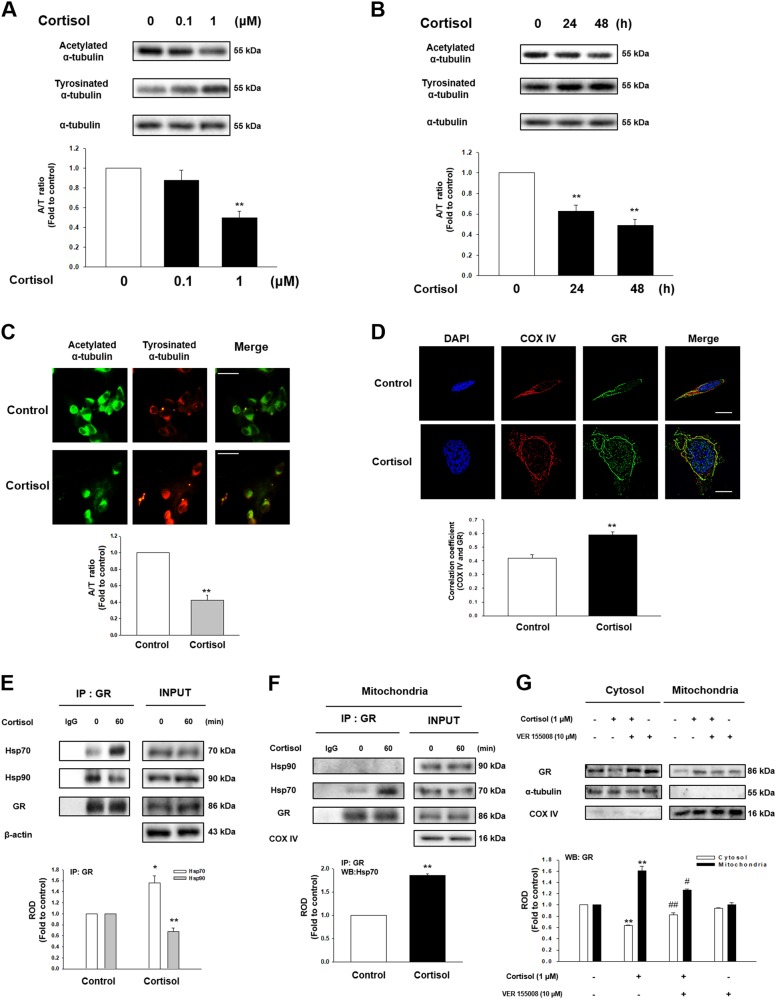
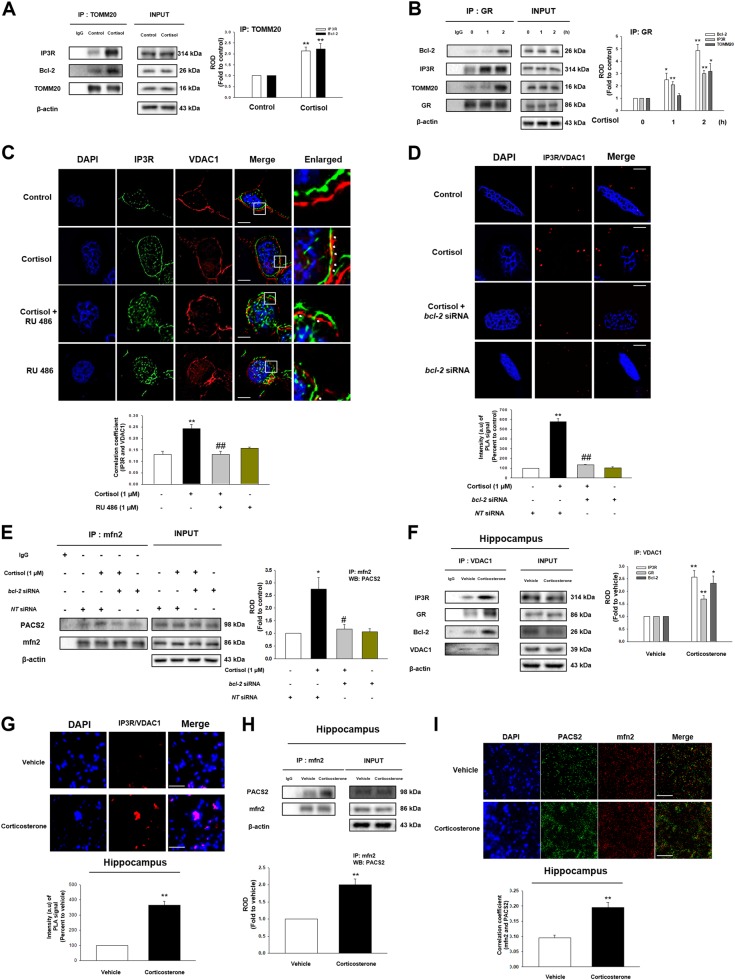
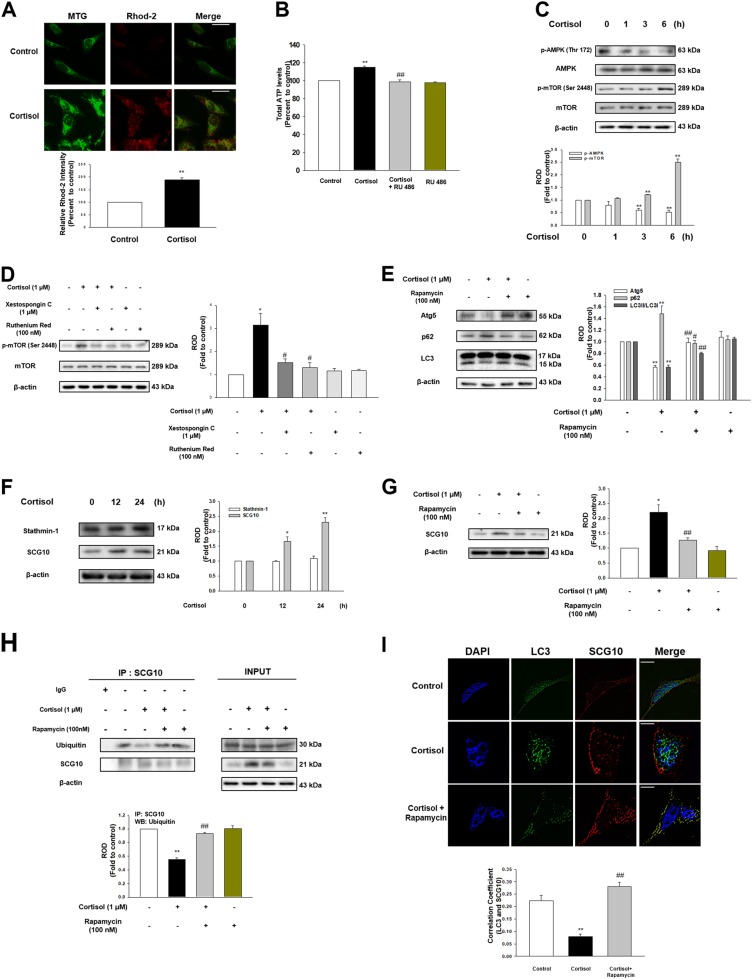
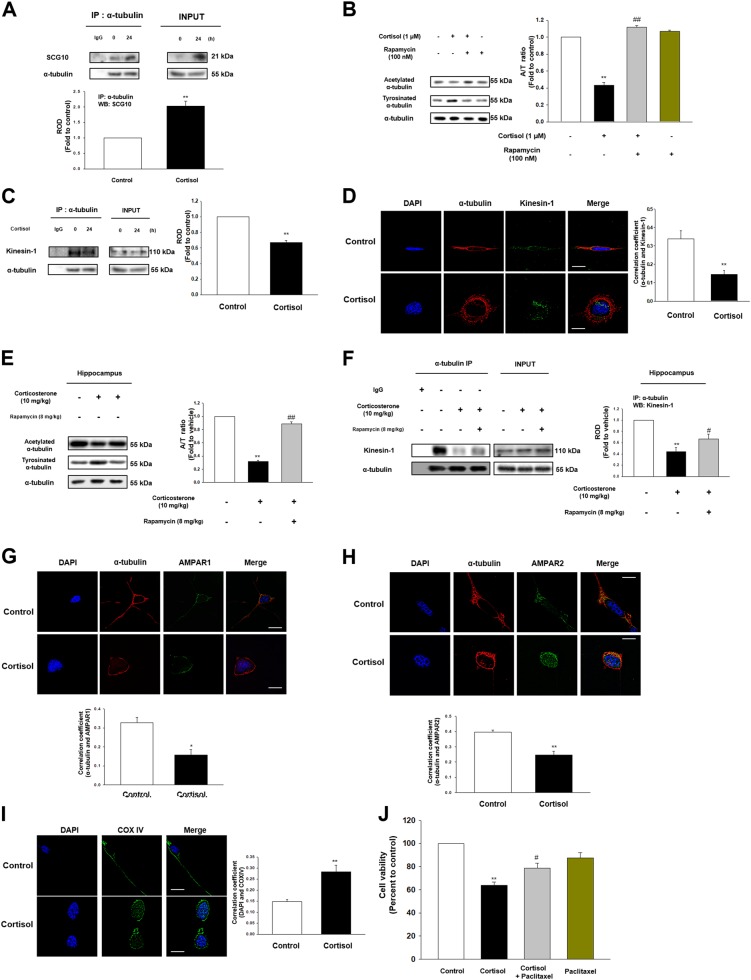
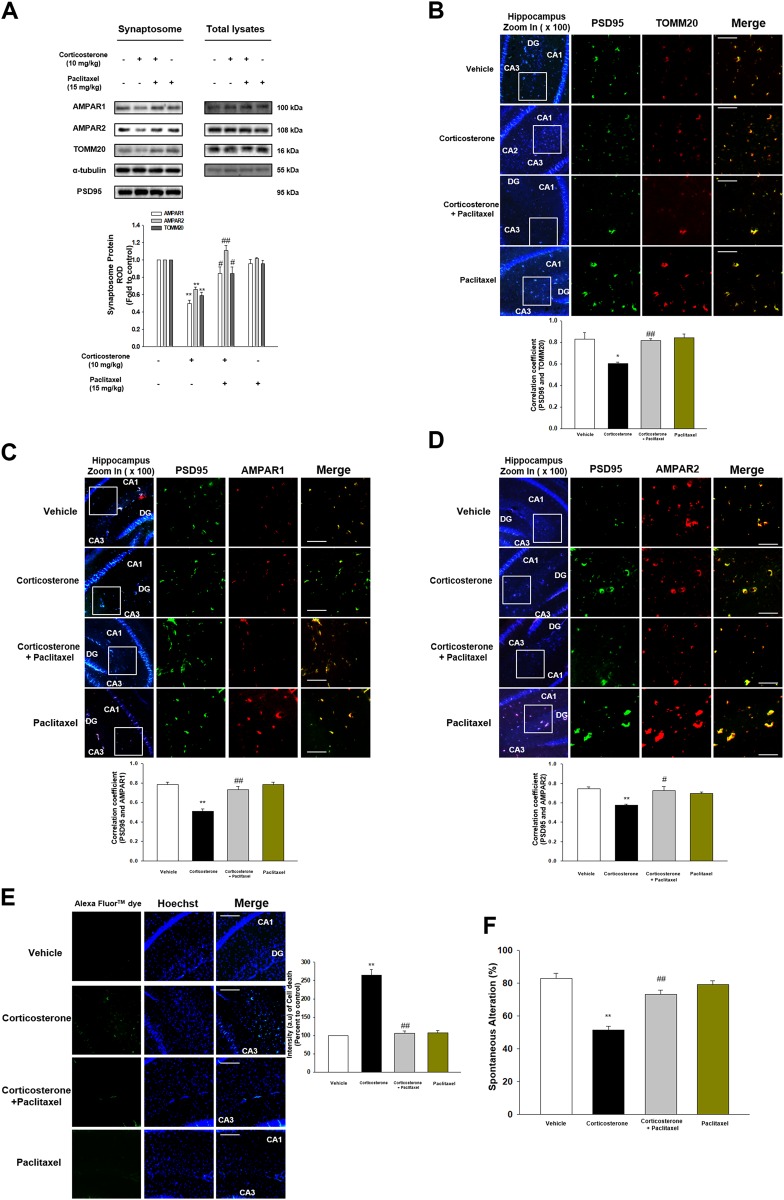
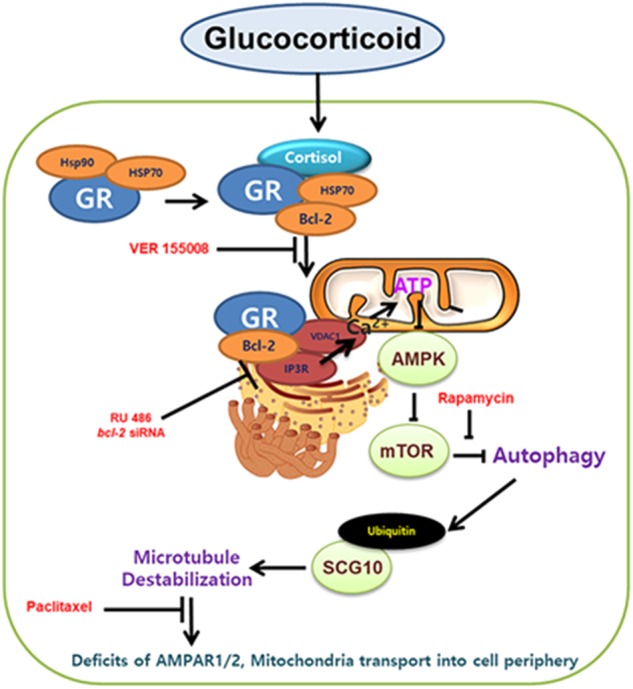
Glucocorticoid, a major risk factor of Alzheimer's disease (AD), is widely known to promote microtubule dysfunction recognized as the early pathological feature that culminates in memory deficits. However, the exact glucocorticoid receptor (GR)-mediated mechanism of how glucocorticoid triggers microtubule destabilization and following intracellular transport deficits remains elusive. Therefore, we investigated the effect of glucocorticoid on microtubule instability and cognitive impairment using male ICR mice and human neuroblastoma SH-SY5Y cells. The mice group that was exposed to corticosteroid, the major glucocorticoid form of rodents, showed reduced trafficking of α-amino-3-hydroxy-5-methyl-4-isoxazole propionic acid receptor (AMPAR) 1/2 and mitochondria, which are necessary for memory establishment, into the synapse due to microtubule destabilization. In SH-SY5Y cells, cortisol, the major glucocorticoid form of humans, also decreased microtubule stability represented by reduced acetylated α-tubulin to tyrosinated α-tubulin ratio (A/T ratio), depending on the mitochondria GR-mediated pathway. Cortisol translocated the Hsp70-bound GR into mitochondria which thereafter promoted GR-Bcl-2 interaction. Increased ER-mitochondria connectivity via GR-Bcl-2 coupling led to mitochondrial Ca2+ influx, which triggered mTOR activation. Subsequent autophagy inhibition by mTOR phosphorylation increased SCG10 protein levels via reducing ubiquitination of SCG10, eventually inducing microtubule destabilization. Thus, failure of trafficking AMPAR1/2 and mitochondria into the cell terminus occurred by kinesin-1 detachment from microtubules, which is responsible for transporting organelles towards periphery. However, the mice exposed to pretreatment of microtubule stabilizer paclitaxel showed the restored translocation of AMPAR1/2 or mitochondria into synapses and improved memory function compared to corticosterone-treated mice. In conclusion, glucocorticoid enhances ER-mitochondria coupling which evokes elevated SCG10 and microtubule destabilization dependent on mitochondrial GR. This eventually leads to memory impairment through failure of AMPAR1/2 or mitochondria transport into cell periphery.


Conflict of interest statement

The authors declare that they have no conflict of interest.

Figures

Fig. 1
Fig. 1. The effect of corticosterone on microtubule destabilization in the male ICR mice.
a The hippocampus of male ICR mice exposed to vehicle or corticosterone (10 mg/kg) was collected. Acetylated α-tubulin, tyrosinated α-tubulin, and α-tubulin were detected by western blot. ** indicates p < 0.01 vs. vehicle. n = 5. b Slide samples for immunohistochemistry (IHC) were immunostained with acetylated α-tubulin (green), tyrosinated α-tubulin (red), and DAPI (blue). Scale bars, 200 μm (magnification, ×200). ** indicates p < 0.01 vs. vehicle. n = 5. c The synaptic protein was extracted from the hippocampus of mice treated with vehicle or corticosterone (10 mg/kg). Synaptic protein expressions were normalized by loading control of synaptosome, PSD95. Total lysates of hippocampus were also shown in the right panel. ** indicates p < 0.01 vs. vehicle. n = 5. d Slide samples for IHC were immunostained with DAPI (blue) and TOMM20 (red). Scale bars, 200 μm (magnification, ×200). Correlation coefficient analysis using Pearson’s coefficient value between DAPI and TOMM20 was done. ** indicates p < 0.01 vs. vehicle. n = 5. e TUNEL assay was performed using slide samples of hippocampus from mice with vehicle or corticosterone (10 mg/kg). The intensity of green fluorescence indicates the amount of neuronal cell death. Scale bars, 200 μm (magnification, ×200). ** indicates p < 0.01 vs. vehicle. n = 5. f The mice exposed to vehicle or corticosterone (10 mg/kg) were subjected to Y-maze test to evaluate memory function. ** indicates p < 0.01 vs. vehicle. n = 6. All blot and immunofluorescence images are representative. Quantative data are presented as a mean ± S.E.M.
Fig. 2
Fig. 2. The effect of cortisol on microtubule dysfunction via GR trafficking into mitochondria in SH-SY5Y.
a Cortisol (0–1 μM) was treated for 48 h in SH-SY5Y cells. Then, acetylated α-tubulin, tyrosinated α-tubulin, and α-tubulin were detected by western blot. ** indicates p < 0.01 vs. control. n = 5. b Total cell lysates in a time response with 1 μM cortisol were subjected to western blot. Acetylated α-tubulin, tyrosinated α-tubulin, and α-tubulin were detected. ** indicates p < 0.01 vs. control. n = 5. (c) Immunostaining of cells treated with cortisol for 48 h were visualized by Eclipse Ts2™ fluorescence microscopy. The green indicates acetylated α-tubulin and the red indicates tyrosinated α-tubulin. Scale bars, 100 μm (magnification, ×400). ** indicates p < 0.01 vs. control. n = 5. d The cells were treated with cortisol (1 μM) for 2 h which were immnunostained with DAPI (blue), COX IV (red) and GR (green). The images were acquired by SRRF imaging system. ** indicates p < 0.01 vs. control. Scale bars, 20 μm (magnification, ×1000). n = 5. (e) The cells were incubated with cortisol (1 μM) for 60 min. GR was co-immunoprecipitated with anti-Hsp70 and -Hsp90 antibodies (the left side). Expression of Hsp70, Hsp90, GR, and β-actin in total cell lysates is shown in the right side. *, ** indicates p < 0.05, p < 0.01 vs. control, respectively. n = 4. f The mitochondrial parts of the cells treated with cortisol (1 μM) for 60 min underwent immunoprecipiatation with GR. ** indicates p < 0.01 vs. control. n = 5. (g) The cells were incubated with VER 155008 (10 μM) for 30 min before cortisol treatment (1 μM) for 2 h. Cytosolic and mitochondrial protein expressions were normalized by α-tubulin and COX IV, respectively. ** indicates p < 0.01 vs. control. #, ## indicates p < 0.05, p < 0.01 vs. cortisol, respectively. n = 4. All blot and immunofluorescence images are representative. Quantative data are presented as a mean ± S.E.M.
Fig. 3
Fig. 3. The effect of cortisol on ER-mitochondria contact via interaction between GR and Bcl-2.
a The cells were incubated with cortisol (1 μM) for 2 h. TOMM20 was co-immunoprecipitated with anti-IP3R and -Bcl-2 antibodies (the left side). Expression of IP3R, Bcl-2, TOMM20, and β-actin in total cell lysates is shown in the right side. ** indicates p < 0.01 vs. control. n = 4. b The cells were incubated with cortisol (1 μM) for various time. GR was co-immunoprecipitated with anti-Bcl-2, IP3R, and TOMM20 antibodies (the left side). Expression of Bcl-2, IP3R, TOMM20, GR, and β-actin in total cell lysates is shown in the right side. *, ** indicates p < 0.05, p < 0.01 vs. control, respectively. n = 4. (c) The cells were incubated with RU 486 (1 μM) for 30 min before cortisol treatment (1 μM) for 2 h. Co-localization of IP3R (green) and VDAC1 (red) was visualized with SRRF imaging system. DAPI was used for nuclear counterstaining (blue). ** indicates p < 0.01 vs. control and ## indicates p < 0.01 vs. cortisol alone. Scale bars represent 20 μm (magnification, ×900). n = 5. d Knockdown of bcl-2 was done using siRNA transfection for 24 h and then cells were treated with cortisol (1 μM) during 2 h. The cells underwent proximal ligation assay (PLA) and the red fluorescence indicates the co-localization between IP3R and VDAC1. DAPI was used for nuclear counterstaining (blue). Data are acquired by SRRF imaging system. ** indicates p < 0.01 vs. control and ## indicates p < 0.01 vs. cortisol alone. Scale bars represent 20 μm (magnification, ×900). n = 4. (e) Knockdown of bcl-2 was done using siRNA transfection for 24 h and then cells were treated with cortisol (1 μM) during 2 h. mfn2 was co-immunoprecipitated with an anti-PACS2 antibody (the left side). Expression of PACS2, mfn2, and β-actin in total cell lysates is shown in the right side. * indicates p < 0.05 vs. control and # indicates p < 0.05 vs. cortisol alone. n = 4. f The hippocampus of mice exposed to vehicle or corticosterone (10 mg/kg) for 2 h was collected and lysed. VDAC1 was co-immunoprecipitated with anti-IP3R, GR, and Bcl-2 antibodies (the left side). Expression of IP3R, GR, Bcl-2, VDAC1, and β-actin in total cell lysates is shown in the right side. *, ** indicates p < 0.05, p < 0.01 vs. vehicle, respectively. n = 5. g Slide samples for IHC of mice with vehicle or corticosterone (10 mg/kg) for 2 h underwent PLA and the red fluorescence indicates the co-localization between IP3R and VDAC1. DAPI was used for nuclear counterstaining (blue). ** indicates p < 0.01 vs. vehicle. Scale bars, 200 μm (magnification, ×200). n = 5. (h) The hippocampus of mice exposed to vehicle or corticosterone (10 mg/kg) for 2 h was collected and lysed. mfn2 was co-immunoprecipitated with an anti-PACS2 antibody (the left side). Expression of PACS2, mfn2, and β-actin in total cell lysates is shown in the right side. ** indicates p < 0.01 vs. vehicle. n = 5. i Slide samples for IHC of mice with vehicle or corticosterone (10 mg/kg) for 2 h were immunostained with PACS2 (green) and mfn2 (red). DAPI was used for nuclear counterstaining (blue). Scale bars, 200 μm (magnification, ×200). ** indicates p < 0.01 vs. vehicle. n = 5. All blot and immunofluorescence images are representative. Quantative data are presented as a mean ± S.E.M.
Fig. 4
Fig. 4. Cortisol inhibited selective autophagy towards SCG10 via activation of mTOR.
a The cells were treated with cortisol (1 μM) for 3 h, and stained with rhod-2 (3 μM) for 1 h to detect mitochondrial Ca2+. After incubation, mitotracker green (MTG, 300 nM) was also stained to visualize mitochondria. The intensity of both rhod-2 (red) and MTG (green) was measured with Eclipse Ts2™ fluorescence microscopy. ** indicates p < 0.01 vs. control. Scale bars represent 100 μm (magnification, ×400). n = 5. b The cells were treated with RU 486 (1 μM) for 30 min before cortisol (1 μM) for 6 h, and then reacted with ATP luciferase reagent. The ATP levels were detected with luminometer. ** indicates p < 0.01 vs. control and ## indicates p < 0.01 vs. cortisol alone. n = 6. c Time responses (0–6 h) of cortisol (1 μM) in phosphorylation of AMPK at Thr172 and mTOR at Ser2448 were shown. ** indicates p < 0.01 vs. control. n = 4. d The cells were treated with xestospongin C (1 μM) for 2 h or ruthenium red (100 nM) for 30 min before cortisol (1 μM) for 6 h. p-mTOR (Ser2448), mTOR, and β-actin were detected in western blotting results. * indicates p < 0.05 vs. control and # indicates p < 0.05 vs. cortisol alone. n = 4. e The cells were pretreated with rapamycin (100 nM) for 30 min before cortisol (1 μM) for 24 h. Atg5, p62, LC3, and β-actin were detected with western blot. ** indicates p < 0.01 vs. control. #, ## indicates p < 0.05, p < 0.01 vs. cortisol, respectively. n = 5. f Time responses (0–24 h) of cortisol (1 μM) in stathmin-1 and SCG10 expressions were shown. *, ** indicates p < 0.05, p < 0.01 vs. control, respectively. n = 5. g The cells were pretreated with rapamycin (100 nM) for 30 min before cortisol (1 μM) for 24 h. SCG10 and β-actin were detected with western blot. * indicates p < 0.05 vs. control and ## indicates p < 0.01 vs. cortisol. n = 4. h The cells were pretreated with rapamycin (100 nM) for 30 min before cortisol (1 μM) for 24 h. SCG10 was co-immunoprecipitated with an anti-ubiquitin antibody (the left side). Expression of ubiquitin, SCG10, and β-actin in total cell lysates is shown in the right side. ** indicates p < 0.01 vs. control and ## indicates p < 0.01 vs. cortisol alone. n = 4. i The cells were pretreated with rapamycin (100 nM) for 30 min before cortisol (1 μM) for 24 h. Co-localization of LC3 (green) and SCG10 (red) was visualized with SRRF imaging system. DAPI was used for nuclear counterstaining (blue). ** indicates p < 0.01 vs. control and ## indicates p < 0.01 vs. cortisol alone. Scale bars represent 20 μm (magnification, ×1,000). n = 5. All blot and immunofluorescence images are representative. Quantative data are presented as a mean ± S.E.M.
Fig. 5
Fig. 5. Glucocorticoid promoted microtubule destabilization and following transport impairment.
a The cells were treated with cortisol (1 μM) for 24 h and lysed. α-tubulin was co-immunoprecipitated with an anti-SCG10 antibody (the left side). Expression of SCG10 and α-tubulin in total cell lysates is shown in the right side. ** indicates p < 0.01 vs. control. n = 4. b The cells were pretreated with rapamycin (100 nM) for 30 min before cortisol (1 μM) for 48 h. Acetylated α-tubulin, tyrosinated α-tubulin, and α-tubulin were detected with western blot. ** indicates p < 0.01 vs. control and ## indicates p < 0.01 vs. cortisol alone. n = 4. c The cells were treated with cortisol (1 μM) for 24 h. α-tubulin was co-immunoprecipitated with an anti-kinesin-1 antibody (the left side). Expression of kinesin-1 and α-tubulin in total cell lysates is shown in the right side. ** indicates p < 0.01 vs. control. n = 4. d The cells were incubated with cortisol (1 μM) for 24 h. Co-localization of α-tubulin (red) and kinesin-1 (green) was visualized with SRRF imaging system. DAPI was used for nuclear counterstaining (blue). ** indicates p < 0.01 vs. control. Scale bars represent 20 μm (magnification, ×1000). n = 5. e The hippocampus of mice exposed to rapamycin (8 mg/kg) for 2 days before corticosterone (10 mg/kg) for 24 h was collected. Acetylated α-tubulin, tyrosinated α-tubulin, and α-tubulin were detected by western blot. ** indicates p < 0.01 vs. vehicle. ## indicates p < 0.01 vs. corticosterone alone. n = 5. f The hippocampus of mice exposed to rapamycin (8 mg/kg) for 2 days before corticosterone (10 mg/kg) for 24 h was collected and lysed. α-tubulin was co-immunoprecipitated with an anti-kinesin-1 antibody (the left side). Expression of kinesin-1 and α-tubulin in total cell lysates is shown in the right side. ** indicates p < 0.01 vs. vehicle. # indicates p < 0.05 vs. corticosterone alone. n = 4. g–h The cells were incubated with cortisol (1 μM) for 48 h. Co-localization of α-tubulin (red) and AMPAR1/2 (green) was visualized with SRRF imaging system. DAPI was used for nuclear counterstaining (blue). *, ** indicates p < 0.05, p < 0.01 vs. control, respectively. Scale bars represent 20 μm (magnification, ×1000). n = 5. i The cells treated with cortisol (1 μM) for 48 h were immunostained with DAPI (blue) and COX IV (green). ** indicates p < 0.01 vs. control. Scale bars represent 20 μm (magnification, ×1000). n = 5. j The cells were pre-incubated with paclitaxel (10 μM) for 30 min before cortisol (1 μM) for 48 h. After treatment, water soluble tetrazolium salt (WST-1) assay was performed to measure cell viability. ** indicates p < 0.01 vs. control and # indicates p < 0.05 vs. cortisol alone. n = 6. All blot and immunofluorescence images are representative. Quantative data are presented as a mean ± S.E.M.
Fig. 6
Fig. 6. Corticosterone-induced memory impairment was attenuated by paclitaxel.
a The synaptosome of hippocampus from mice exposed to vehicle, corticosterone (10 mg/kg), corticosterone with paclitaxel (15 mg/kg), and paclitaxel alone was isolated. AMPAR1, AMPAR2, TOMM20, α-tubulin, and PSD95 were detected. PSD95 was used as a loading control of synaptosome. ** indicates p < 0.01 vs. vehicle. #, ## indicates p < 0.05, p < 0.01 vs. corticosterone treatment group, respectively. n = 6. b–d The mice were exposed to vehicle, corticosterone (10 mg/kg), corticosterone with paclitaxel (15 mg/kg), or paclitaxel. Slide samples for IHC were immunostained with PSD95 (green), TOMM20 or AMPAR1/2 (red), and DAPI (blue). *, ** indicates p < 0.05, p < 0.01 vs. vehicle, respectively. #, ## indicates p < 0.05, p < 0.01 vs. corticosterone alone, respectively. Scale bars, 200 μm (magnification, ×200). n = 5. e TUNEL assay was performed using slide samples of hippocampus from mice with vehicle, corticosterone (10 mg/kg), corticosterone with paclitaxel (15 mg/kg), or paclitaxel. The intensity of green fluorescence indicates the amount of neuronal cell death. ** indicates p < 0.01 vs. vehicle and ## indicates p < 0.01 vs. corticosterone alone. Scale bars, 200 μm (magnification, ×200). n = 5. f The mice exposed to vehicle, corticosterone (10 mg/kg), corticosterone with paclitaxel (15 mg/kg), or paclitaxel were subjected to Y-maze test to evaluate memory function. ** indicates p < 0.01 vs. vehicle and ## indicates p < 0.01 vs. corticosterone alone. n = 6
Fig. 7
Fig. 7. A hypothetical model for microtubule destabilization and memory deficits by the mitochondrial GR dependent action of glucocorticoid.
GR bound to Hsp 70 is localized in mitochondria and forms complex with Bcl-2. GR-Bcl-2 complex promotes ER-mitochondria connection via IP3R-VDAC1 ligation and mitochondrial Ca2+ influx is induced. Subsequent mTOR activation inhibits selective autophagy which constantly triggers ubiquitination of SCG10. Increased SCG10 level evokes microtubule destabilization and trafficking of AMPAR or mitochondria into cell periphery is reduced due to kinesin-1 detachment. Thus, memory impairment and cell death follows, which is recovered by paclitaxel

References

    1. Brandt R, Bakota L. Microtubule dynamics and the neurodegenerative triad of Alzheimer’s disease: the hidden connection. J. Neurochem. 2017;143:409–417. doi: 10.1111/jnc.14011. - DOI - PubMed
    1. Davidkova G, Carroll RC. Characterization of the role of microtubule-associated protein 1B in metabotropic glutamate receptor-mediated endocytosis of AMPA receptors in hippocampus. J. Neurosci. 2007;27:13273–13278. doi: 10.1523/JNEUROSCI.3334-07.2007. - DOI - PMC - PubMed
    1. Mandal M, et al. Impaired α-amino-3-hydroxy-5-methyl-4-isoxazolepropionic acid (AMPA) receptor trafficking and function by mutant huntingtin. J. Biol. Chem. 2011;286:33719–33728. doi: 10.1074/jbc.M111.236521. - DOI - PMC - PubMed
    1. Friedman JR, Webster BM, Mastronarde DN, Verhey KJ, Voeltz GK. ER sliding dynamics and ER–mitochondrial contacts occur on acetylated microtubules. J. Cell. Biol. 2010;190:363–375. doi: 10.1083/jcb.200911024. - DOI - PMC - PubMed
    1. Green KN, Billings LM, Roozendaal B, McGaugh JL, LaFerla FM. Glucocorticoids increase amyloid-β and tau pathology in a mouse model of Alzheimer’s disease. J. Neurosci. 2006;26:9047–9056. doi: 10.1523/JNEUROSCI.2797-06.2006. - DOI - PMC - PubMed

Publication types

MeSH terms