. 2018 Nov 14;9(11):1132.
doi: 10.1038/s41419-018-1165-x.

Restoration of FBP1 suppressed Snail-induced epithelial to mesenchymal transition in hepatocellular carcinoma

Affiliations

Restoration of FBP1 suppressed Snail-induced epithelial to mesenchymal transition in hepatocellular carcinoma

Gao-Min Liu et al. Cell Death Dis. .

Abstract

Fructose-1,6-bisphosphatase (FBP1), one of the rate-limiting gluconeogenic enzymes, plays critical roles in several cancers and is treated as a tumour suppressor. However, its role in hepatocellular carcinoma (HCC) is unclear. Here, we demonstrated that FBP1 was significantly inhibited during Snail-induced epithelial to mesenchymal transition (EMT) and tissues in HCC. Restoration of FBP1 expression in HCC cancer cells suppressed EMT phenotype, tumour migration and tumour growth induced by Snail overexpression in SMMC-7721 cells. Gene set enrichment analyses revealed significantly enriched terms, including WNT, Notch, ESC, CSR and PDGF, in the group with high Snail and low FBP1 compared with those with low Snail and high FBP1. Low FBP1 expression was significantly correlated with higher AFP level, satellite nodules, portal vein tumour thrombus, and advanced tumour stage. Survival analyses showed that FBP1 was an independent prognostic factor for overall survival and recurrence-free survival. In conclusion, our study revealed a vital role for FBP1 in Snail-induced EMT and prognostic prediction in HCC.


Conflict of interest statement

The authors declare that they have no conflict of interest.

Figures

Fig. 1
Fig. 1. Expression of FBP1 was suppressed during Snail-induced EMT.
a The expression of Snail in HCC cell lines; Snail was highest in MHCC-97H but lowest in SMMC-7721. b Quantitative real-time PCR analysis showed significantly higher expression of Snail in SMMC-7721-Snail than control SMMC-7721 cells. c Transwell migration assay showed Snail overexpression significantly promoted SMMC-7721 cell migration. d CCK8 assay showed Snail overexpression did not significantly affect SMMC-7721 cell proliferation. e Quantitative real-time PCR analysis showed Snail overexpression significantly suppressed E-cadherin in SMMC-7721 cells. f Quantitative real-time PCR analysis showed Snail overexpression significantly induced Vimentin in SMMC-7721 cells. g Quantitative real-time PCR analysis showed Snail overexpression significantly inhibited FBP1 in SMMC-7721 cells. h Western blot analysis showed Snail overexpression induced Vimentin but suppressed E-cadherin and FBP1 protein in SMMC-7721. *P < 0.05, **P < 0.01, NS not significant, compared with control. MW molecular weight. All data are based on three independent repeats
Fig. 2
Fig. 2. Expression of FBP1 and EMT markers in five HCC cell lines.
a Quantitative real-time PCR analysis of FBP1 in MHCC-97H, MHCC-97L, HepG2, Hep3B and SMMC-7721 cells. b Western blot analysis of FBP1, E-cadherin, Vimentin and Snail in MHCC-97H, MHCC-97L, HepG2, Hep3B and SMMC-7721 cells. All data are based on three independent repeats. MW molecular weight
Fig. 3
Fig. 3. Ectopic FBP1 suppressed Snail-induced EMT and tumour growth in SMMC-7721 cells.
a Western blot analysis showed expression changes of E-cadherin and Vimentin induced by Snail expression were hindered by forced expression of FBP1 in SMMC-7721 cells. Ectopic FBP1 expression did not significantly affect Snail, Slug, ZEB1 and Twist1 expression. b Immunofluorescence assay showed SMMC-7721-snail-FBP1 cells expressed higher E-cadherin but lower Vimentin levels and appeared more like epithelial cells than SMMC-7721-Snail cells. The magnifications used were ×200. c Transwell migration analyses showed FBP1 expression significantly inhibited cell migration induced by Snail overexpression in SMMC-7721 cells. d Representative images of day 42 tumours in mice transplanted with SMMC-7721, SMMC-7721-Snail and SMMC-7721-Snail-FBP1. e, f The mean tumour diameters and weights in each group are shown. g The representative images of Snail, FBP1 and E-cadherin expression in transplanted tumours. The magnifications used were ×200. *P < 0.05, NS not significant, compared with control. The data presented in ac are based on three independent repeats. The number of mice for each group in d is 9. MW molecular weight
Fig. 4
Fig. 4. Gene set enrichment analyses using data from TCGA LIHC dataset.
a The enriched terms in the high Snail group compared with the low Snail group are shown in green. The enriched terms in the low Snail group compared with the high Snail group are shown in red. The overlapping enriched terms are shown in blue. b The representative enriched terms are shown. NES normalised enrichment score, FDR false discovery rate
Fig. 5
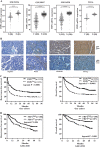
Fig. 5. The expression of FBP1 and prognostic role in HCC patients.
a The expression of FBP1 mRNA was suppressed in HCC when compared with non-tumour controls using data from GSE14520, GSE54236, GSE25097 and TCGA HCC cases (T = tumour tissue, N = non-tumour tissue). b The representative images of FBP1 expression in HCC tissues. The magnifications used were ×100 (the upper four) and ×200 (the lower four). c Kaplan-Meier survival curves showed significantly better recurrence-free survival and overall survival in patients with high FBP1 expression when compared with those with low FBP1 expression in our cohort. d Kaplan–Meier survival curves showed significantly better recurrence-free survival and overall survival in patients with high FBP1 expression when compared with those with low FBP1 expression in the GSE14520 cohort. ***P < 0.001, ****P < 0.0001, when compared with control
Fig. 6
Fig. 6. Prognostic role of FBP1 and Snail.
a The expression of Snail mRNA and its correlation with FBP1 mRNA in GSE14520, GSE54236, GSE25097 and TCGA HCC cases. b Representative case with low Snail but high FBP1 expression (Case 1) and case with high Snail but low FBP1 expression (Case 2). The magnifications used were ×200. c Kaplan–Meier survival curves showed the difference in recurrence-free survival according to expression of FBP1 and Snail in our cohort. d Kaplan–Meier survival curves showed the difference in overall survival according to expression of FBP1 and Snail in our cohort. e Kaplan–Meier survival curves showed the difference in recurrence-free survival according to expression of FBP1 and Snail in the GSE14520 cohort. f Kaplan–Meier survival curves showed the difference in overall survival according to expression of FBP1 and Snail in the GSE14520 cohort. **** means P<0.0001

References

    1. Torre LA, et al. Global cancer statistics, 2012. CA Cancer J. Clin. 2015;65:87–108. doi: 10.3322/caac.21262. - DOI - PubMed
    1. Wang X, Zhang A, Sun H. Power of metabolomics in diagnosis and biomarker discovery of hepatocellular carcinoma. Hepatol. (Baltim., MD) 2013;57:2072–2077. doi: 10.1002/hep.26130. - DOI - PubMed
    1. De Craene B, Berx G. Regulatory networks defining EMT during cancer initiation and progression. Nat. Rev. Cancer. 2013;13:97–110. doi: 10.1038/nrc3447. - DOI - PubMed
    1. Thiery JP. Epithelial-mesenchymal transitions in tumour progression. Nat. Rev. Cancer. 2002;2:442–454. doi: 10.1038/nrc822. - DOI - PubMed
    1. Nieto MA. The snail superfamily of zinc-finger transcription factors. Nat. Rev. Mol. Cell Biol. 2002;3:155–166. doi: 10.1038/nrm757. - DOI - PubMed

Publication types

MeSH terms