. 2018 Nov 14;9(1):4775.
doi: 10.1038/s41467-018-06951-2.

Sustained activation of the Aryl hydrocarbon Receptor transcription factor promotes resistance to BRAF-inhibitors in melanoma

Affiliations

Sustained activation of the Aryl hydrocarbon Receptor transcription factor promotes resistance to BRAF-inhibitors in melanoma

Sébastien Corre et al. Nat Commun. .

Abstract

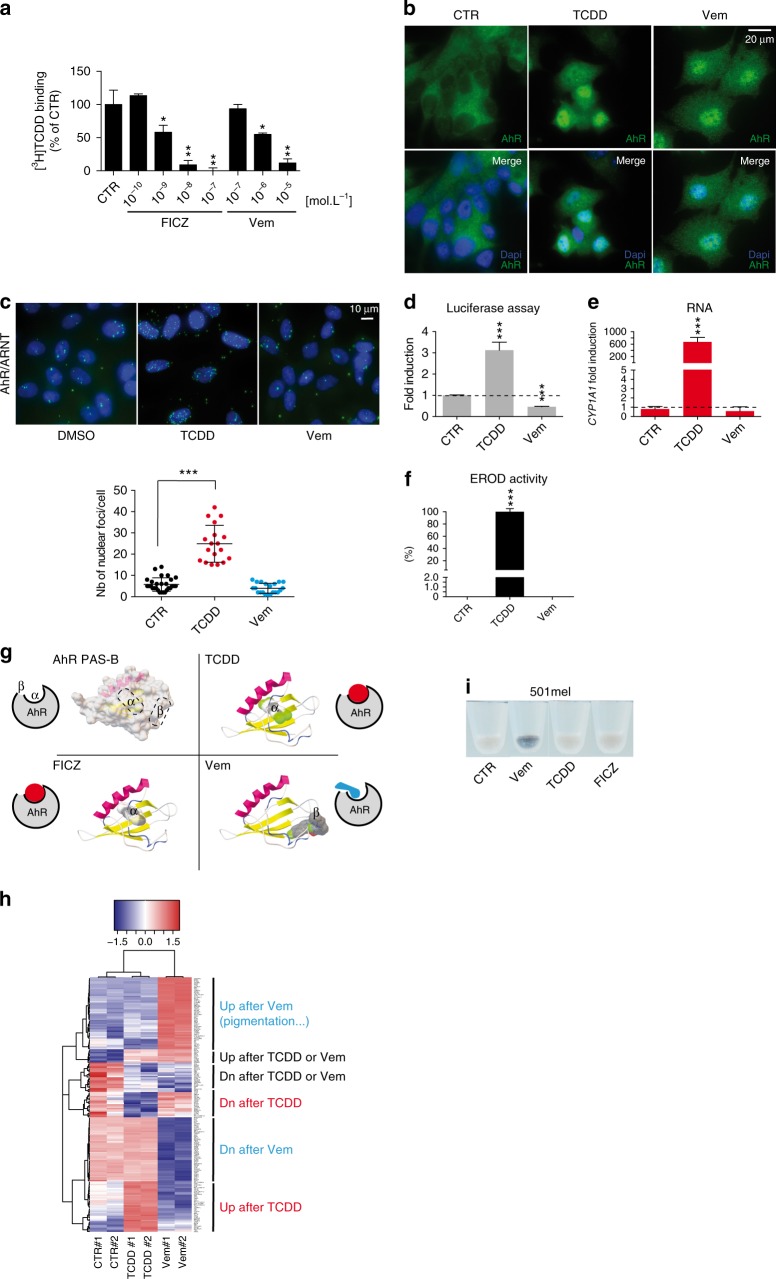
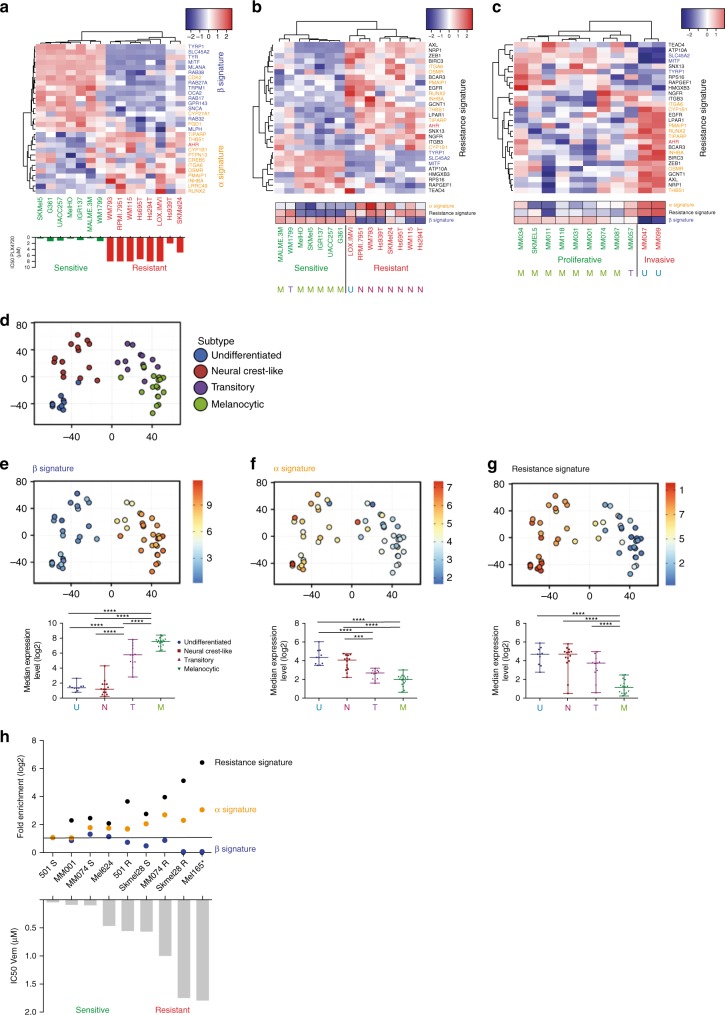
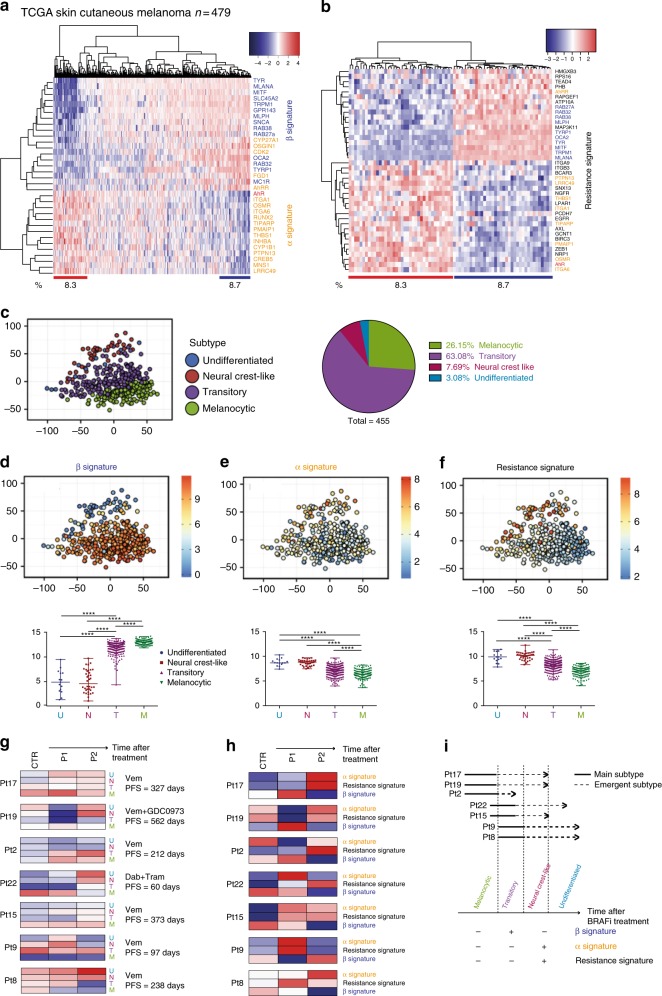
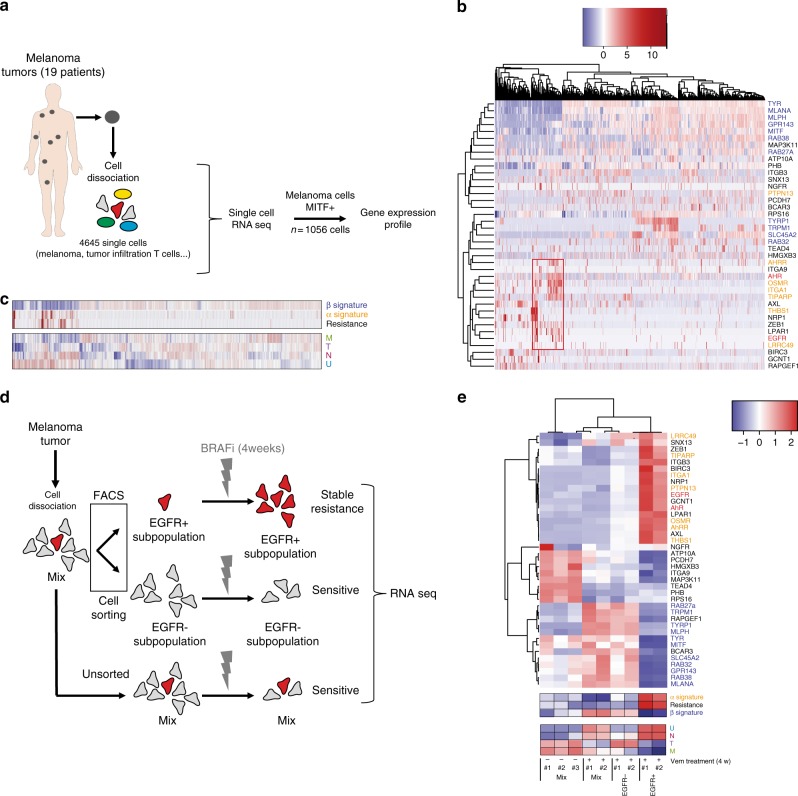
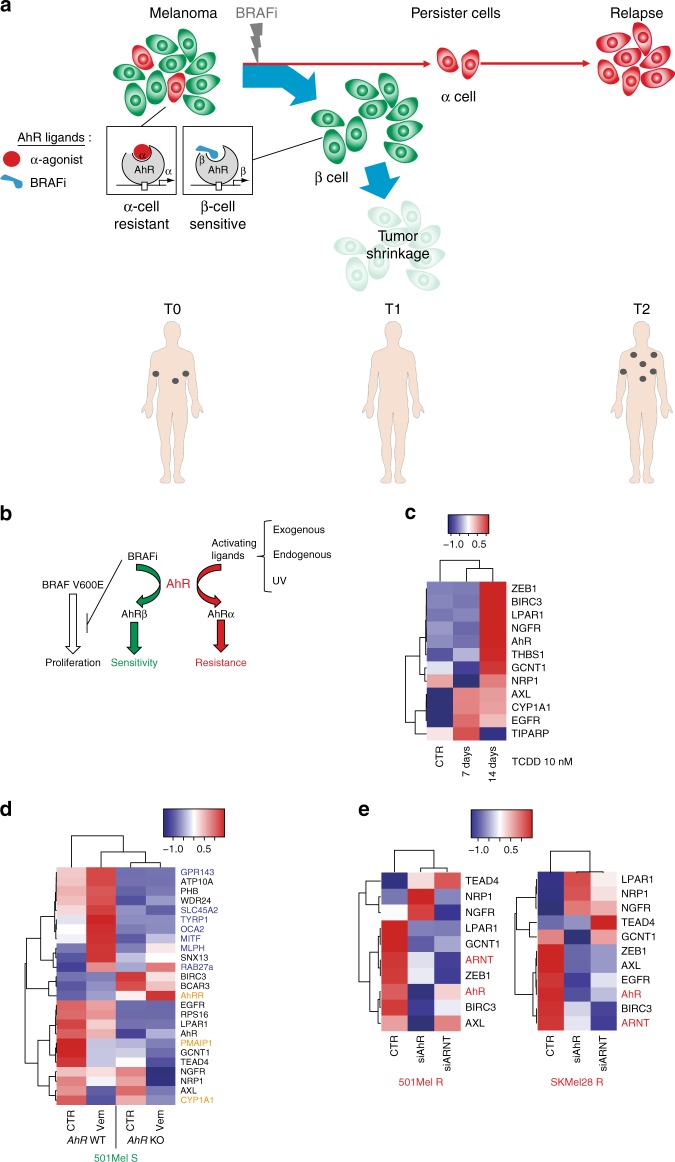
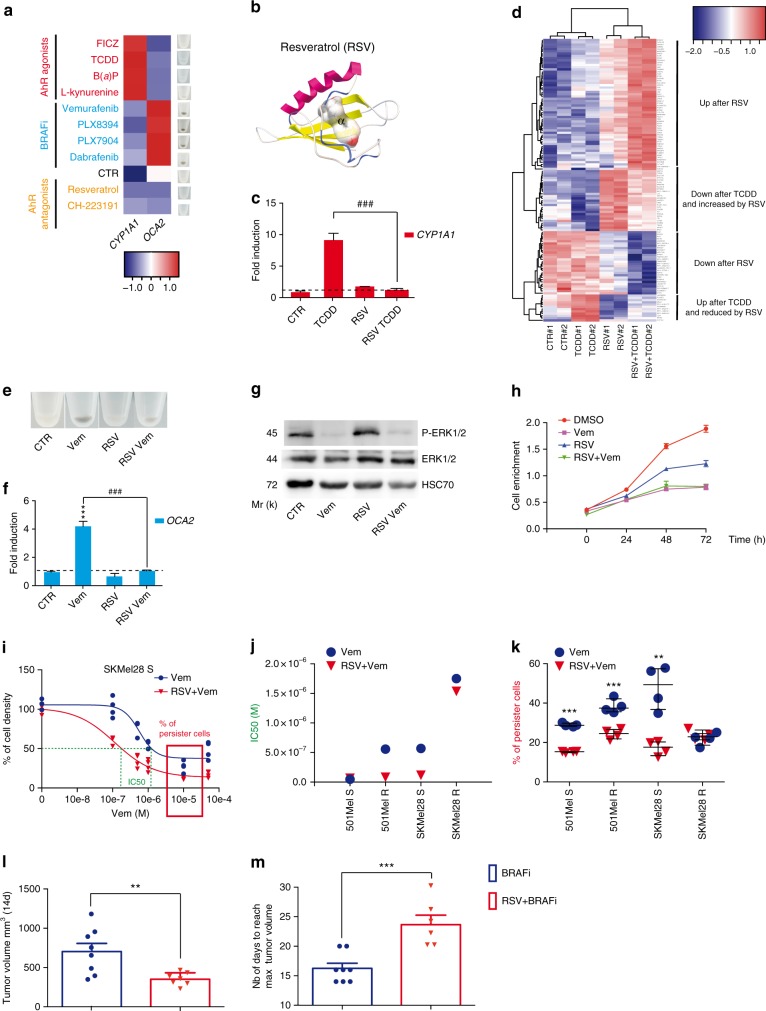
BRAF inhibitors target the BRAF-V600E/K mutated kinase, the driver mutation found in 50% of cutaneous melanoma. They give unprecedented anti-tumor responses but acquisition of resistance ultimately limits their clinical benefit. The master regulators driving the expression of resistance-genes remain poorly understood. Here, we demonstrate that the Aryl hydrocarbon Receptor (AhR) transcription factor is constitutively activated in a subset of melanoma cells, promoting the dedifferentiation of melanoma cells and the expression of BRAFi-resistance genes. Typically, under BRAFi pressure, death of BRAFi-sensitive cells leads to an enrichment of a small subpopulation of AhR-activated and BRAFi-persister cells, responsible for relapse. Also, differentiated and BRAFi-sensitive cells can be redirected towards an AhR-dependent resistant program using AhR agonists. We thus identify Resveratrol, a clinically compatible AhR-antagonist that abrogates deleterious AhR sustained-activation. Combined with BRAFi, Resveratrol reduces the number of BRAFi-resistant cells and delays tumor growth. We thus propose AhR-impairment as a strategy to overcome melanoma resistance.


Conflict of interest statement

The authors declare no competing interests.

Figures

Fig. 1
Fig. 1
BRAF-V600E inhibitor Vemurafenib binds to AhR and antagonizes the canonical AhR signaling pathway. a Competitive binding of FICZ or Vemurafenib (Vem) to AhR. Hepatic cytosol containing AhR was incubated with [3H]TCDD in the presence of DMSO (1%) or increasing concentrations of FICZ (10−10–10−7 mol/L−1) and Vem (PLX4032, 10−7–10−5 mol/L−1). b AhR nuclear translocation in response to Vem (1 µM) or TCDD (10 nM) in MCF-7 cells. AhR in green (IHC) and nucleus staining in blue. c AhR does not dimerize with ARNT in response to Vem (1 µM), in contrast to TCDD (10 nM), in MCF-7 cells. AhR–ARNT interaction was quantified by Proximity Ligation Assay. Hoechst-stained nucleus in blue (n = 4). df Vem does not activate the canonical transcriptional AhR response, in contrast to TCDD. d Evaluation of AhR transcriptional activity related to AhR/ARNT binding sites (XRE) using p3XRE-luciferase constructs. MCF-7 cells were exposed to 10 nM TCDD or 1 μM Vem or vehicle (DMSO) for 6 h. e Vem does not induce CYP1A1 mRNA, in contrast to TCDD. MCF-7 cells were incubated in the absence or presence of 10 nM TCDD or 1 μM Vem for 15 h. f Vem does not induce EROD activity in contrast to TCDD. MCF-7 cells were either untreated or treated with 10 nM TCDD or 1 μM Vem for 6 h. g Proposed binding mode of TCDD, FICZ, and Vemurafenib (Vem) into the AhR PAS-B ligand binding domain homology model. Free binding energy is reported in Supplementary Table 1. The two predictive ligand binding pockets are indicated by (α) or (β). h Gene expression profile of the 501Mel cells exposed to vehicle, Vem (1 μM) or TCDD (10 nM) (n = 2) for 48 h. Heatmap focused on differentially expressed genes in function of treatment (fold change). i Vem induces pigmentation in vitro. Picture of 501Mel cell pellets treated with Vem (1 μM) or canonical AhR agonists TCDD (10 nM) or FICZ (1 μM) for 48 h. Data correspond to the mean ± s.d. of three independent experiments. Statistical analysis was performed using an unpaired t-test (PRISM6.0®) *p < 0.05; **p < 0.01; ***p < 0.001
Fig. 2
Fig. 2
AhR signature correlates with dedifferentiation states of melanoma cell lines and resistance to BRAFi. a Expression heatmap for β- and α-signature genes in different Vem-sensitive or -resistant melanoma cell lines from the Cancer Cell Line Encyclopedia RNAseq dataset (GEO, GSE36134). IC50 values for PLX4720 were obtained from Supplementary Table 7 of ref. . Genes and clusters with similar expression profiles across the cohort are placed close to each other in the grid. b Expression heatmap for BRAFi resistance genes in different Vem-sensitive or -resistant melanoma cell lines from Cancer Cell Line Encyclopedia RNAseq dataset (GEO, GSE36134) (top) and average signatures for the α- (established by the median of expression of AhR target genes: INHBA, THBS1, RUNX2, REEP2, PMAIP1, OSMR, LRRC49, and CYP1B1), for the β- (established by the median of expression of pigmentation genes: GPR143, TYR, SLC45A2, RAB38, SNCA, MLPH, MLANA, and MITF), and for the resistance genes (AXL, GCNT1, NRP1, ZEB1, ITGA1, and LPAR1) (mid). Differentiation status for melanoma cell lines consistent with the four-stage differentiation model (melanocytic: M, transitory: T, neural crest-like: N, and undifferentiated: U) has been established for the different melanoma cell lines considering average signature from subtype genes described in supplemented files from Tsoi et al. (bottom). c Expression heatmap for β-, α-, and resistance genes signatures in the melanoma cultures dataset from the GEO dataset (GSE60664) depending on their proliferative or invasive states. Average signatures and differentiation status for melanoma cell lines have been indicated at the bottom. d PCA of melanoma cell line datasets obtained by the cluster prediction assignment (from melanoma dedifferentiation signature resource from Graeber’s lab: http://systems.crump.ucla.edu/dediff/). eg MLANA, PMAIP1, and AXL expression PCA color maps illustrating, respectively, β- (e), α- (f), and resistance signatures (g) from different subtypes of melanoma cell lines dataset from Graeber’s lab (top). Boxplots of selected β-genes (as described above) in different subtypes of melanoma cell lines (U, undifferentiated; N, neural crest-like; T, transitory; M, melanocytic) (bottom). Number in each group: U = 10, N = 14, T = 12, M = 17. Whiskers reflect median of expression with range. One-way ANOVA and Tukey’s test: ***p < 0.001, ****p < 0.0001. h Fold expression level (log2) for average β-, α-, and resistance genes signatures in different melanoma cell lines from the lab compared to the 501Mel cell line (top). Vem sensitivity has been established by cell density measurement and calculation of the IC50 (bottom) using GraphPad (PRISM6.0®) 4 days after every 2 days of treatment with an increasing concentration of Vem. Asterisk: NRAS mutant
Fig. 3
Fig. 3
In patients’ tumors, AhR signatures correlate with cell-dedifferentiation states and resistance to BRAFi. a Expression heatmap depicting mRNA expression of individual genes for pigmentation signature (blue, β signature) and AhR target genes (orange, α signature) in non-treated melanoma patient dataset from TCGA (SKCM, n = 459). b Expression heatmap depicting mRNA expression of individual genes for BRAFi resistance genes in non-treated melanoma patients dataset from TCGA (SKCM, n = 459) with high level (n = 40) or low level of expression (n = 34) for AhR. c PCA of TCGA datasets obtained by the cluster prediction assignment (melanoma dedifferentiation signature resource from the Graber lab: http://systems.crump.ucla.edu/dediff/) and pie-chart representation of the melanoma dedifferentiation subtypes. df MLANA, PMAIP1, and AXL expression PCA color maps illustrating, respectively, β- (d), α- (e), and resistance signatures (f) from the TCGA dataset (top). Boxplots of selected β-, α-, and resistance genes (as described above) in different untreated melanoma patients’ biopsies from TCGA (U, undifferentiated; N, neural crest-like; T, transitory; M, melanocytic) (bottom). Number in each group: U = 14, N = 35, T = 287, M = 118. Whiskers reflect median of expression with range. One-way ANOVA and Tukey’s test: ***p < 0.001, ****p < 0.0001. g Expression heatmap for melanoma differentiated state signatures in BRAFi-treated melanoma. h Expression heatmap for average β-, α-, and resistance signatures in BRAFi-treated single-drug (i.e., BRAFi) or double-drug (i.e., BRAFi + MEKi) melanoma patients during resistance acquiring (RNAseq dataset GEO, GSE65185). Clinical data are available from supplemental table S1 from Hugo et al.. i Schematic representation of temporal transcriptional regulation of different signatures in a melanoma patient treated with BRAFi
Fig. 4
Fig. 4
Role of AhR in melanoma cell resistance: single cell analyses. a Schematic representation of analysis of data from single cell analysis of BRAFi-resistant melanoma (19 patients). Cells from tumors of the different patients have been dissociated and individually sequenced for RNA expression (4650 cells) (RNAseq dataset, GEO, GSE72056). One filter has been included to only focus on melanoma cells expressing the MITF gene. b Expression Heatmap for genes corresponding to α- and β-signatures and depicting mRNA expression of individual genes for BRAFi resistance genes using data from single cell analysis of BRAFi-resistant melanoma (19 patients) (1056 cells). c Expression heatmap for average β-, α-, and resistance signatures (top) and melanoma differentiated state signatures using data from single cell analysis of BRAFi-resistant melanoma. d Schematic representation of analysis of data using an RNA-Seq dataset obtained from BRAFi-treated melanoma cells (from 2 patients) (from supplemented information). Cell sorting has been performed on dissociated tumors to isolate EGFR-negative or -positive cells that are able to resist BRAFis and to generate colonies after long-term treatment. e Expression heatmap for genes corresponding to individual genes (top) of α- and β-signatures and depicting mRNA expression for BRAFi resistance, average signatures (middle) and differentiated state signatures (bottom) using an RNA-Seq dataset obtained from BRAFi-treated melanoma cells. The human silhouettes have been adapted (change of color background) from Servier Medical Art, licensed under a CC BY 3.0 FR [https://smart.servier.com/smart_image/shape-29/]
Fig. 5
Fig. 5
Long-term canonical activation of AhR drives melanoma resistance to BRAFi. a Graphical representation of AhR function controlling melanoma cell sensitivity or resistance during BRAFi treatment. A high level of heterogeneity is observed among melanomas with a high proportion of highly differentiated and β-cells sensitive to BRAFi (induction of pigmentation by AhR: β signature) and a weak number of undifferentiated and α-cells resistant to BRAFi (induction of α signature and resistance genes). These persister cells constitute a cell reservoir leading to melanoma relapse. b Graphical model of AhR activation by BRAFi and α-ligands, with α-ligands dictating melanoma resistance. c Expression heatmap for resistant genes in 501Mel cells treated for 7–14 days with TCDD (10 nM). d 501 melanoma cells (501Mel) were pre-treated daily or not for 2 weeks with TCDD (10 nM) and treated 4 days with increasing concentrations of Vem in order to establish cell density measurements and calculate IC50 (sensitivity to Vem). Values, calculated with GraphPad (PRISM6.0®), represent the IC50 of Vem for control cells (without TCDD pre-treatment) or after 2 weeks of TCDD. e Expression heatmap for β-, α-, and resistance genes in 501Mel cells invalidated or not for AhR by CRISPR/Cas9 before or 48 h after treatment with Vem (1 μM). f Expression Heatmap for β-, α-, and resistance genes in 501Mel and SKMEL28 (R) cells knocked-down for AhR or ARNT using siRNA. The human silhouettes have been adapted (change of color background) from Servier Medical Art, licensed under a CC BY 3.0 FR [https://smart.servier.com/smart_image/shape-29/]
Fig. 6
Fig. 6
Therapeutic opportunity to limit BRAFi resistance. a Heatmap depicting the effects of different AhR ligands on OCA2 and CYP1A1 mRNA in 501Mel cells and pigmentation (48 h). Three groups: exo- and endo-gene ligands (TCDD, B(a)P and FICZ, L-Kynurenine, respectively), BRAFi and AhR antagonists (Resveratrol and CH-223191). b Binding model of the antagonist Resveratrol (RSV) to the PAS B of AHR. RSV is predicted to bind to the α-pocket. Free binding energy is reported in Supplementary Table 1. c RSV prevents CYP1A1 mRNA induction (48 h) by TCDD. 501Mel cells were pre-treated with 5 μM RSV 2 h before 10 nM TCDD. d Gene expression profile of 501Mel cells exposed to vehicle, TCDD (10 nM), RSV (5 μM), or RSV (5 μM) + TCDD (10 nM) (n = 2) for 48 h. Heatmap focused on differentially expressed genes as a function of treatment. eg 501Mel cells were treated with Vem (1 μM) alone or in combination with RSV (5 μM) for 48 h for pigmentation analyses (e), OCA2 mRNA expression levels (f), and phospho-ERK and ERK total detection by Western blotting (g). h 501Mel cells were pretreated for 2 h with RSV (5 μM) before Vem addition (1 μM). 501Mel cell density was evaluated by methylene blue staining followed by quantification at 620 nm (n = 2). ik Two pairs of BRAFi-sensitive (S) and -resistant (R) melanoma cells (501Mel and SKMel28) were pre-treated or not for 1 week with RSV (1 μM, every 2 days) before treatment with Vem in order to establish Vem IC50 3 days after BRAFi treatment. Values, calculated with GraphPad PRISM (i), represent IC50 of Vem for control cells (without RSV pre-treatment) or after 1 week of RSV (j). % of BRAFi-persister cell values correspond to the percentage of residual cells following 3 days of Vem (5 μM) treatment in comparison to melanoma cells without RSV treatment (k). l PDX tumor volumes 14 days after daily treatment with Dabrafenib (30 mg/kg) (n = 8) or in combination with RSV (40 mg/kg) (n = 7). m Number of days to reach max tumor volume (endpoint: >800 mm3). Values correspond to the mean ± sem. Two-tailed unpaired t test for the different treatments was performed: **p < 0.01

References

    1. Davies H. Mutations of the BRAF gene in human cancer. Nature. 2002;417:949–954. doi: 10.1038/nature00766. - DOI - PubMed
    1. Chapman PB. Improved survival with vemurafenib in melanoma with BRAF V600E mutation. N. Engl. J. Med. 2011;364:2507–2516. doi: 10.1056/NEJMoa1103782. - DOI - PMC - PubMed
    1. Wagle N, et al. Dissecting therapeutic resistance to RAF inhibition in melanoma by tumor genomic profiling. J. Clin. Oncol. 2011;29:3085–3096. doi: 10.1200/JCO.2010.33.2312. - DOI - PMC - PubMed
    1. Boussemart L, et al. Secondary tumors arising in patients undergoing BRAF inhibitor therapy exhibit increased BRAF-CRAF heterodimerization. Cancer Res. 2016;76:1476–1485. doi: 10.1158/0008-5472.CAN-15-2900-T. - DOI - PubMed
    1. Corcoran RB, Settleman J, Engelman JA. Potential therapeutic strategies to overcome acquired resistance to BRAF or MEK inhibitors in BRAF mutant cancers. Oncotarget. 2011;2:336–346. doi: 10.18632/oncotarget.262. - DOI - PMC - PubMed

Publication types

MeSH terms