. 2018 Nov 14;9(1):4782.
doi: 10.1038/s41467-018-07041-z.

Whole genome sequencing puts forward hypotheses on metastasis evolution and therapy in colorectal cancer

Affiliations

Whole genome sequencing puts forward hypotheses on metastasis evolution and therapy in colorectal cancer

Naveed Ishaque et al. Nat Commun. .

Abstract

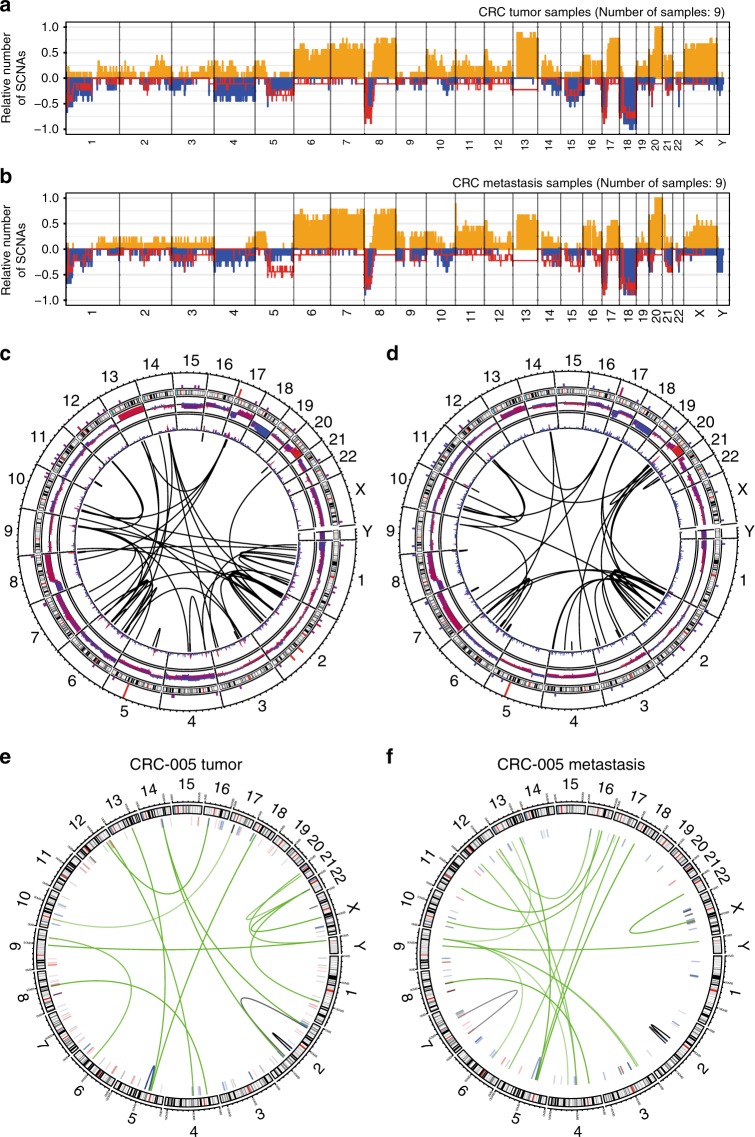
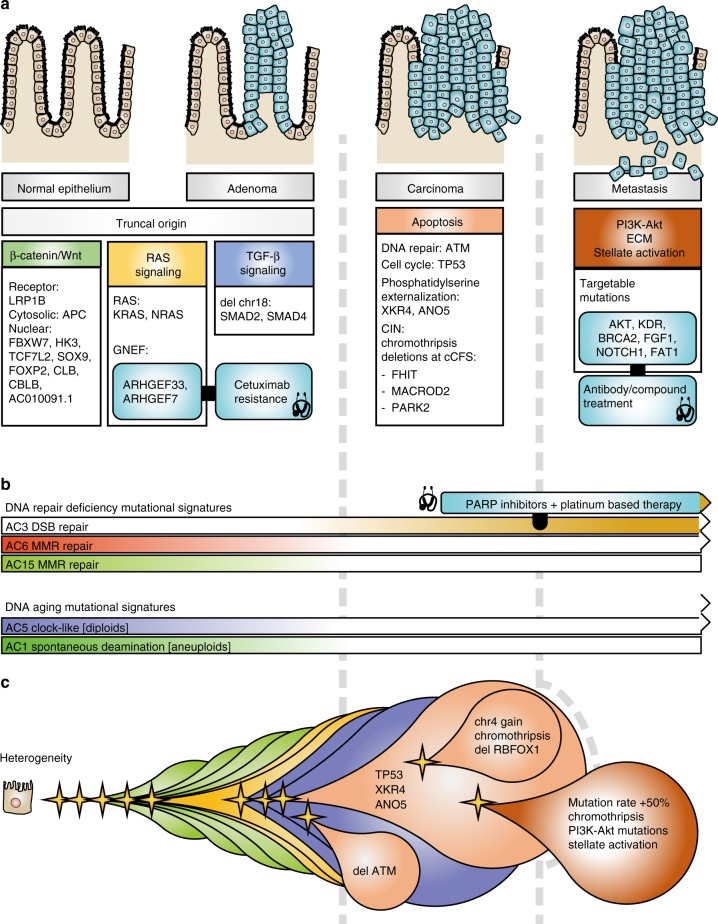
Incomplete understanding of the metastatic process hinders personalized therapy. Here we report the most comprehensive whole-genome study of colorectal metastases vs. matched primary tumors. 65% of somatic mutations originate from a common progenitor, with 15% being tumor- and 19% metastasis-specific, implicating a higher mutation rate in metastases. Tumor- and metastasis-specific mutations harbor elevated levels of BRCAness. We confirm multistage progression with new components ARHGEF7/ARHGEF33. Recurrently mutated non-coding elements include ncRNAs RP11-594N15.3, AC010091, SNHG14, 3' UTRs of FOXP2, DACH2, TRPM3, XKR4, ANO5, CBL, CBLB, the latter four potentially dual protagonists in metastasis and efferocytosis-/PD-L1 mediated immunosuppression. Actionable metastasis-specific lesions include FAT1, FGF1, BRCA2, KDR, and AKT2-, AKT3-, and PDGFRA-3' UTRs. Metastasis specific mutations are enriched in PI3K-Akt signaling, cell adhesion, ECM and hepatic stellate activation genes, suggesting genetic programs for site-specific colonization. Our results put forward hypotheses on tumor and metastasis evolution, and evidence for metastasis-specific events relevant for personalized therapy.


Conflict of interest statement

The authors declare no competing interests.

Figures

Fig. 1
Fig. 1
Recurrent somatic small mutations on protein coding genes. Oncoprint representation of recurrently mutated genes with a cutoff of 4 samples (17%). The top annotation shows the tumor cell content (TCC) and estimated tumor ploidy. The color of the box indicates the type of mutation. Recurrently mutated genes are marked with D, T, M if they were also recurrently mutated (>2.5%) in the Giannakis et al./DFCI 2016 (D), TCGA provision (T) and Yaeger et al./MSK-CC 2018 cohorts (M) via cBioPortal
Fig. 2
Fig. 2
Recurrent somatic copy number aberrations and structural variations. Relative prevalence of somatic copy number aberrations (predicted by ACEseq) in high tumor cell content (TCC) primary tumors a and metastasis b samples, showing presence of at least one copy number gain (orange bars), copy number loss (blue bars), and LOH (red line) as a proportion of analyzed samples. Circular plots of recurrent (minimum of 3) somatic structural variations (SVs) in high TCC tumors c and metastasis d samples. The panels (from outside going inwards) represent small somatic variant recurrence per gene, genomic cytobands, copy number changes (predicted by SOPHIA), and recurrent SVs within TAD regions. As an example of SV heterogeneity, we show the SV landscape for CRC-005 tumor e and metastasis f. Arcs represent translocation and inversion events
Fig. 3
Fig. 3
Chromothripsis and negative selection of highly rearranged chromosomes. Chromosome copy number predictions of six samples af, showing predicted copy number of tumor (top) and metastasis (bottom) samples. Regions of chromothripsis-like rearrangements b, c, f and highly rearranged events not present in the metastasis a, d, e, f are highlighted in dashed red boxes
Fig. 4
Fig. 4
Pathway model of colorectal cancer molecular drivers. Cartoon model (top) and oncoprints (bottom) of somatically mutated genes within colorectal progression pathways. Models and oncoprints of recurrently mutated genes within β-catenin/Wnt a, growth factor & RAS b, and apoptosis signaling c pathways. Genes were identified based on mutual exclusivity analysis and literature. Genes identified to be mutated in this study are shown in green ovals
Fig. 5
Fig. 5
Genomic landscape of tumor and metastasis mutations in patient CRC-010. Model of progression of tumor and metastasis from normal epithelial cells a, mutational signatures for tumor (dark blue), shared (red), and metastasis (dark red)-specific mutations b, structural variations in tumor c and metastasis d and copy number profiles in tumor e and metastasis f. ATM is located in the small deleted segment of chromosome 11 in the tumor sample d
Fig. 6
Fig. 6
Mutational signatures in colorectal cancer progression. Bar plot representation of absolute a, and normalized b COSMIC cancer mutational signatures within the strata of tumor-specific (dark blue), metastasis-specific (dark red) and shared (purple) somatic SNVs per patient with high tumor cell content (TCC). Unsupervised clustering of normalized exposures, with top annotation showing ploidy, estimated TCC and mutational status for TP53, KRAS, ARHGEF33, TCF7L2, and FBXW7 c. Box and whisker plot of distributions of normalized exposures between mutations that are tumor-specific (dark blue), metastasis-specific (dark red), and shared (purple) per patient d. Boxes denote the interquartile range, the middle line denotes the median, and the vertical lines outside the box denote the minimal and maximum range excluding outliers (which are 1.5 times the interquartile range)
Fig. 7
Fig. 7
Model of colorectal cancer and metastasis progression and therapeutic implications. A summary cartoon of how recurrent somatic mutations identified within this study fit into established colorectal progression models a. The top cartoons represent the transition from normal epithelial cells to metastasis (left to right). Beneath the cartoons are tables of genes and genetic lesions that were mutated in our cohort, sorted in tables related to possible pathway function. Change of relative exposure to mutational signatures are shown as horizontal bars where the strength of exposure corresponds to the strength of color in the bar, relative to tumor evolution (left to right) b. Cartoon representation of lesion (stars) accumulation giving rise to tumor heterogeneity c. Balloons are colored according to pathways, as the table headers in a, showing mutations in Wnt (green), RAS (orange), TGF-β (blue) signaling, and mutations acquired in carcinogenesis (brown), and metastasis (dark brown) formation. We show events which might not give rise to further progression. Mutations with implications on therapy decision are shown in light blue boxes with rounded corners, and linked to boxes with therapy consideration via a thick black line a, b. Gray vertical dashed lines separate out lesions corresponding to truncal origin, tumor, and metastasis states

References

    1. Hanahan D, Weinberg RA. Hallmarks of cancer: the next generation. Cell. 2011;144:646–674. doi: 10.1016/j.cell.2011.02.013. - DOI - PubMed
    1. Valastyan S, Weinberg RA. Tumor metastasis: molecular insights and evolving paradigms. Cell. 2011;147:275–292. doi: 10.1016/j.cell.2011.09.024. - DOI - PMC - PubMed
    1. Massague J, Obenauf AC. Metastatic colonization by circulating tumour cells. Nature. 2016;529:298–306. doi: 10.1038/nature17038. - DOI - PMC - PubMed
    1. Vermaat JS, et al. Primary colorectal cancers and their subsequent hepatic metastases are genetically different: implications for selection of patients for targeted treatment. Clin. Cancer Res. 2012;18:688–699. doi: 10.1158/1078-0432.CCR-11-1965. - DOI - PubMed
    1. Cancer Genome Atlas N. Comprehensive molecular characterization of human colon and rectal cancer. Nature. 2012;487:330–337. doi: 10.1038/nature11252. - DOI - PMC - PubMed

Publication types

MeSH terms

Substances