. 2018 Nov 14;9(1):4784.
doi: 10.1038/s41467-018-07283-x.

Microfluidic active loading of single cells enables analysis of complex clinical specimens

Affiliations

Microfluidic active loading of single cells enables analysis of complex clinical specimens

Nicholas L Calistri et al. Nat Commun. .

Abstract

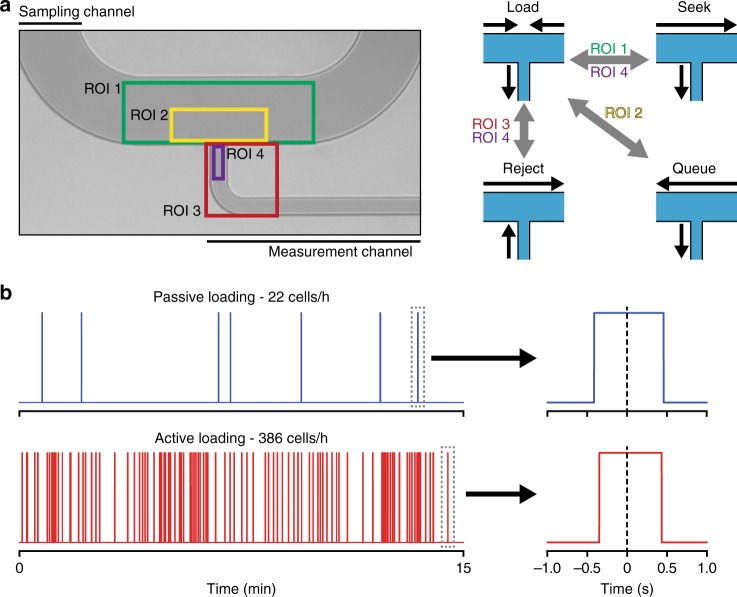
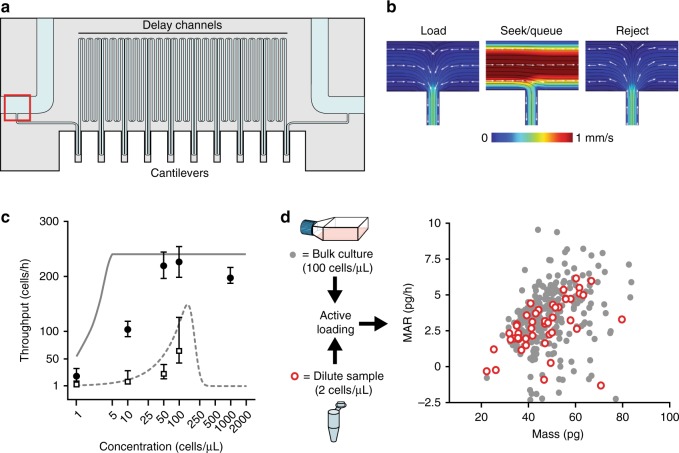
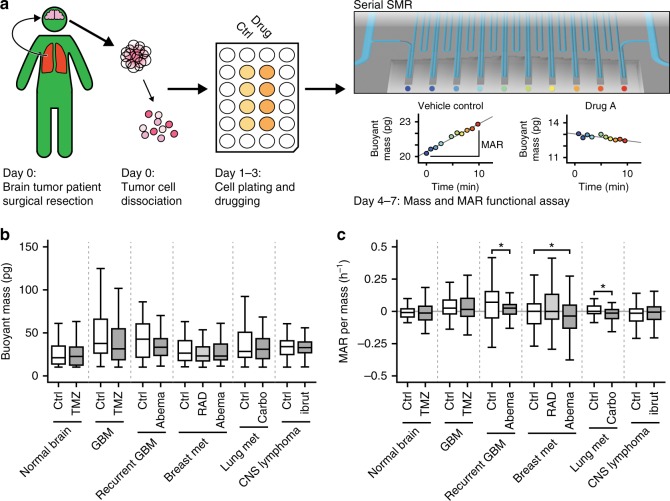
A fundamental trade-off between flow rate and measurement precision limits performance of many single-cell detection strategies, especially for applications that require biophysical measurements from living cells within complex and low-input samples. To address this, we introduce 'active loading', an automated, optically-triggered fluidic system that improves measurement throughput and robustness by controlling entry of individual cells into a measurement channel. We apply active loading to samples over a range of concentrations (1-1000 particles μL-1), demonstrate that measurement time can be decreased by up to 20-fold, and show theoretically that performance of some types of existing single-cell microfluidic devices can be improved by implementing active loading. Finally, we demonstrate how active loading improves clinical feasibility for acute, single-cell drug sensitivity measurements by deploying it to a preclinical setting where we assess patient samples from normal brain, primary and metastatic brain cancers containing a complex, difficult-to-measure mixture of confounding biological debris.


Conflict of interest statement

R.J.K., M.M.S, S.O., K.L.L., and S.R.M. are founders of Travera. S.R.M. is a founder of Affinity Biosensors. M.T. reports an advisory board role for Agios Pharmaceutical and Taiho Oncology, outside the submitted work, and travel grants from Merck Sharp & Dohme, outside the submitted work. The other authors declare no competing interests.

Figures

Fig. 1
Fig. 1
Schematic of active loading by optically triggered fluidic state switching. a Regions of interest (ROIs) are labeled as colored boxes. ROI 1 (green) is used to detect particles when in the “seek” state. Detection of a particle at traveling at a high flow rate in the sampling channel by ROI 1 causes a temporary change to the default “load” state, and reverts following entrance of a single particle into the measurement channel as detected by ROI 4 (purple). ROI 2 (yellow) maintains the presence of a single particle in the sampling channel for the next loading duty cycle. As a single particle is detected by ROI 2 while in the “load” state it triggers adoption of a “queue” state, which bumps the cell back in the sampling channel before reverting to the “load” state. This continues until the duty cycle is complete. ROI 4 (purple) and ROI 3 (red) work together to detect entrance into the measurement channel and the presence of debris or doublet events, respectively. Once ROI 4 detects entrance of a particle in the “load” state, ROI 3 quickly images the event, switching to the “reject” state if the particles geometry or contrast is outside previously set parameters defining an unwanted particle. b Comparison between passive throughput (22 cells h−1, 95% CI: 13, 39, n = 9) and active loading (386 cells h−1, 95% CI: 354, 433, n = 247) for murine L1210 cells (50 μL−1) flowing through a transit time detector in the measurement channel (Supplementary Fig. 1, see Methods). Zoom-in plots show passage of a single cell with a predefined transit time of ~800 ms
Fig. 2
Fig. 2
Active loading enables single-cell growth measurements of dilute samples. a Schematic of the serial suspended microchannel resonator (sSMR). Sampling channels on either side of the device (100 μm wide and 30 μm deep) are each accessed via two ports with independent pressure control to achieve the fluidic states presented in b. These sample channels are connected with a serpentine channel (50 cm long, 20 μm wide, and 25 μm high) with 10–12 SMR mass sensors spaced evenly along its length. Mass accumulation rate (MAR) is calculated by taking the slope of the linear least squares fit of mass measurements collected from individual SMRs as a function of time for each single-cell trajectory. b COMSOL models demonstrating the flow characteristics of the four different fluidic states presented in Fig. 1a. The model shows the T-junction entrance of the sSMR, outlined with a red box in a. Flow patterns were modeled using the volumetric flow rates described in Supplementary Note 4 to recapitulate experimental conditions. c Comparison of theoretical throughput limits (solid and dashed lines for active and passive loading, respectively) with experimental results (solid points and open squares for active and passive loading, respectively) for samples with 1, 10, 50, 100, and 1000 L1210 cells μL−1 (n = 15, 105, 143, 149, and 83 for active loading and n = 1, 8, 64, 87, and 309 for passive loading) collected with a 15 s minimum spacing. The theoretical model is based on a 15 s duty cycle (Supplementary Note 4). Measurement error bars represent the 95% CI (two-tailed t test) of loading period (s) converted to throughput (events h−1). Each concentration was measured continuously for at least 20 min. The passive loading sample at 1000 cells μL−1 had a throughput of 747 cells h−1, 95% CI: 673, 832. d Dot plot of MAR vs. mass comparing L1210 cells measured from standard, growth-phase culture concentrations (100 cells μL−1, gray circles, n = 426), or from samples with low concentration and low total cell count (~2 cells μL−1, 100 total cells, open red circles, n = 47)
Fig. 3
Fig. 3
Ex vivo drug sensitivity testing of patient resections. a Sample processing pipeline for sSMR measurement with active loading. Tumor cells were isolated from patient resection specimens using established protocols (see Methods, Supplementary Note 7) for dissociation into single-cell suspension and allowed to recover for at least 24 h before the addition of drug or vehicle control. On subsequent days, the buoyant mass and MAR were measured for both the control and drug-treated fractions. b Tukey's box plot showing the buoyant mass measurements for primary biopsies of different brain lesions. From left to right, number of cells measured: n = 86, 90, 63, 64, 66, 83, 74, 60, 47, 53, 54, 164, and 188. c Tukey's box plot showing mass-normalized MAR values from the same primary tissue samples shown in b. Statistically significant reductions in MAR per mass (*p < 0.05 in highlighted segments) were observed for the recurrent glioblastoma treated with 1 μM abemaciclib for 72 h (p = 0.032), breast metastasis treated with 100 nM abemaciclib (p = 0.029), and lung metastasis treated with 100 μM carboplatin (p = 0.025). All other drug-control comparisons did not show a statistically significant response. Additional information about the handling of each primary sample can be found in Supplementary Note 7 and exact p values can be found in Supplementary Notes 9–14. For both b, c, the center line shows median value, hinges represent the first and third quartiles, and whiskers extend to the furthest value <1.5× IQR from hinge

References

    1. Dochow S, et al. Tumour cell identification by means of Raman spectroscopy in combination with optical traps and microfluidic environments. Lab Chip. 2011;11:1484–1490. doi: 10.1039/c0lc00612b. - DOI - PubMed
    1. George TC, et al. Distinguishing modes of cell death using the ImageStream multispectral imaging flow cytometer. Cytom. Part A. 2004;59:237–245. doi: 10.1002/cyto.a.20048. - DOI - PubMed
    1. Byun S, et al. Characterizing deformability and surface friction of cancer cells. Proc. Natl. Acad. Sci. USA. 2013;110:7580–7585. doi: 10.1073/pnas.1218806110. - DOI - PMC - PubMed
    1. Gossett DR, et al. Hydrodynamic stretching of single cells for large population mechanical phenotyping. Proc. Natl. Acad. Sci. USA. 2012;109:7630–7635. doi: 10.1073/pnas.1200107109. - DOI - PMC - PubMed
    1. Guck J, et al. The optical stretcher: a novel laser tool to micromanipulate cells. Biophys. J. 2001;81:767–784. doi: 10.1016/S0006-3495(01)75740-2. - DOI - PMC - PubMed

Publication types