. 2018 Nov 14;9(1):4776.
doi: 10.1038/s41467-018-07251-5.

An E2-ubiquitin thioester-driven approach to identify substrates modified with ubiquitin and ubiquitin-like molecules

Affiliations

An E2-ubiquitin thioester-driven approach to identify substrates modified with ubiquitin and ubiquitin-like molecules

Gábor Bakos et al. Nat Commun. .

Abstract

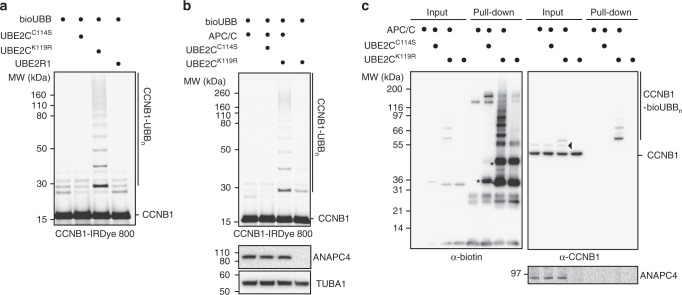
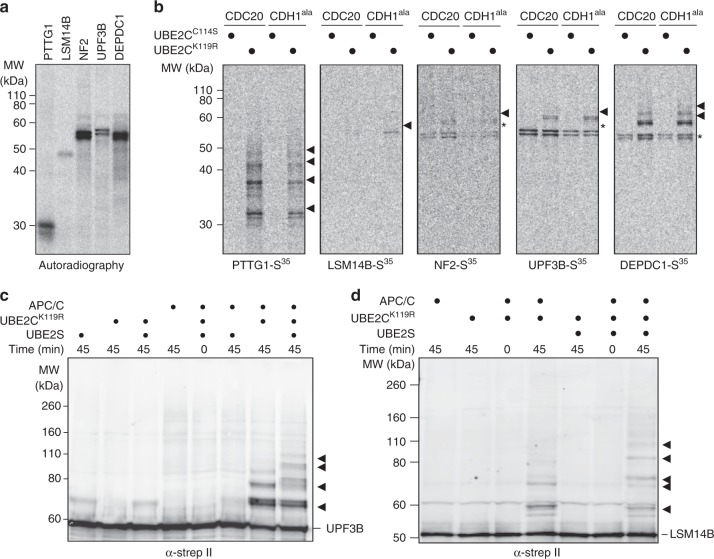
Covalent modifications of proteins with ubiquitin and ubiquitin-like molecules are instrumental to many biological processes. However, identifying the E3 ligase responsible for these modifications remains a major bottleneck in ubiquitin research. Here, we present an E2-thioester-driven identification (E2~dID) method for the targeted identification of substrates of specific E2 and E3 enzyme pairs. E2~dID exploits the central position of E2-conjugating enzymes in the ubiquitination cascade and provides in vitro generated biotinylated E2~ubiquitin thioester conjugates as the sole source for ubiquitination in extracts. This enables purification and mass spectrometry-based identification of modified proteins under stringent conditions independently of the biological source of the extract. We demonstrate the sensitivity and specificity of E2-dID by identifying and validating substrates of APC/C in human cells. Finally, we perform E2~dID with SUMO in S. cerevisiae, showing that this approach can be easily adapted to other ubiquitin-like modifiers and experimental models.


Conflict of interest statement

The authors declare no competing interests.

Figures

Fig. 1
Fig. 1
Principle of E2~dID. a Schematic representation of the E2~dID technique: (1) In vitro generation of E2~modifier conjugates (charging reaction) using biotinylated UBB or UBLs. (2) Cell or tissue extracts are treated with the indicated chemicals to inactivate the endogenous cysteine-dependent ubiquitin and UBL enzymes. To reveal E3-specific substrates extracts with active E3 (2b) or inactive E3 (2b) are prepared. (3) Charging reaction and extracts are combined to initiate modifications in extracto. (4) Modified proteins are purified under denaturing conditions through the biotinylated modifier. (5) Analyses of purified proteins, e.g. by Western blot or mass spectrometry. b Representative (n = 4) Western blot analysis of E2~dID-dependent labeling of APC/C substrates in extracts with the indicated antibodies (Supplementary Data 7). Note, that ubiquitination of proteins in the extracts depends on the presence of E2~bioUBB conjugates (UBE2C) and ANAPC4 in the extract (compare  ± APC/C)
Fig. 2
Fig. 2
E2~dID is E2- and E3-specific. a Representative (n = 4) SDS-PAGE and fluorescent scanning showing E2~dID in extracts supplied with an IRDye labeled N-terminal fragment of CCNB1. The APC/C-specific E2-conjugating enzyme UBE2CK119R, but not inactive UBE2CC114S or the unrelated UBE2R1 supports ubiquitination of the APC/C substrate CCNB1. b Representative (n = 4) E2~dID analysis as in (a) comparing extracts with active E3 and extracts where the APC/C subunit ANAPC4 has been efficiently immuno-depleted as judged by Western blot analysis. c Representative (n = 3) E2~dID analysis as in (b) followed by purification of bioUBB-modified proteins using NeutrAvidin beads and subsequent Western blot analysis. Both total protein ubiquitination (left panel) and specific CCNB1 ubiquitination (right panel) require active UBE2CK119R and APC/C. Note, CCNB1 species modified with endogenous ubiquitin are present in mitotic extracts when APC/C is present (arrowhead). Asterisks indicate auto-ubiquitinated species of UBE2CK119R
Fig. 3
Fig. 3
Performance of E2~dID with ubiquitin and APC/C. a Heat map showing scaled TMT abundances of two independent E2~dID experiments with bioUBB and APC/C performed as shown in Fig. 2c. Only substrates that displayed an at least 2-fold enrichment (E2~bioUBB/– APC/C > 2) are indicated by gene names and are ordered from top to bottom with decreasing enrichment. Italics, known APC/C substrates; underlined, APC/C subunits and regulatory interactors; bold, candidate substrates revealed by E2~dID; asterisks mark candidates selected for further validation. b Schematic representation of cell synchronization, APC/C inactivation and sample preparation for diGly MS/MS. (c) Representative Western blot (n = 3) of cell extracts prepared from − NAA treated ( + ANAPC4) and  +  NAA treated (− ANAPC4) cells. d Quantification of the data shown in (c). Bars indicate the mean ± s.e.m. of three independent experiments. e Box plot analysis of three independent diGly MS/MS experiments, showing changes in the abundance of ubiquitinated peptides in the presence or absence of APC/C of the total ubiquitinome (left), E2~dID candidates (middle) and curated APC/C substrates (right). Box plots show the median, first and third quartiles and whiskers extend to the smallest or the largest value no more than 1.5-fold of the inter-quartile range. Significance according to the Wilcoxon rank sum test
Fig. 4
Fig. 4
Functional validation of APC/C substrates identified by E2~dID. a Representative Western blot analysis (n = 2) of mitotic release samples using the indicated antibodies. HeLa cells were synchronized in prometaphase with 245 nm taxol (see Methods), collected by mitotic shake-off, washed and released into fresh media containing 10 µm ZM447439. The time-depended decrease in the levels of mitotic markers H3 (pS10), APC/C substrates PTTG1, CCNB1, and AURKB indicate APC/C activation. Arrows indicate phosphorylated ANAPC3. b Scatter plot showing the fold-change in lysine ubiquitination in response to ANAPC4 depletion for early APC/C substrates and E2~dID candidates selected for further analyses. Each “K” represents the fold-change (log2) of a ubiquitinated peptide identified from the indicated proteins. The color gradient from blue (no change) to red (negative change) illustrates the fold-change in the abundance of identified ubiquitinated peptides. c Representative Western blot analysis (n = 2) of a mitotic release for the indicated time-points in the presence ( + ANAPC4) and absence (− ANAPC4) of APC/C activity as described in Fig. 3b, but without the addition of MG132. Note, inhibiting CDK1 by RO3306 is required to allow mitotic exit in absence of CCNB1 ubiquitination and degradation. Quantification of CCNB1, AURKB, and SGO2 levels present the mean ± s.e.m. from two independent experiments with each three technical replicates. d Representative Western blot analysis (n = 3) of control and ANAPC3 immunoprecipitations from G2-phase (G2) and prometaphase (PM)- synchronized cell extracts showing the interaction of SGO2 and ESPL1 with APC/C. Arrows indicate phosphorylated ANAPC3, while the lower band is derived from prior ANAPC4 detection
Fig. 5
Fig. 5
UPF3B and LSM14B are substrates of APC/C in vitro. a Representative (n = 7) autoradiography of methionine S35-labelled APC/C candidate substrates used for subsequent E2~dID experiments expressed by coupled in vitro transcription/translation in reticulocytes. b Representative (n = 4) autoradiography of NeutrAvidin-purified proteins from of E2~dID reactions using CDC20 or FZR1-enriched extracts (see Supplementary Fig. 5a) containing active UBE2CK119R or inactive UBE2CC114S as well as radiolabeled candidates shown in a. Arrowheads indicate bioUBB-modified substrates and asterisks co-purified unmodified substrates. c Representative Western blot analysis (n = 3) of an in vitro APC/C activity assay with purified components using strep II-tagged UPF3B as a substrate. d Representative Western blot analysis (n = 3) as in c using strep II-tagged LSM14B as a substrate. Note, the addition of ubiquitin chain-elongating UBE2S results in higher molecular weight polyubiquitinated species of UPF3B and LSM14B
Fig. 6
Fig. 6
E2~dID with SUMO and Siz1/Siz2 in S. cerevisiae. a Heat map showing scaled TMT abundances of two independent E2~dID experiments with bioSmt3 and Siz1/Siz2 comparing bioSmt3 with Ubc9~bioSmt3 in wild type and siz1Δsiz2Δ extracts. Only substrates that displayed an at least 1.41-fold increase (E2~bioSmt3/siz1Δsiz2Δ  > 1.41) are indicated by gene names and are ordered from top to bottom according to their fold decrease. Italics, known Siz1 and Siz2 substrates; underlined, Siz ligase subunits; bold, candidate substrates revealed by E2~dID; asterisks mark candidates selected for further validation. b Representative Western blot (n = 3) analysis of HA immunoprecipitates from WT and Δsiz1Δsiz2 strains expressing HA-tagged Def1 protein from its endogenous locus

References

    1. Stark C, et al. BioGRID: a general repository for interaction datasets. Nucleic Acids Res. 2006;34:D535–D539. doi: 10.1093/nar/gkj109. - DOI - PMC - PubMed
    1. Baptista MS, Duarte CB, Maciel P. Role of the ubiquitin-proteasome system in nervous system function and disease: using C. elegans as a dissecting tool. Cell. Mol. Life Sci. 2012;69:2691–2715. doi: 10.1007/s00018-012-0946-0. - DOI - PMC - PubMed
    1. Borg NA, Dixit VM. Ubiquitin in cell-cycle regulation and dysregulation in cancer. Annu. Rev. Cancer Biol. 2017;1:59–77. doi: 10.1146/annurev-cancerbio-040716-075607. - DOI
    1. Hershko A, Ciechanover A. The ubiquitin system. Annu. Rev. Biochem. 1998;67:425–479. doi: 10.1146/annurev.biochem.67.1.425. - DOI - PubMed
    1. Petroski MD, Deshaies RJ. Function and regulation of cullin-RING ubiquitin ligases. Nat. Rev. Mol. Cell Biol. 2005;6:9–20. doi: 10.1038/nrm1547. - DOI - PubMed

Publication types

MeSH terms