

Improving visualization and quantitative assessment of choriocapillaris with swept source OCTA through registration and averaging applicable to clinical systems
- PMID: 30429502
- PMCID: PMC6235855
- DOI: 10.1038/s41598-018-34826-5
Improving visualization and quantitative assessment of choriocapillaris with swept source OCTA through registration and averaging applicable to clinical systems
Abstract
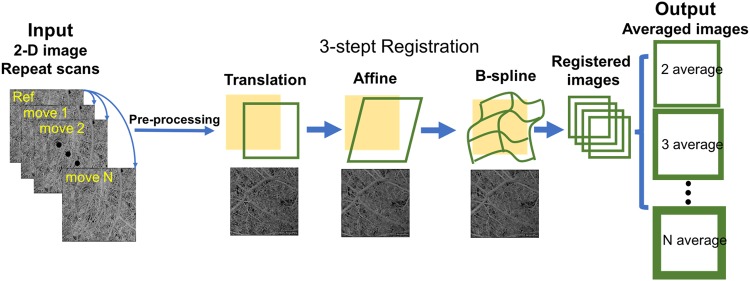
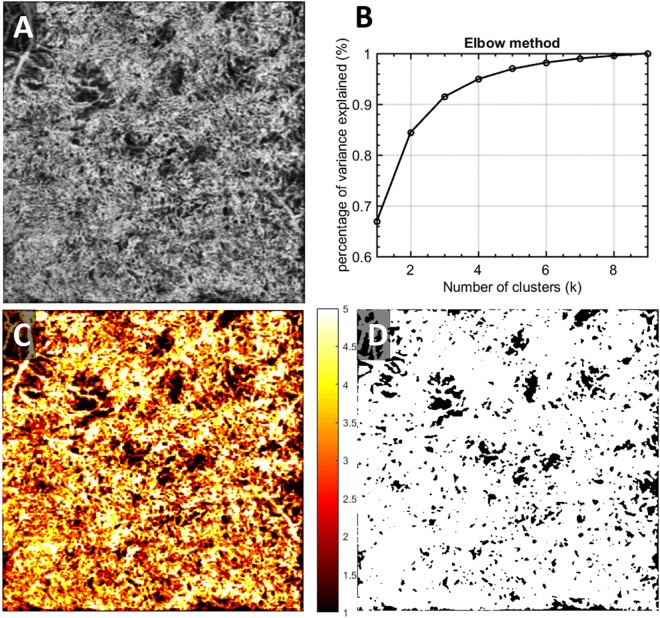
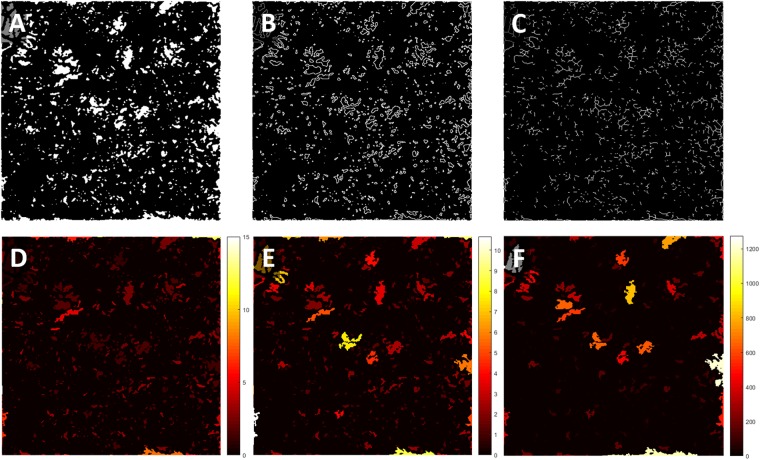
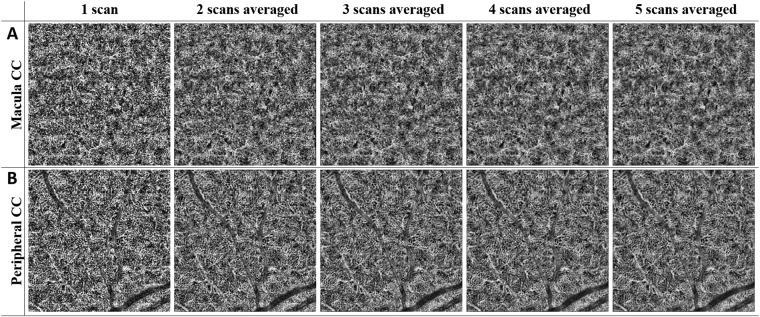
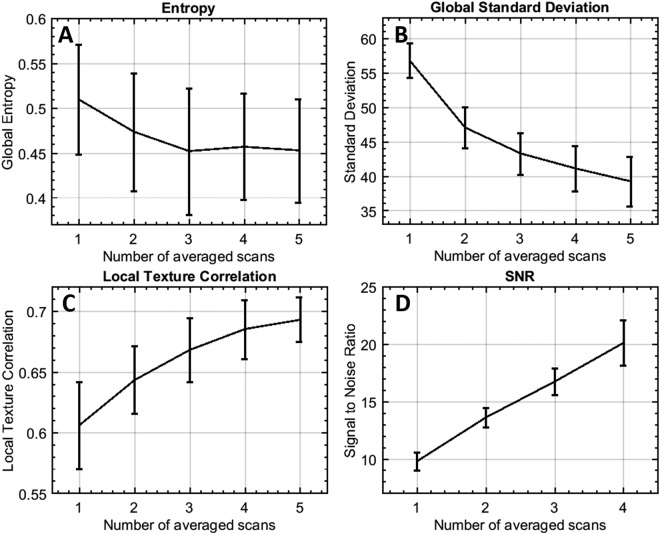
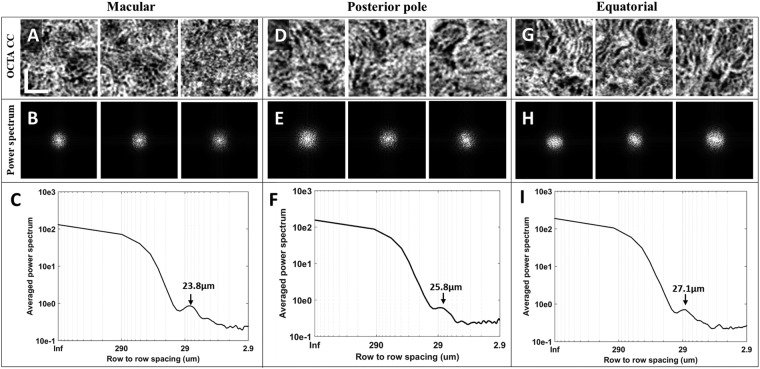
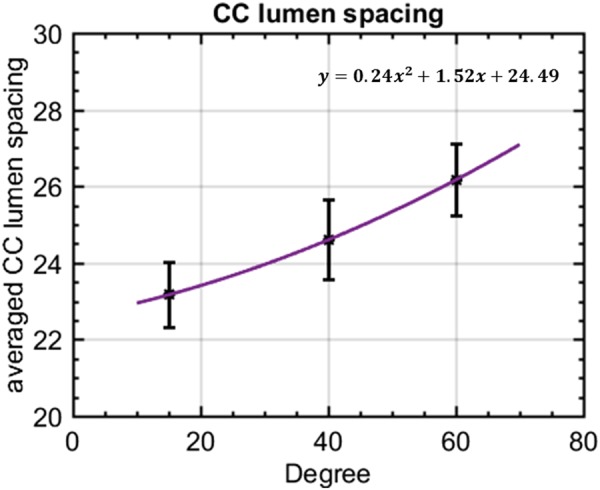
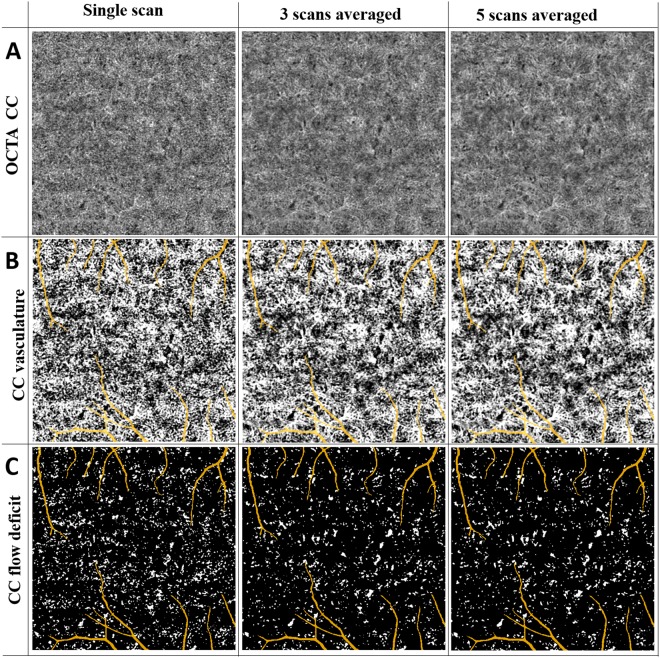
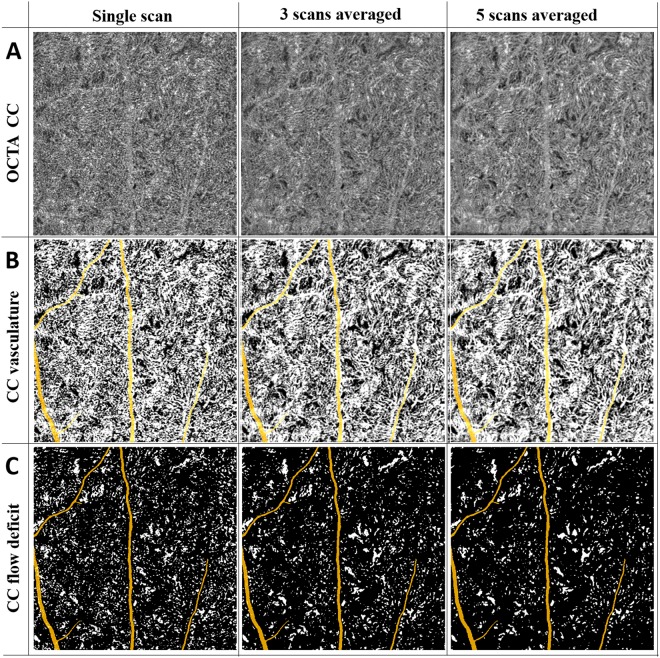
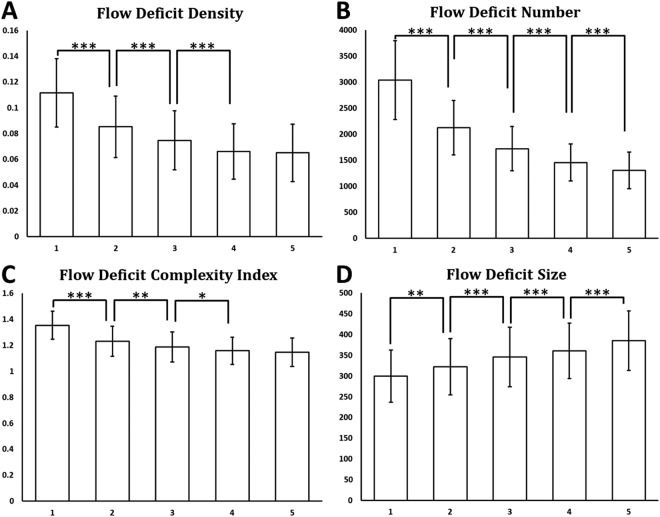
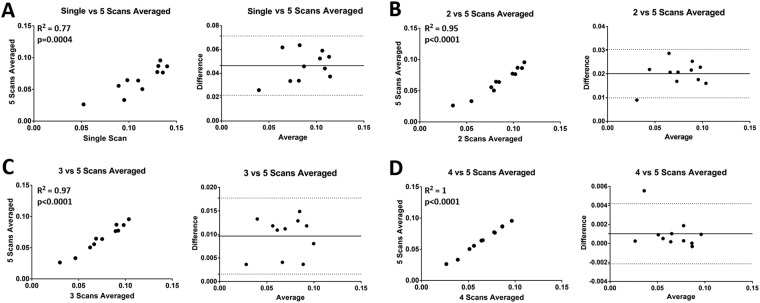
Choriocapillaris (CC) visualization and quantification remains challenging. We propose an innovative three-step registration and averaging approach using repeated swept source optical coherence tomography angiography (SS-OCTA) scans to conduct automatic quantitative assessment on CC. Six subjects were enrolled, each imaged at several locations with SS-OCTA from macular to equatorial regions using 3 mm × 3 mm scanning pattern. Five repeated volumes were collected for each subject. The complex optical microangiography (OMAG) algorithm was applied to identify blood flow in CC slab. An automatic three-step registration of translation, affine and B-Spline was applied to en face OCTA images of CC, followed with averaging. A fuzzy clustering approach was used to segment vasculature and flow deficits from the averaged images. The improvement in visualization of CC was evaluated and the average intercapillary distance was estimated by calculating the averaged capillary lumen spacing. A series of quantitative indices of flow deficit density, number, size, complexity index and aspect ratio index (FDD, FDN, FDS, FDCI and FDARI) were designed and validated with the increase of repeated scan numbers for averaging. Quantitative assessment was applied and compared on CC in macular and equatorial regions. The intercapillary distance was observed to be around 24 µm at macula and increased toward equatorial regions. All five quantitative indices (FDD, FDN, FDS, FDCI and FDARI) showed significant changes with multiple averaging and tend to become stable with repeated number of 4. Our proposed registration and averaging algorithm significantly improved the visualization of CC with SS-OCTA. The designed five indices for CC provide more options in the quantitative assessment of CC and are of great potentials in assisting the understanding of disease pathology, early diagnosis and treatment monitoring.
Conflict of interest statement
R.K.W. received research support from Carl Zeiss Meditec Inc. R.K.W. received an innovative research award from Research to Prevent Blindness. R.K.W. discloses intellectual property owned by the Oregon Health and Science University and the University of Washington related to OCT angiography, and licensed to commercial entities, related to the technology and analysis methods described in parts of this manuscript. R.K.W. is a consultant to Carl Zeiss Meditec, and Insight Photonic Solutions. Z.C., H.Z., Y.C. and Q.Z. declare no potential conflict of interest.
Figures
Similar articles
-
Accurate estimation of choriocapillaris flow deficits beyond normal intercapillary spacing with swept source OCT angiography.Quant Imaging Med Surg. 2018 Aug;8(7):658-666. doi: 10.21037/qims.2018.08.10. Quant Imaging Med Surg. 2018. PMID: 30211033 Free PMC article.
-
Quantitative assessment of the retinal microvasculature and choriocapillaris in myopic patients using swept-source optical coherence tomography angiography.Graefes Arch Clin Exp Ophthalmol. 2020 Jun;258(6):1173-1180. doi: 10.1007/s00417-020-04639-2. Epub 2020 Mar 6. Graefes Arch Clin Exp Ophthalmol. 2020. PMID: 32144487
-
Choriocapillaris Imaging Using Multiple En Face Optical Coherence Tomography Angiography Image Averaging.JAMA Ophthalmol. 2017 Nov 1;135(11):1197-1204. doi: 10.1001/jamaophthalmol.2017.3904. JAMA Ophthalmol. 2017. PMID: 28983552 Free PMC article.
-
Guidelines for Imaging the Choriocapillaris Using OCT Angiography.Am J Ophthalmol. 2021 Feb;222:92-101. doi: 10.1016/j.ajo.2020.08.045. Epub 2020 Sep 4. Am J Ophthalmol. 2021. PMID: 32891694 Free PMC article. Review.
-
Optical Coherence Tomography Angiography Offers New Insights into Choriocapillaris Perfusion.Ophthalmologica. 2018;239(2-3):74-84. doi: 10.1159/000485261. Epub 2018 Jan 19. Ophthalmologica. 2018. PMID: 29353272 Review.
Cited by
-
Robust three-dimensional registration on optical coherence tomography angiography for speckle reduction and visualization.Quant Imaging Med Surg. 2021 Mar;11(3):879-894. doi: 10.21037/qims-20-751. Quant Imaging Med Surg. 2021. PMID: 33654662 Free PMC article.
-
Automated Quantification of Choriocapillaris Lesion Area in Patients With Posterior Uveitis.Am J Ophthalmol. 2021 Nov;231:179-193. doi: 10.1016/j.ajo.2021.06.004. Epub 2021 Jun 6. Am J Ophthalmol. 2021. PMID: 34107308 Free PMC article.
-
Optical Coherence Tomography Angiography of the Choriocapillaris in Age-Related Macular Degeneration.J Clin Med. 2021 Feb 13;10(4):751. doi: 10.3390/jcm10040751. J Clin Med. 2021. PMID: 33668537 Free PMC article. Review.
-
OCTAVA: An open-source toolbox for quantitative analysis of optical coherence tomography angiography images.PLoS One. 2021 Dec 9;16(12):e0261052. doi: 10.1371/journal.pone.0261052. eCollection 2021. PLoS One. 2021. PMID: 34882760 Free PMC article.
-
Quantitative assessment of choriocapillaris flow deficits and type 1 macular neovascularization growth in age-related macular degeneration.Sci Rep. 2023 May 26;13(1):8572. doi: 10.1038/s41598-023-35080-0. Sci Rep. 2023. PMID: 37236984 Free PMC article.
References
-
- Lutty G, Grunwald J, Majji AB, Uyama M, Yoneya S. Changes in choriocapillaris and retinal pigment epithelium in age-related macular degeneration. Mol Vis. 1999;5:35. - PubMed
Publication types
MeSH terms
Grants and funding
LinkOut - more resources
Full Text Sources
Medical
Research Materials
