. 2018 Nov;563(7731):347-353.
doi: 10.1038/s41586-018-0698-6. Epub 2018 Nov 14.

Single-cell reconstruction of the early maternal-fetal interface in humans

Affiliations

Single-cell reconstruction of the early maternal-fetal interface in humans

Roser Vento-Tormo et al. Nature. 2018 Nov.

Abstract

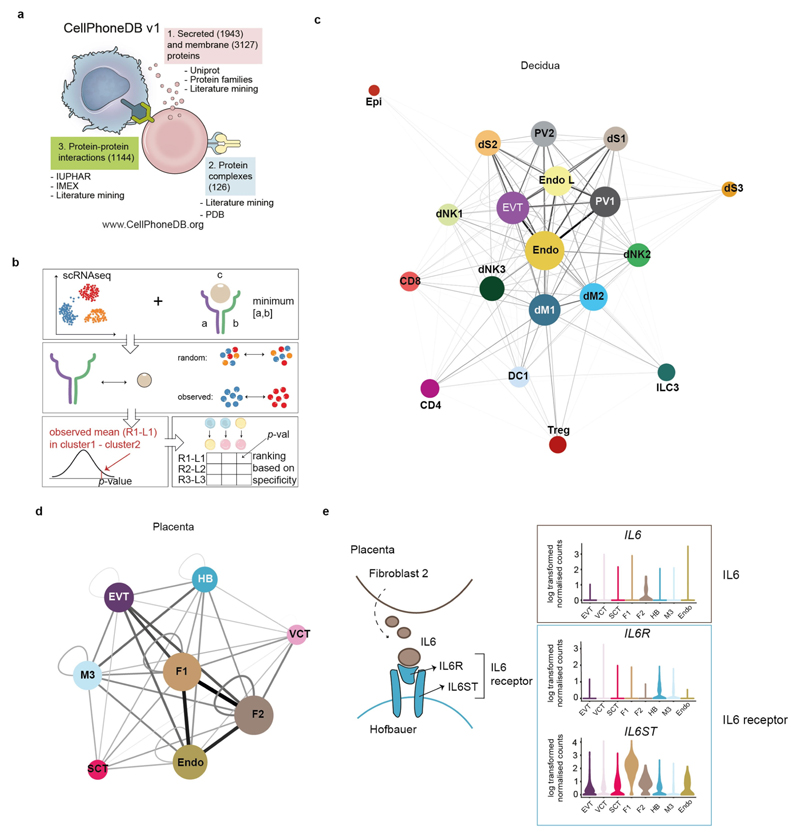
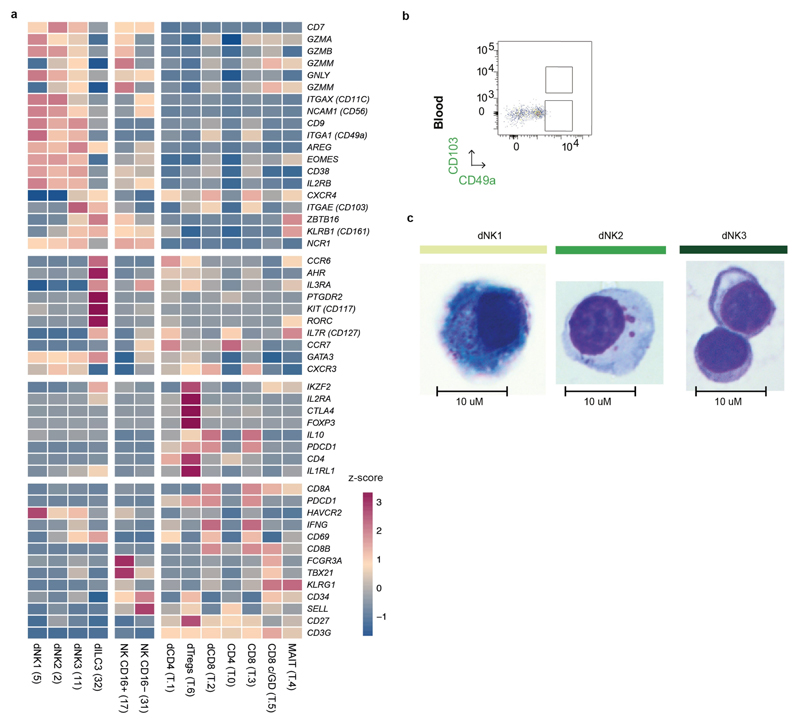
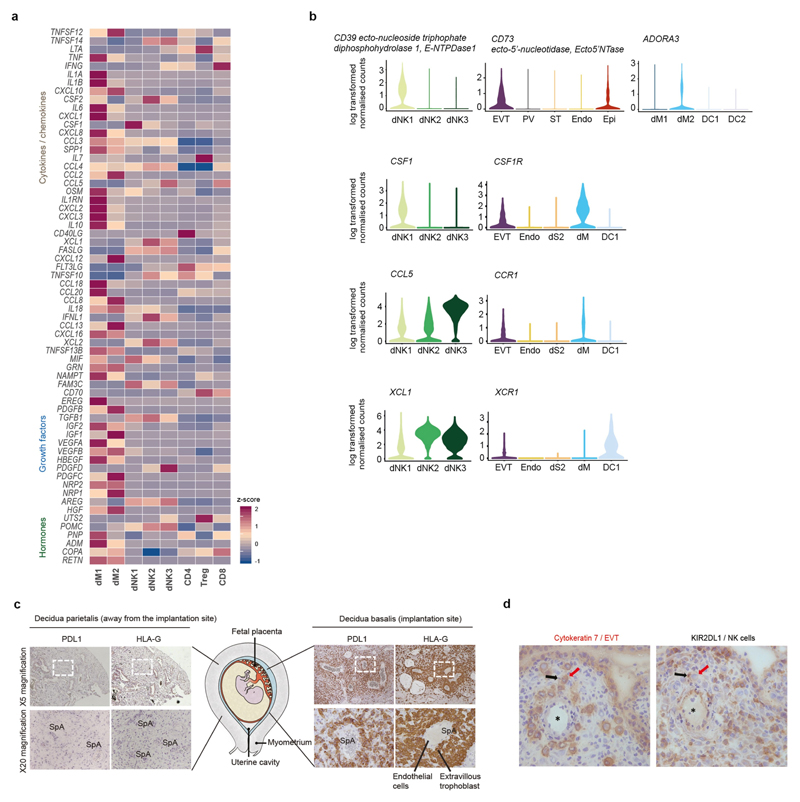
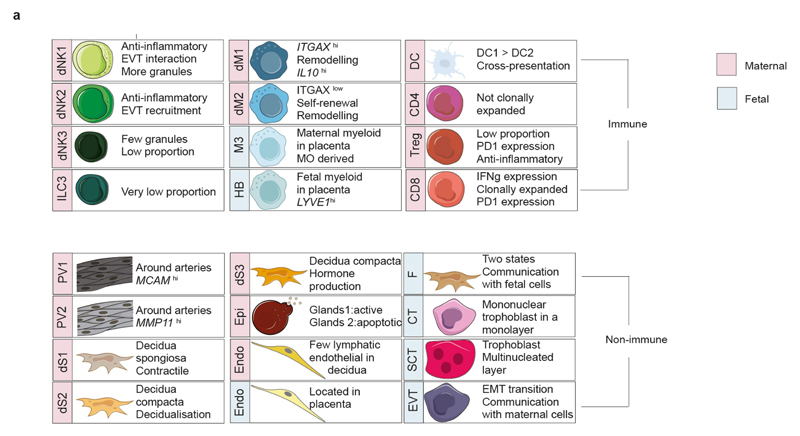
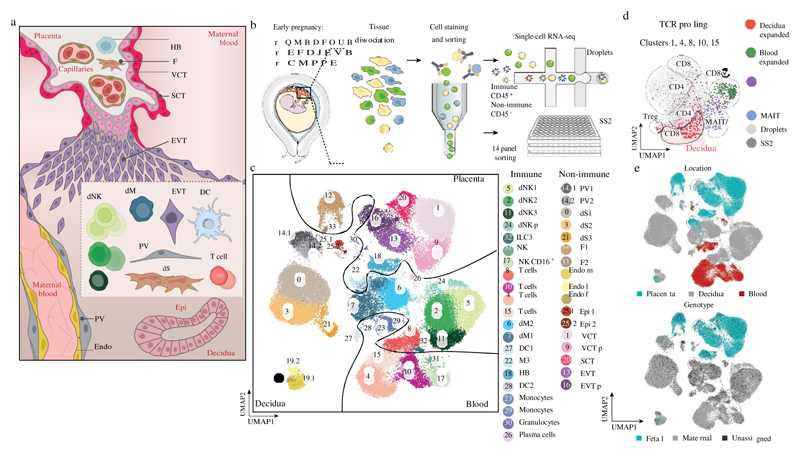
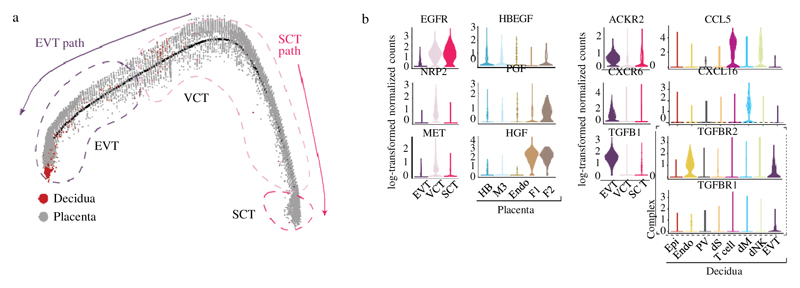
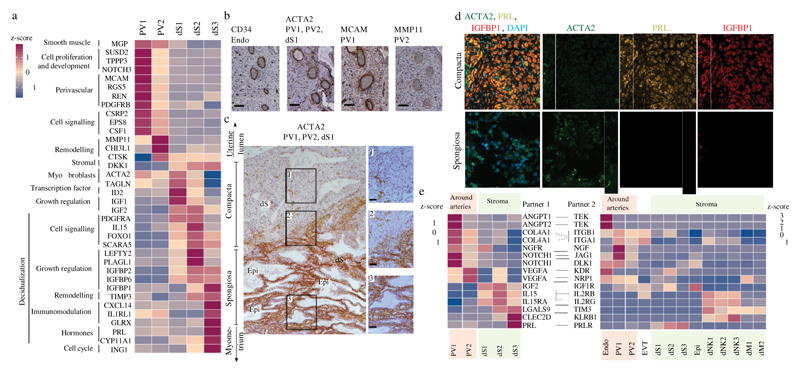
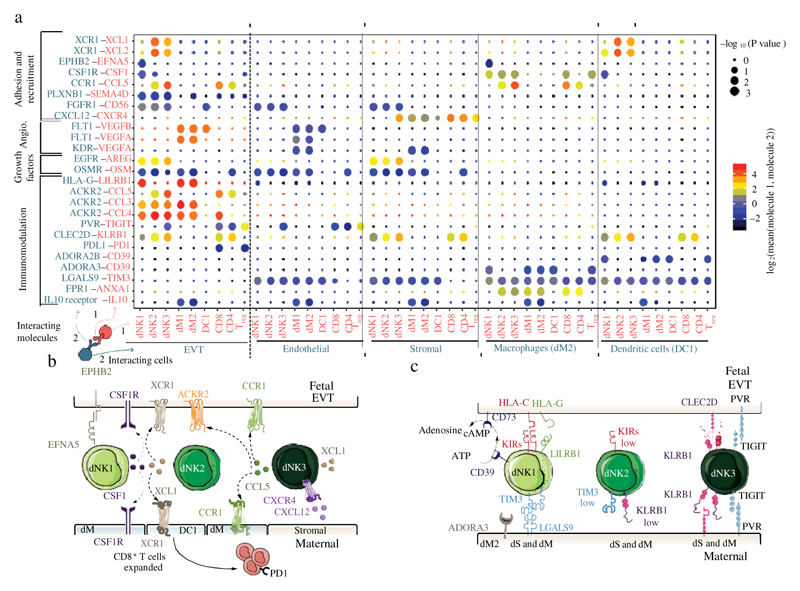
During early human pregnancy the uterine mucosa transforms into the decidua, into which the fetal placenta implants and where placental trophoblast cells intermingle and communicate with maternal cells. Trophoblast-decidual interactions underlie common diseases of pregnancy, including pre-eclampsia and stillbirth. Here we profile the transcriptomes of about 70,000 single cells from first-trimester placentas with matched maternal blood and decidual cells. The cellular composition of human decidua reveals subsets of perivascular and stromal cells that are located in distinct decidual layers. There are three major subsets of decidual natural killer cells that have distinctive immunomodulatory and chemokine profiles. We develop a repository of ligand-receptor complexes and a statistical tool to predict the cell-type specificity of cell-cell communication via these molecular interactions. Our data identify many regulatory interactions that prevent harmful innate or adaptive immune responses in this environment. Our single-cell atlas of the maternal-fetal interface reveals the cellular organization of the decidua and placenta, and the interactions that are critical for placentation and reproductive success.


Conflict of interest statement

Competing interests The authors declare no competing interests.

Figures

Extended Data Fig. 1
Extended Data Fig. 1. Gating strategy for Smart-seq2 data.
a, Gating strategy for a panel of 14 antibodies to analyse immune cells in decidual samples by Smart-seq2 (CD3, CD4, CD8, CD9, CD14, CD16, CD19, CD20, CD34, CD45, CD56, CD94, DAPI, HLA-DR and HLA-G). Cells isolated for Smart-seq2 data were gated on live; CD19- and CD20-negative, singlets and the following cell types were sorted: (i) CD45 CD14highHLA-DRhigh; (ii) CD45 HLA-DR ; (iii) CD45 HLA-DR CD56 CD3 CD4 CD8 ; (iv) CD45 HLA-DR CD56 CD3 CD8 ; (v) CD45 HLA-DR CD56 CD3 CD4 CD8 ; (vi) CD45 HLA-DR CD3 CD56 CD94 (labelled 'all -' on the figure); (vii) CD45 HLA-DR CD3 CD56 CD94 ; (viii) autofluorescence; (ix) CD45 HLA-DR CD3 CD56 CD94 CD9 ; (x) CD45 HLA-DR CD3 CD56 CD94 CD9 ; (xi) CD45 HLA-G ; (xii) CD45 HLA-G. Sample F9 is shown as an example. Cells from different gates were sorted in different plates: myeloid cells (gates (i) and (ii)); T cells (gates (iii), (iv) and (v)); natural killer cells (gates (vi), (vii), (viii), (ix) and (x)); CD45 (gates (xi) and (xii)). Antibody information is provided in Supplementary Table 10.
Extended Data Fig. 2
Extended Data Fig. 2. Quality control of droplet and Smart-seq2 datasets.
a, Histograms show the distribution of the cells from the Smart-seq2 dataset ordered by number of detected genes and mitochondrial gene expression content. b, Histograms show the distribution of the cells from the droplet-based dataset ordered by number of detected genes and mitochondrial gene expression content. c, Total numbers of cells that passed the quality control, processed by Smart-seq2 and droplet scRNA-seq. Each row is a separate donor. d, Canonical correlation vectors (CC1 and CC2) of integrated analysis of decidual and placental cells from the Smart-seq2 (n 5 deciduas, n 2 peripheral blood samples) and droplet-based datasets (n 5 placentas, n 6 deciduas and n 4 blood samples), coloured on the basis of their assignment to clusters and the technology that was used for scRNA-seq.
Extended Data Fig. 3
Extended Data Fig. 3. Overview of droplet and Smart-seq2 datasets.
a, UMAP plot showing the integration of the Smart-seq2 and droplet-based dataset and the log-transformed expression of MKI67 (which marks proliferating cells). b, UMAP plots showing the separate and more-detailed integration analysis of the cells from cluster 14 (perivascular cells), cluster 19 (endothelial cells) and cluster 25 (epithelial cells). Clusters are labelled as in Fig. 1c. c, UMAP visualization of T cell clusters obtained by integrating Smart-seq2 and droplet-based T cells subpopulations (clusters 4, 8, 10 and 15) from Fig. 1c. Cells are coloured by the tissue of origin (top) and the identified clusters (bottom). d, Heat map showing the z-score of the mean log-transformed, normalized counts for each cluster of selected marker genes used to annotate clusters. For a more extensive set of genes, see Supplementary Table 2. Adjusted P value 0.1; Wilcoxon rank-sum test with Bonferroni correction. NK, natural killer cells; NKp, proliferating natural killer cells; MO, monocytes; Granulo, granulocytes; Treg, regulatory T cells; GD, T cells; CD8c, cytotoxic CD8 T cells; Plasma, plasma cells. e, log-likelihood differences between assignment to fetal versus assignment to maternal origin of cells, on the basis of single nucleotide polymorphism calling from the droplet RNA-seq data. Cells are coloured by their assignment as determined by demuxlet. For this figure, we used n 5 placentas, n 6 deciduas and n 4 blood individuals. f, UMAP visualization of the log-transformed, normalized expression of selected marker genes of the M3 subpopulation.
Extended Data Fig. 4
Extended Data Fig. 4. Cell–cell communication networks in the maternal–fetal interface using CellPhoneDB.
a, Information aggregated within www.CellPhoneDB.org. b, Statistical framework used to infer ligand–receptor complex specific to two cell types from single-cell transcriptomics data. Predicted P values for a ligand–receptor complex across two cell clusters are calculated using permutations, in which cells are randomly re-assigned to clusters (see Methods) c, Networks visualizing potential specific interactions in the decidua, in which nodes are clusters (cell types) and edges represent the number of significant ligand–receptor pairs. The network was created for edges with more than 30 interactions and the network layout was set to force-directed layout. Only droplet data were considered for the CellPhoneDB analysis (n 6 deciduas). d, Networks visualizing potential specific interactions in the placenta, in which nodes are clusters and edges represent the number of significant ligand–receptor pairs. The network layout was set to force-directed layout. Only droplet data were considered for the analysis (n 5 placentas). e, An example of significant interactions identified by CellPhoneDB. Violin plots show log-transformed, normalized expression levels of the components of the IL6–IL6R complex in placental cells. IL6 expression is enriched in the fibroblast 2 cluster (F2; dark brown in d) and the two subunits of the IL6 receptors (IL6R and IL6ST) are co-expressed in Hofbauer cells.
Extended Data Fig. 5
Extended Data Fig. 5. Trophoblast analysis.
a, UMAP visualization of the integrated analysis of the trophoblast subpopulations that were used for pseudotime analysis, including the enriched EPCAM and HLA-G cells (see Methods). Cells that were excluded from the pseudotime analysis are coloured in grey (n 5 placentas, n 11 deciduas). b, UMAP visualization of the log-transformed, normalized expression of selected canonical trophoblast marker genes (n 5 placentas). c, Visualization of log-transformed, normalized expression of HLA-G, MKI67 and LGALS13 across trophoblast differentiation. d, Heat map showing genes that are involved in the epithelial–mesenchymal transition, identified as varying significantly as EVT differentiate (q value 0.1, likelihood ratio test, P values were adjusted for the false discovery rate).
Extended Data Fig. 6
Extended Data Fig. 6. Steroid synthesis.
a, Heat map showing relative expression of enzymes involved in cholesterol and steroid synthesis in the three stromal subsets (n 11 deciduas). b, Multiplexed smFISH in two decidua parietalis sections from two different individuals, showing an enrichment of CYP11A1 expression in the decidua compacta. Section stained by CYP11A1, LDLR and DAPI. Images are shown at 40 magnification. A high resolution is needed to detect differences between the sections (n 2 individuals).
Extended Data Fig. 7
Extended Data Fig. 7. In situ staining for the different stromal cells.
a, Immunohistochemistry of decidual serial sections stained for cytokeratin (uterine glands), CD34 (endothelial cells), ACTA2 (perivascular populations and dS1) and IGFBP1 (stromal cells and glandular secretions) (n 2 biological replicates). ACTA2 stromal cells are confined to the stromal cells of the deeper decidua spongiosa, whereas stromal cells in the decidua compacta are ACTA2. IGFBP1 stromal cells are enriched in the decidua compacta, whereas stromal cells around the glands in the decidua spongiosa are IGFBP1. Glandular secretions are IGFBP1. b, Multiplexed smFISH for a decidua parietalis section showing the two decidual layers. ACTA2, dS1 population confined to decidua spongiosa; IGBP1 and PRL, dS2 and dS3 populations confined to decidua compacta. Samples shown are from a different individual than samples shown in Fig. 4d (n 2 biological replicates). c, Multiplexed smFISH for a decidua parietalis section showing the two decidual layers. DKK1, decidual stromal marker; ACTA2, dS1 population confined to decidua spongiosa; PRL, dS3 population confined to decidua compacta (n 1 biological replicate).
Extended Data Fig. 8
Extended Data Fig. 8. Lymphocyte populations in the decidua.
Heat map showing z-scores of the mean log-transformed, normalized expression of selected genes in the lymphocyte populations. Proliferating dNK cells (dNKp) are excluded from the analysis (n 11 deciduas). b, FACS gating strategy in Fig. 5 applied in matched blood. Matched blood for the sample shown in Fig. 5 (n 2 biological replicates). c, Morphology of dNK1, dNK2 and dNK3 subsets by Giemsa–Wright stain after cytospin (representative data from 1 of n 2 biological replicates are shown). Scale bar, 10 m.
Extended Data Fig. 9
Extended Data Fig. 9. Expression of ligands and receptors at the maternal–fetal interface.
a, Heat map showing z-scores of the mean log-transformed, normalized expression of genes annotated as cytokines, growth factors, hormones and angiogenic factors with a log-mean 0.1 in the selected decidual immune populations (n 11 deciduas). b, Violin plots showing log-transformed, normalized expression levels of selected ligands expressed in the three dNK cells and their corresponding receptors expressed on other decidual cells and EVT (CD39, CD73, ADORA3, CSF1, CSF1R, CCL5, CCR1, XCL1 and XCR1; n 11 deciduas, n 5 placentas) c, Immunohistochemistry images of serial decidual sections stained for the EVT marker HLA-G and the inhibitory ligand PDL1. Bottom panels shown the areas in white boxes in the top panels at higher power. HLA-G cells are only present at the site of placentation (decidua basalis) and are absent elsewhere (decidua parietalis). SpA, spiral arteries. The EVT is strongly PDL1. We show representative data from one individual of n 5 biological replicates. d, Immunohistochemistry images of decidual serial sections of the decidual implantation site (at 10 weeks of gestation), stained for the trophoblast cell marker, cytokeratin-7 (red arrow) and the inhibitory receptor KIR2DL1 on a natural killer cell (black arrow). The asterisk marks the lumen of a spiral artery that supplies the conceptus. We show representative data from one individual of n 5 samples).
Extended Data Fig. 10
Extended Data Fig. 10. Encyclopaedia of cells at the maternal–fetal interface.
a, Summary of populations from our scRNa-seq data. Blue, fetal; red, maternal.
Fig. 1
Fig. 1. Identification of cell types at the maternal–fetal interface.
a, Diagram illustrating the decidual-placental interface in early pregnancy. DC, dendritic cells; dM, decidual macrophages; dS, decidual stromal cells; Endo, endothelial cells; Epi, epithelial glandular cells; F, fibroblasts; HB, Hofbauer cells; PV, perivascular cells; SCT, syncytiotrophoblast; VCT, villous cytotrophoblast; EVT, extravillous trophoblast. b, Workflow for single-cell transcriptome profiling of decidua, placenta and maternal peripheral blood mononuclear cells. Numbers in parentheses indicate number of individuals analysed. c, Placental and decidual cell clusters from 10x Genomics and Smart-seq2 (SS2) scRNA-seq analysis visualized by UMAP. Colours indicate cell type or state. n 11 deciduas, n 5 placentas and n 6 blood samples. f, fetal; ILC, innate lymphocyte cells; l, lymphatic; m, maternal; p, proliferative; M3, maternal macrophages. d, UMAP visualization of T cell clonal expansion and clusters by integrating Smart-seq2 and 10x Genomics T cell data from clusters 4, 8, 10 and 15 from c. TCR, T cell receptor. MAIT, mucosal-associated invariant T cell. e, Origin of droplet cells in c by tissue (above) or genotype (below). Purple circle, maternal cells in placenta; green circle, fetal cells in decidua.
Fig. 2
Fig. 2. Ligand–receptor expression during EVT differentiation.
a, Pseudotime ordering of trophoblast cells reveals EVT and SCT pathways. Enriched EPCAM and HLA-G cells on placental and decidual isolates are included. n 11 deciduas and n 5 placentas. b, Violin plots showing log-transformed, normalized expression levels for selected ligand–receptor pairs that change during pseudotime and are predicted to be significant by CellPhoneDB (EGFR, HBEGF, NRP2, PGF, MET, HGF, ACKR2, CCL5, CXCR6, CXCL16, TGFB1, TGFBR2 and TGFBR1). Cells from Fig. 1c are used for the violin plots.
Fig. 3
Fig. 3. Stromal distribution in the two distinct decidual layers.
a, Heat map showing relative expression (z-score) of selected genes for perivascular and decidual stromal cells (n 11 deciduas; adjusted P value 0.1; Wilcoxon rank-sum test with Bonferroni correction). b, Immunohistochemistry of a spiral artery in serial sections of the decidua, stained for CD34 (endothelial cells), ACTA2 (PV cells and dS1 cells), MCAM (PV1 cells) and MMP11 (PV2 cells) (n 2 biological replicates). Scale bar, 100 m. c, Immunohistochemistry of decidual sections stained for ACTA2, which distinguishes between ACTA2 dS1 in decidua spongiosa and ACTA2 dS2 and dS3 in decidua compacta (n 3 biological replicates). Right panels are a higher magnification of the respectively numbered inset. Scale bar, 50 m. d, Multiplexed smFISH of decidua parietalis showing two decidual layers. ACTA2 dS1 in decidua spongiosa (40 objective); IGBP1 and PRL dS2 and dS3 confined to decidua compacta (20 objective) (n 2 biological replicates). e, Heat map shows selected significant ligand–receptor interactions (n 6 deciduas, P value 0.05, permutation test, see Methods) between PV cells and dS cells (left) and decidual cells (right) (n 11 deciduas). Assays were carried out at the mRNA level, but are extrapolated to protein interactions
Fig. 4
Fig. 4. Three dNK populations.
a, Heat map showing relative expression (z-score) of markers defining the three dNK subsets (n 11 deciduas; percentage 1 10%, percentage 2 60%; refers to the percentage of cells with expression above 0 in the corresponding cluster and all other clusters; P value 0.1 after Bonferroni correction, Wilcoxon rank-sum test). b, Workflow for KIRid method (see https://github.com/Teichlab/KIRid). IPD-KIR, database for human KIR (available at https://www.ebi.ac.uk/ipd/kir/). c, z-scores of KIR receptors (mean expression levels). Expression values were generated using Smart-seq2 data and the KIRid approach (n 5 deciduas). d, FACS gating strategy to identify dNK subsets (representative sample from n 6 individuals; Supplementary Table 9). e, z-scores of expression of granule molecules PRF1, GNL1, GZMA and GZMB in dNK subsets (n 11 individuals). f, Flow cytometry to compare staining of granule components in NKG2A KIR versus NKG2A KIR dNK cells (PRF1 n 9 individuals; GNLY n 7 individuals; GZMA n 8 individuals; GZMB n 10 individuals; Supplementary Table 9). Non-parametric paired Wilcoxon test. * 0.05, ** 0.01. g, Right, z-scores of glycolysis enzymes (mean mRNA expression). Left, only differentially expressed enzymes are shown in the glycolysis pathway (n 11 deciduas; P value 0.1 after Bonferroni correction, Wilcoxon rank-sum test)
Fig. 5
Fig. 5. Multiple regulatory immune responses at the site of placentation.
a, Overview of selected ligand–receptor interactions; P values indicated by circle size, scale on right (permutation test, see Methods). The means of the average expression level of interacting molecule 1 in cluster 1 and interacting molecule 2 in cluster 2 are indicated by colour. Only droplet data were used (n 6 deciduas). Angio., angiogenesis. Assays were carried out at the mRNA level, but are extrapolated to protein interactions. b, Diagram of the main receptors and ligands expressed on the three dNK subsets that are involved in adhesion and cellular recruitment. c, Diagram of the main receptors and ligands expressed on the three dNK subsets that are involved in immunomodulation.

Comment in

References

    1. Ramathal CY, Bagchi IC, Taylor RN, Bagchi MK. Endometrial decidualization: of mice and men. Semin Reprod Med. 2010;28:17–26. - PMC - PubMed
    1. Koopman LA, et al. Human decidual natural killer cells are a unique NK cell subset with immunomodulatory potential. J Exp Med. 2003;198:1201–1212. - PMC - PubMed
    1. Burton GJ, Watson AL, Hempstock J, Skepper JN, Jauniaux E. Uterine glands provide histiotrophic nutrition for the human fetus during the first trimester of pregnancy. J Clin Endocrinol Metab. 2002;87:2954–2959. - PubMed
    1. Hempstock J, Cindrova-Davies T, Jauniaux E, Burton GJ. Endometrial glands as a source of nutrients, growth factors and cytokines during the first trimester of human pregnancy: a morphological and immunohistochemical study. Reprod Biol Endocrinol. 2004;2:58. - PMC - PubMed
    1. Burton GJ, Woods AW, Jauniaux E, Kingdom JCP. Rheological and physiological consequences of conversion of the maternal spiral arteries for uteroplacental blood flow during human pregnancy. Placenta. 2009;30:473–482. - PMC - PubMed

Publication types

MeSH terms