. 2018 Dec;13(12):2758-2780.
doi: 10.1038/s41596-018-0060-3.

In vitro conversion of adult murine endothelial cells to hematopoietic stem cells

Affiliations

In vitro conversion of adult murine endothelial cells to hematopoietic stem cells

José Gabriel Barcia Durán et al. Nat Protoc. 2018 Dec.

Abstract

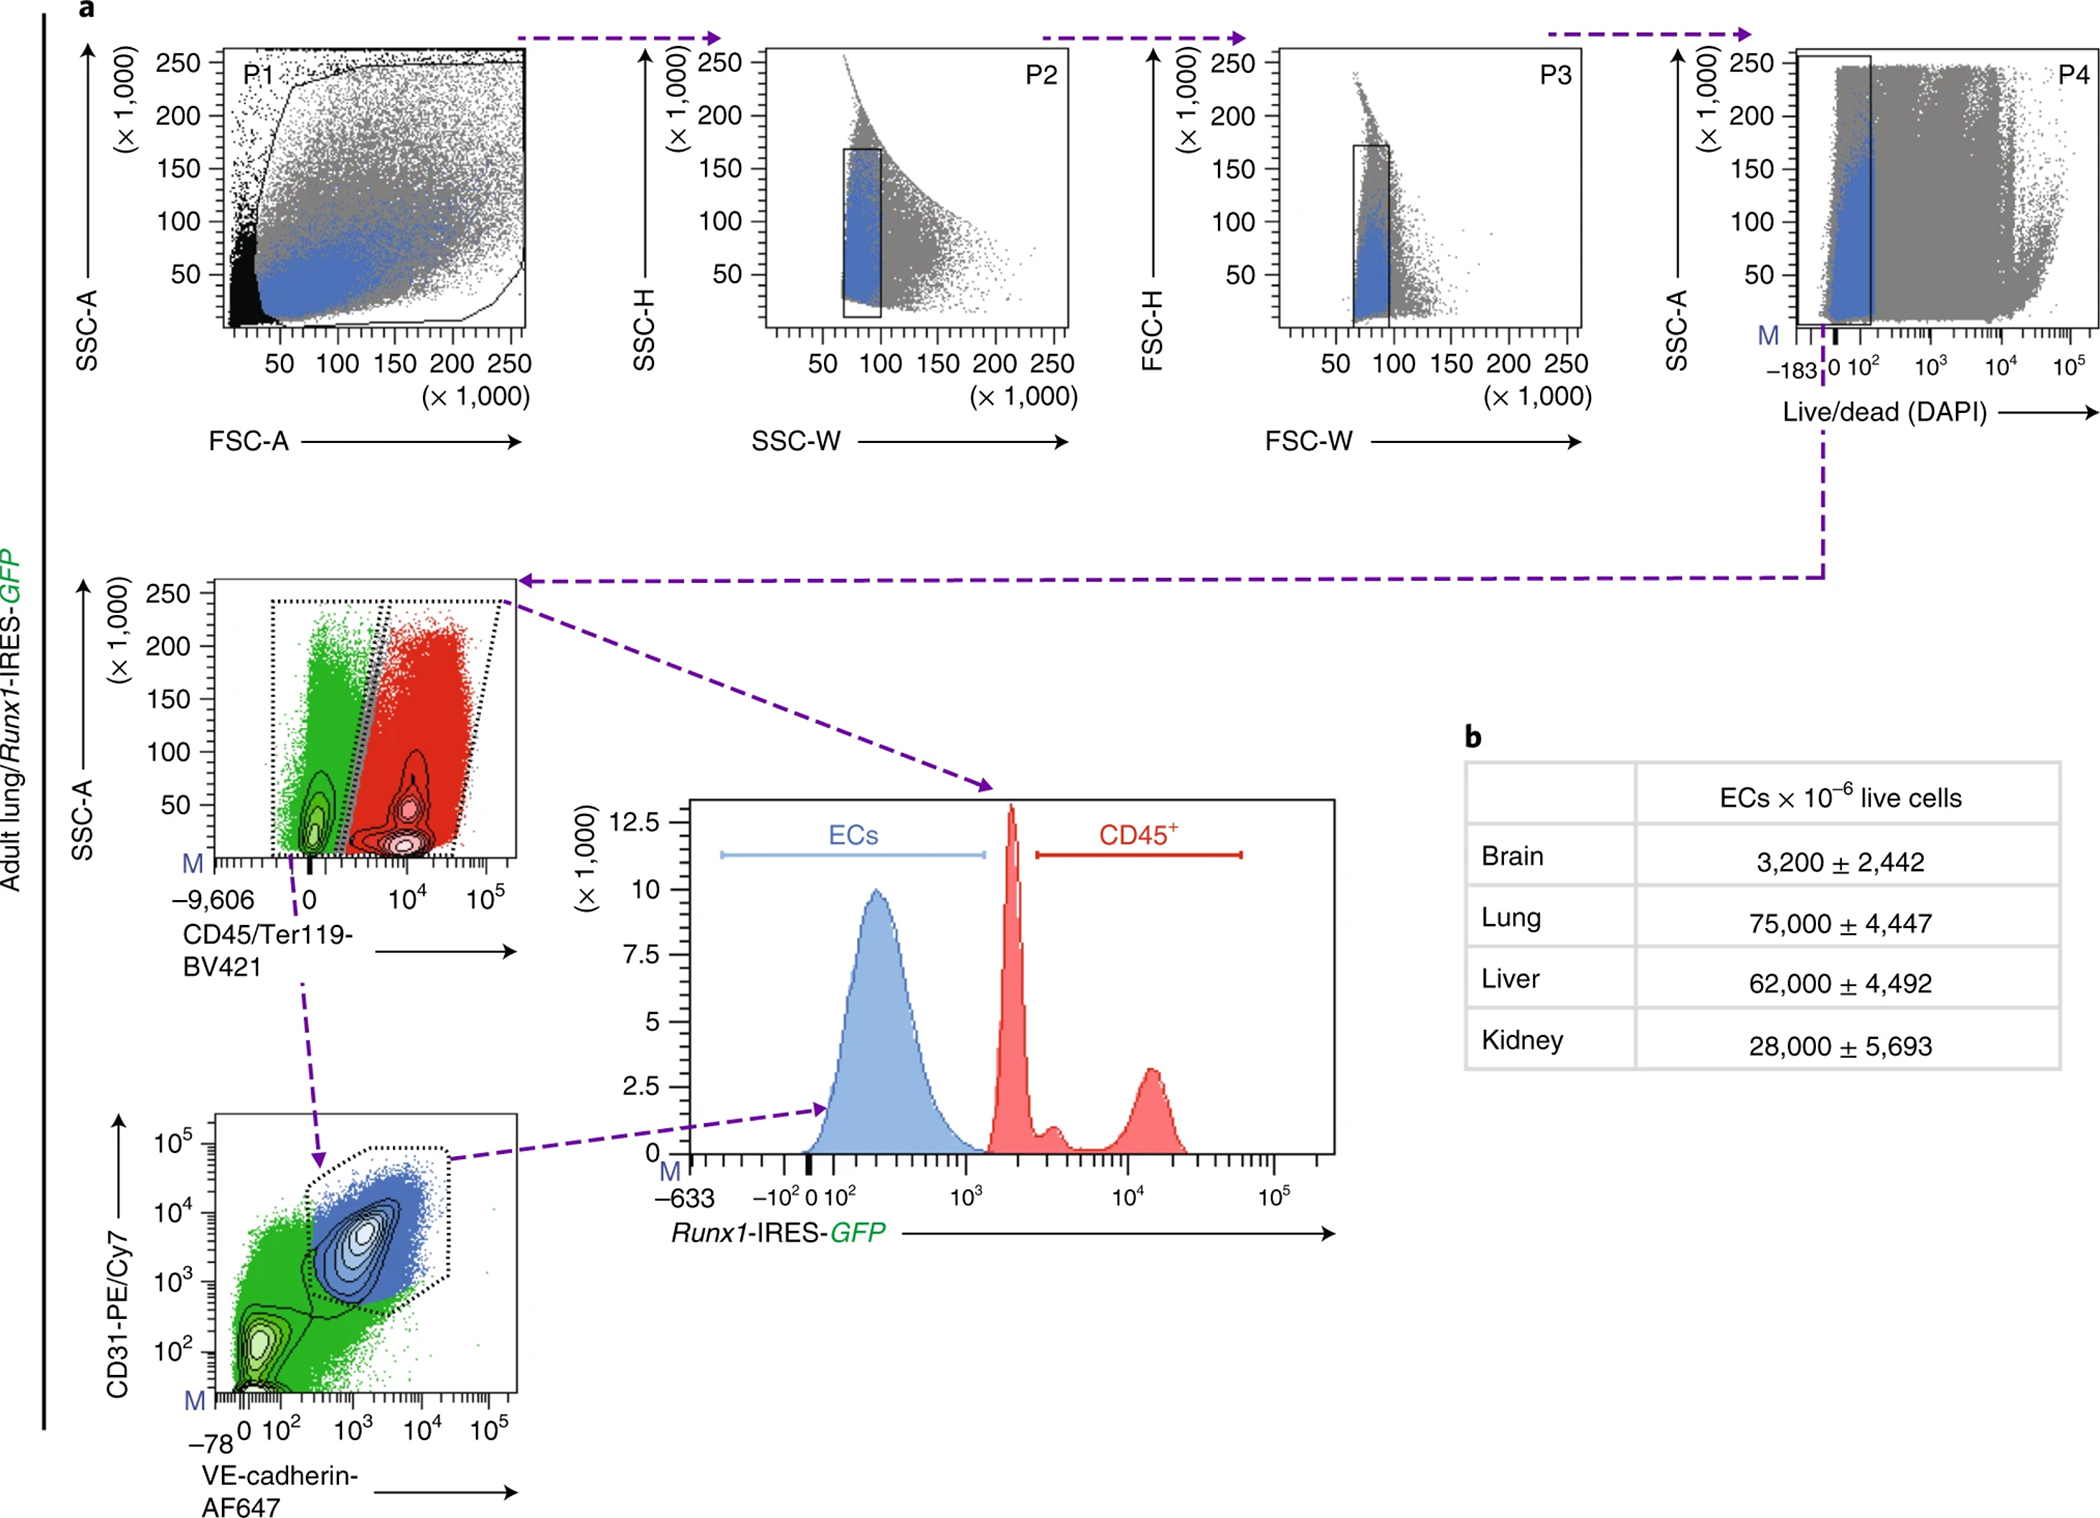
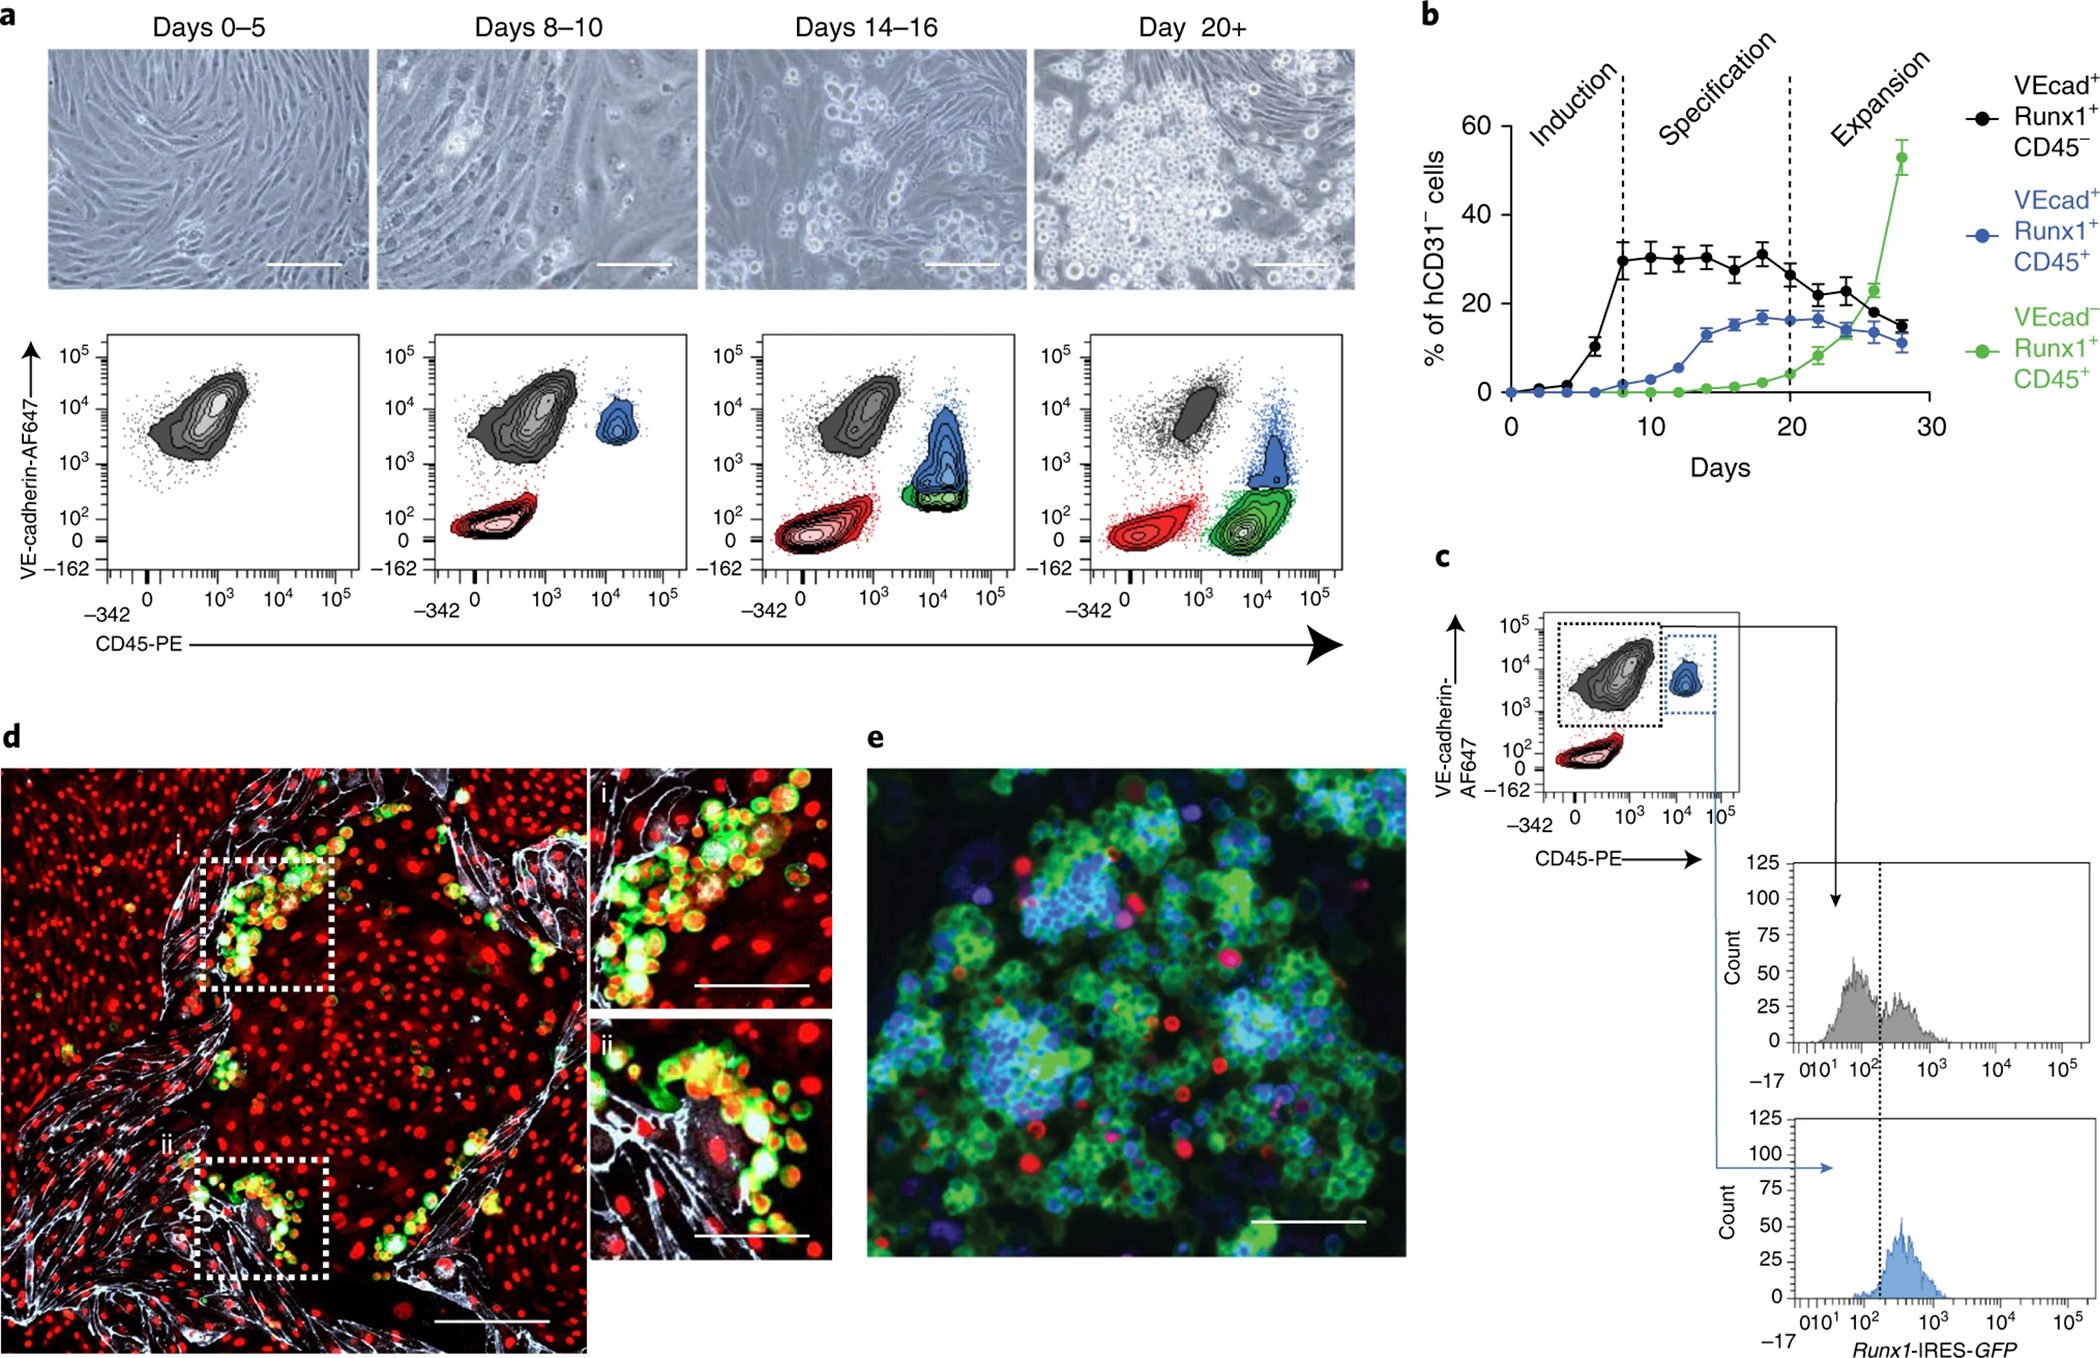
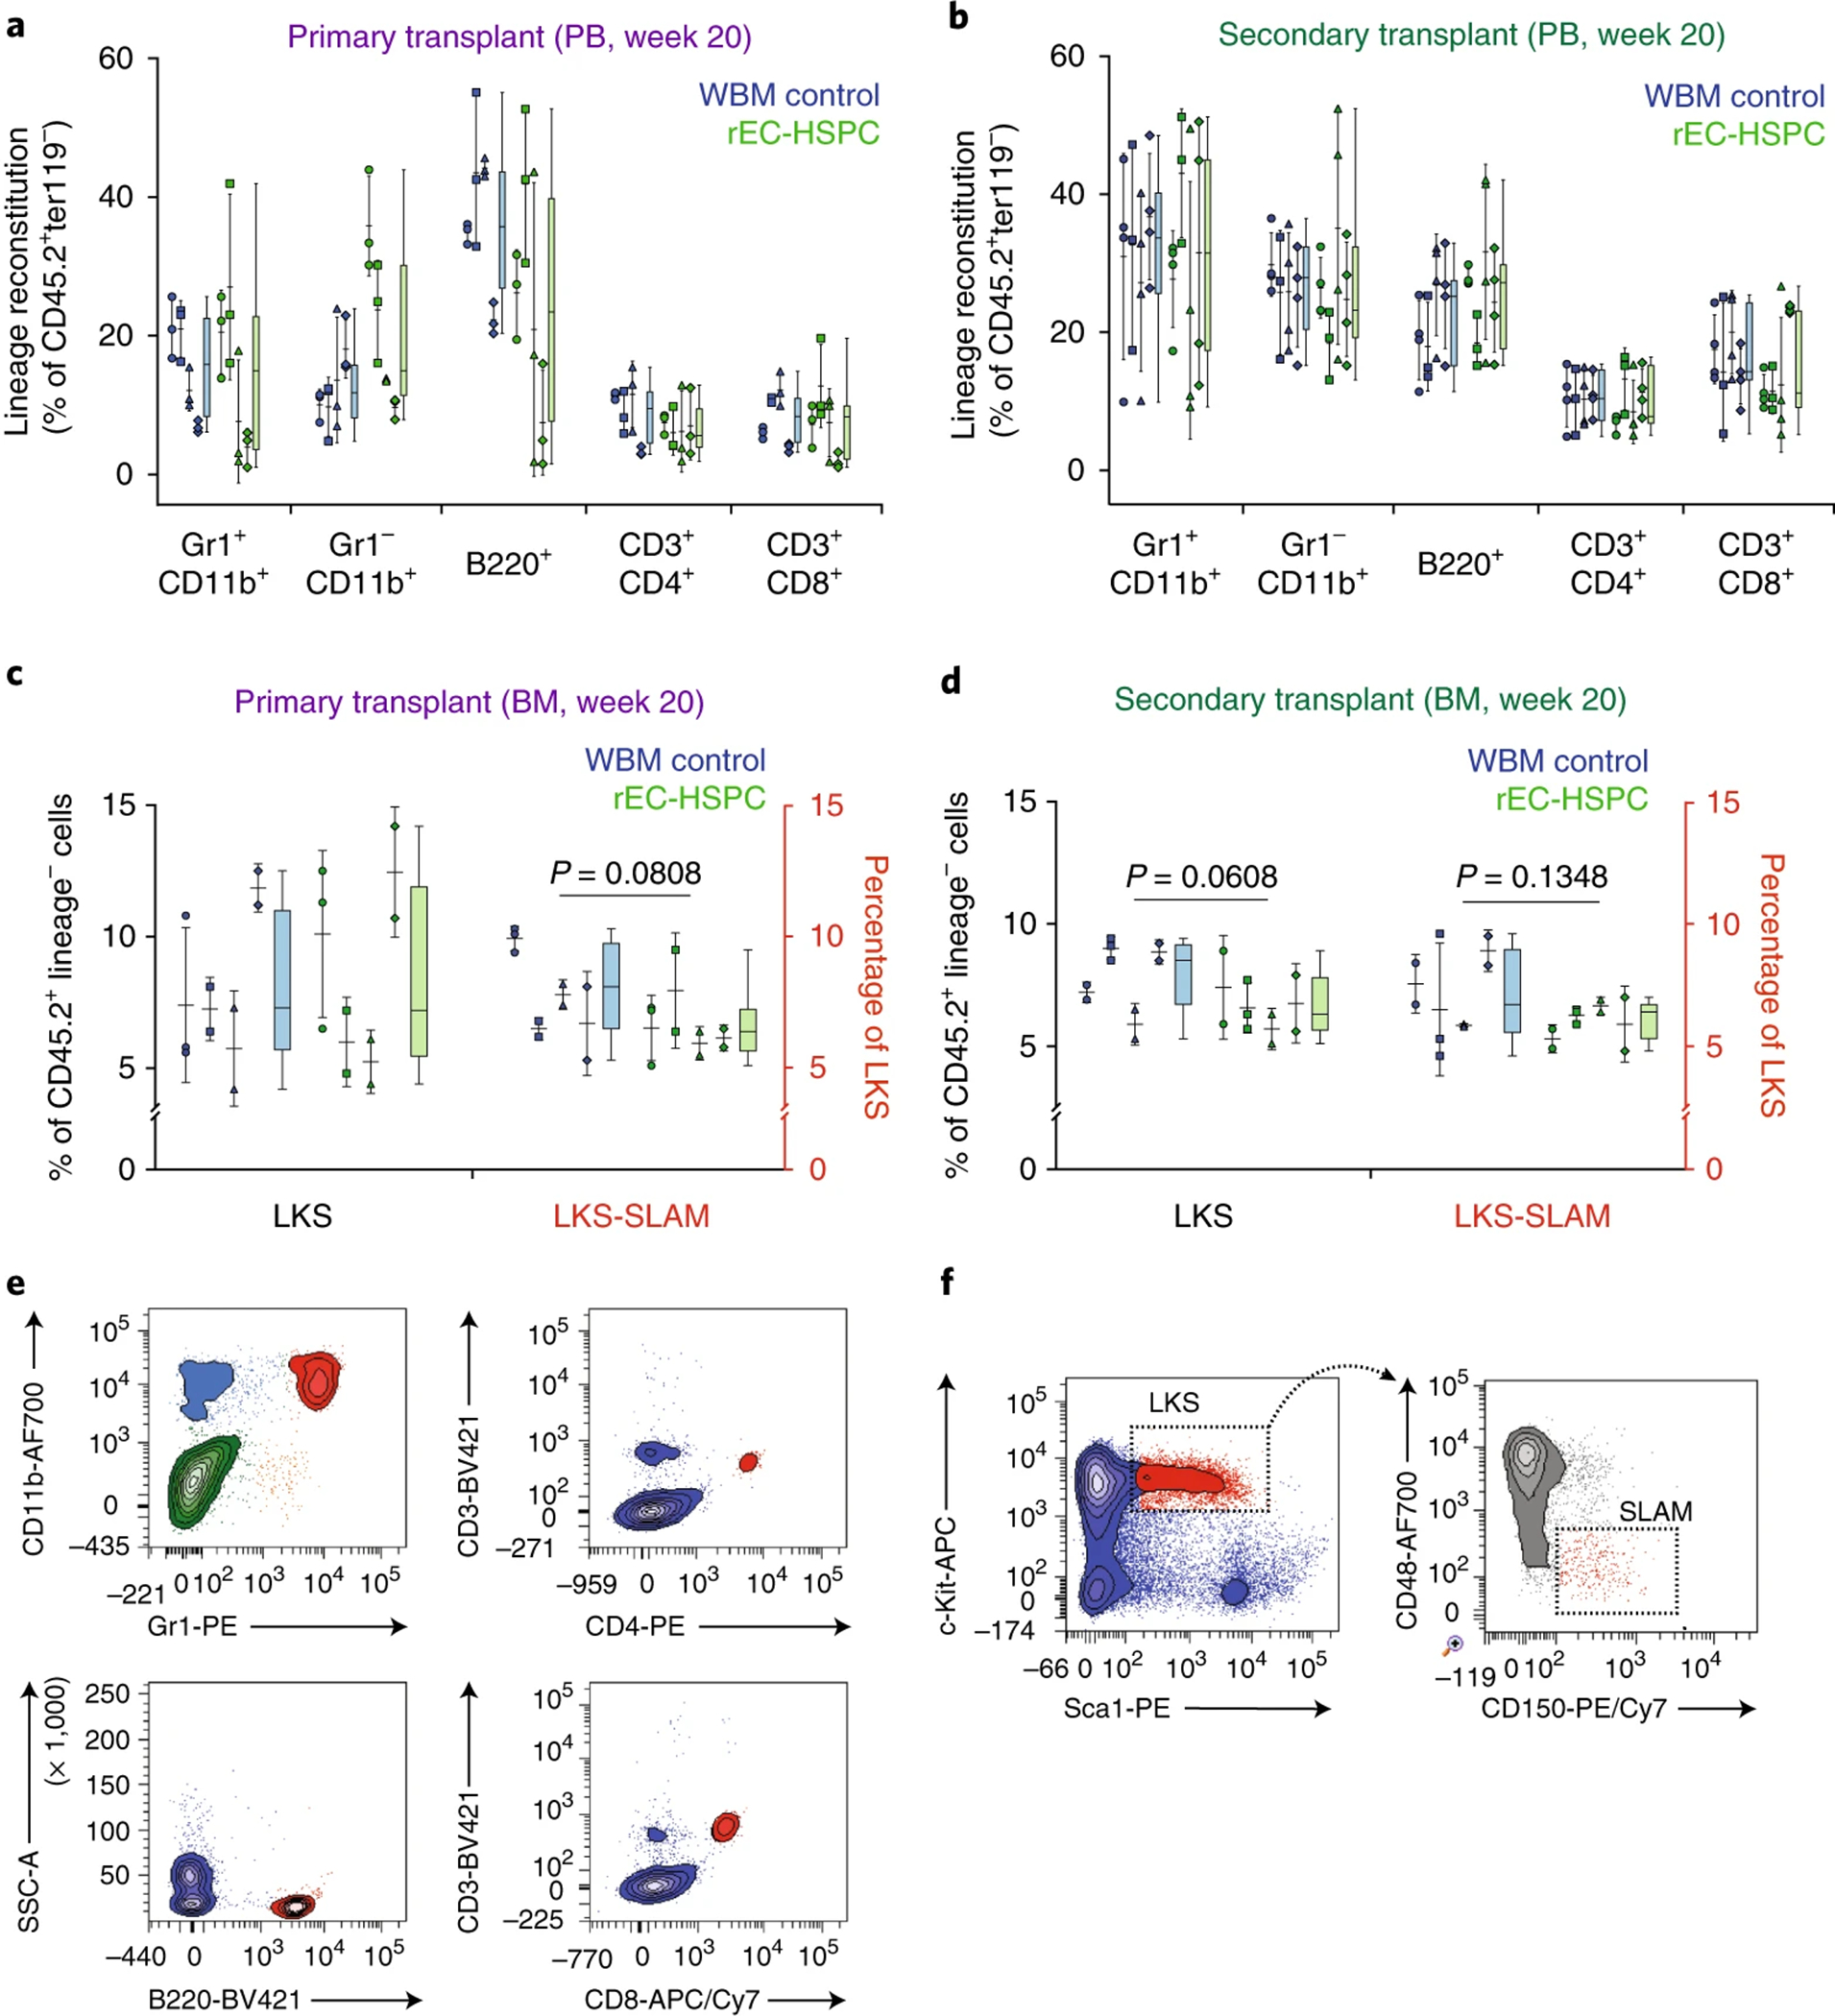
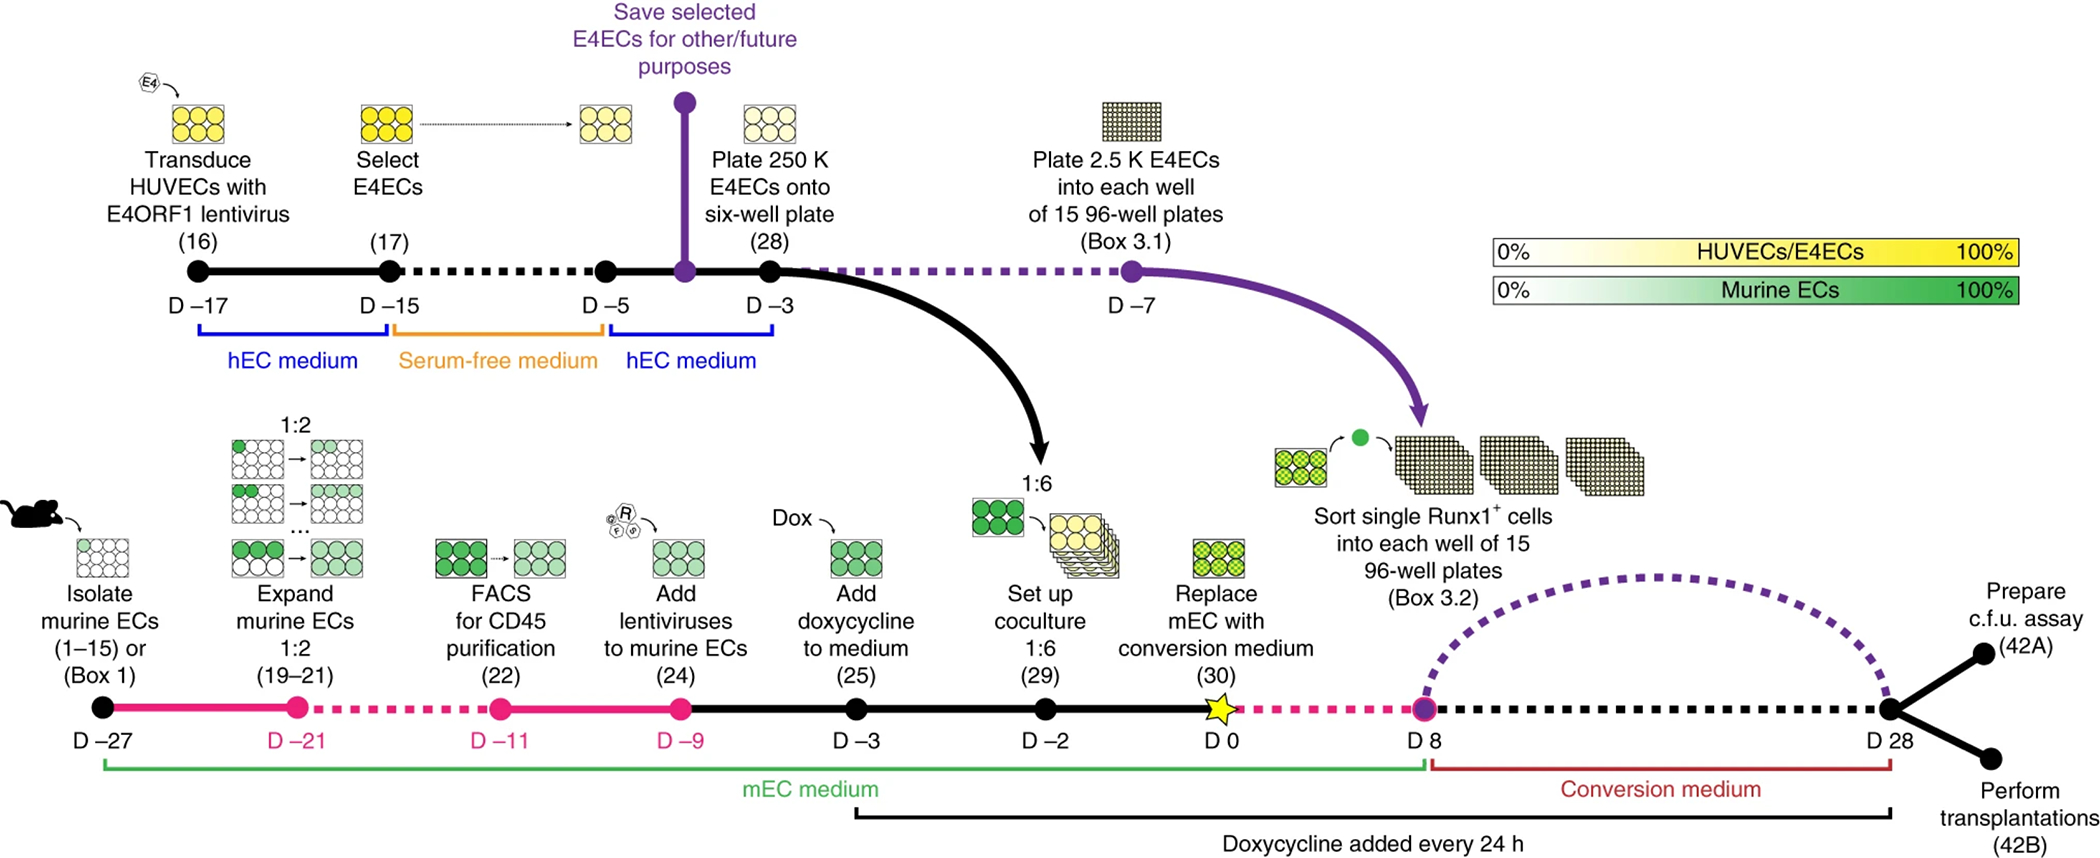
The ability to generate hematopoietic stem cells (HSCs) in vitro would have an immeasurable impact on many areas of clinical practice, including trauma, cancer, and congenital disease. In this protocol, we describe a stepwise approach that converts adult murine endothelial cells (ECs) to HSCs, termed 'reprogrammed ECs into hematopoietic stem and progenitor cells' (rEC-HSPCs). The conversion, which is achieved without cells transitioning through a pluripotent state, comprises three phases: induction, specification, and expansion. Adult ECs are first isolated from Runx1-IRES-GFP; Rosa26-rtTa mice and maintained in culture under EC growth factor stimulation and Tgfβ inhibition. In the first (induction) phase of conversion (days 0-8), four transcription factors (TFs)-FosB, Gfi1, Runx1, and Spi1 (FGRS)-are expressed transiently, which results in endogenous Runx1 expression. During the second (specification) phase (days 8-20), endogenous Runx1+ FGRS-transduced ECs commit to a hematopoietic fate and no longer require exogenous FGRS expression. Finally, the vascular niche drives robust proliferation of rEC-HSPCs during the expansion phase (days 20-28). The resulting converted cells possess a transcriptomic signature and long-term self-renewal capacity indistinguishable from those of adult HSCs. In this protocol, we also describe functional in vitro and in vivo assays that can be used to demonstrate that rEC-HSPCs are competent for clonal engraftment and possess multi-lineage reconstitution potential, including antigen-dependent adaptive immune function. This approach thus provides a tractable strategy for interrogating the generation of engraftable hematopoietic cells, advancing the mechanistic understanding of hematopoietic development and HSC self-renewal.


Conflict of interest statement

Competing Interests Statement

S.R. is the founder and a non-paid consultant to Angiocrine Bioscience, New York, New York, USA.

Figures

Figure 1.
Figure 1.. In vitro conversion of adult murine EC into HSPCs: timeline.
Schema for step-wise conversion of adult murine ECs (mECs) into HSPCs. Course of reprogramming is depicted in time from left to right. Key steps are denoted by a filled circle, with a corresponding pictogram, the step number in parentheses, and day (D). D 0, denoted by a star, corresponds to the day when the reprogramming co-culture is placed in cytokine-enriched, serum- and xenobiotic-free medium (see Reagent Setup under Materials). Time points are not spaced to scale, yet dotted lines indicate durations between steps longer than this representation indicates. Fucsia lines indicate steps of variable length. Violet lines indicate optional steps. Human umbilical vein endothelial cells (HUVECs) and E4ORF1-HUVECs (E4ECs) are represented in yellow; mECs are represented in green. Cell confluency in vitro is depicted as a transparency spectrum on the legend at the top right of the figure from 0% (absence of color) to 100% (saturated green/yellow).
Figure 2.
Figure 2.. Isolation of murine endothelial cells by flow cytometry.
Representative flow cytometry and gating strategy to isolate adult murine lung endothelial cells (ECs). a, First, all events are discriminated by size, granularity, and viability (top panels). The first gate (P1) is drawn on a plot of SSC-A vs. FSC-A (far left), excluding a narrow strip of debris and enucleated cells, such as erythrocytes and platelets. P1 is then visualized on consecutive plots of SSC-H vs. SSC-W and FSC-H vs. FSC-W (or vice versa) to discern single cells from two or more cells in close proximity to each other (center), yielding P2 and P3, respectively. Next, DAPI staining allows live-dead cell discrimination (far right). The resulting P4 gate should consist of single, live cells. b, Negative gating of anti-mouse CD45-PE and anti-mouse Ter119-BV421 is used to exclude miscellaneous haematopoietic and erythroid cells (red), respectively. c, Single, live, non-haematopoietic cells (green) are visualized on a plot of anti-mouse VE-Cadherin-AF647 vs. anti-mouse CD31-PE/Cy7. Adult murine ECs (blue) are defined and sorted as DAPICD45Ter119VE-Cadherin+CD31+. d, Cells isolated from a Runx1-IRES-GFP reporter can be plotted on a histogram to ensure that the EC population to be sorted (blue) and the excluded miscellaneous haematopoietic and erythroid cells (red) do not overlap (center panel). e, Absolute numbers of ECs (DAPICD45Ter119VE-Cadherin+CD31+) for every million live cells (P4) isolated from indicated organ. Data represent mean ± s.d. (n = 4). Flow cytometry data was obtained was analyzed using a BD FACSAria II and BD FACSDiva software.
Figure 3.
Figure 3.. Conditional expression of FGRS in adult murine ECs generates haematopoietic cells.
a, Time-course depicting the emergence of CD45+ cells in the vicinity of vascular niche ECs (HUVEC-E4ORF1, or E4ECs). Representative phase contrast microscopy (top panels; original magnification, ×10; scale bars, 100 μm) and representative flow cytometry plot of anti-mouse VE-Cadherin-AF647 vs. anti-mouse CD45-PE after events are discriminated by size, granularity and viability (see Fig. 2a) and E4ECs are excluded by negative anti-human CD31-BV421 gating (bottom panels). The VE-CadherinCD45 population represents cells that have lost endothelial identity in the reprogramming process (red); the VE-Cadherin+CD45 population represents non-reprogrammed endothelial cells (gray); the VE-Cadherin+CD45+ population represents cells undergoing reprogramming (blue); and the VE-CadherinCD45+ population represents fully reprogrammed rEC-HSPCs, amenable to downstream assaying (green). b, Quantification of gray, blue, and green populations every two days over the course of reprogramming. Stage of reprogramming is indicated in black within dotted lines. Data represent percent mean ± s.e.m. (n = 5). c, Representative flow cytometry showing in vitro tracking of endothelial-to-haematopoietic transition using cells isolated from a Runx1-IRES-GFP reporter mouse. Data shown correspond to day 8 of reprogramming. The VE-Cadherin+CD45 (gray) population has partially induced endogenous Runx1 expression, while the VE-Cadherin+CD45+ (blue) population has inducing endogenous Runx1 to greater extent. Both maintain VE-Cadherin expression, but the blue population is said to be farther along the reprogramming process. d, Representative fluorescence microscopy showing the emergence of CD45+ cells in the vicinity of E4ECs. Cells were stained on day 10 of reprogramming using DAPI (red), anti-mouse CD45-PE (green), and anti-human CD31-BV421 (white; original magnification, ×10; scale bars, 100 μm). e, Representative fluorescence microscopy showing the emergence of LKS cells in the vicinity of E4ECs. Cells were stained on day 23 of reprogramming using anti-mouse CD45-PE (green), anti-mouse Lin-BV421 (blue), anti-mouse cKit-APC, and anti-mouse Sca1-APC (both red; original magnification, ×10; scale bars, 100 μm). Flow cytometry data was obtained was analyzed using a BD FACSAria II and BD FACSDiva software. All imaging was performed using a Zeiss 710 META confocal microscope and ZEN software.
Figure 4.
Figure 4.. Conditional FGRS expression supports long-term 1° and 2° rEC-HSPC engraftment (adapted from Lis et al.)
a, Lineage contribution to Gr1+CD11b+ and Gr1CD11b+ myeloid cells, B220+ B cells, CD3+CD4+ T cells, and CD3+CD8+ T cells at week 20 post-primary whole bone marrow (WBM) control (blue boxes) or rEC-HSPC (green boxes) transplants in peripheral blood (PB). Data represent mean ± s.d. (n = 4 independent conversion experiments run in technical triplicates for each condition). P-values, two-tailed unpaired t-test. b, Lineage contribution to Gr1+CD11b+ and Gr1CD11b+ myeloid cells, B220+ B cells, CD3+CD4+ T cells, and CD3+CD8+ T cells at week 20 post-secondary WBM control (blue boxes) or rEC-HSPC (green boxes) transplants in PB. Data represent mean ± s.d. (n = 4 independent conversion experiments run in technical triplicates for each conditions). P-values, two-tailed unpaired t-test. c, Relative representation of LKS and LKS-SLAM cells in bone marrow at week 20 post-primary and d, secondary transplantation of WBM controls (blue boxes) or rEC-HSPC (green boxes). Data represent mean ± s.d. (n = 4 independent conversion experiments run in technical triplicates for each condition). P-values, two-tailed unpaired t-test. e, Representative flow cytometry plots of rEC-HSPC lineage contribution to the peripheral blood after events are discriminated by size, granularity and viability (see Fig. 2a), and CD45.1CD45.2+ cells are gated by anti-mouse CD45.1-PE/Cy7 and anti-mouse CD45.2-APC/Cy7 (myeloid and B lymphoid panels, top left and bottom left, respectively) or CD45.2-AF700 (T lymphoid panels, right panels) staining. Data shown correspond to one mouse bled on week 20 post-primary transplantation. f, Representative flow cytometry plots of rEC-HSPC LKS-SLAM contribution to the bone marrow after events are discriminated by size, granularity and viability (see Fig. 2a), and CD45.2+Lin cells are gated by anti-mouse CD45.2-APC/Cy7 and anti-mouse Lin-BV421 staining (left panel) and cKit+Sca1+ cells are gated by anti-mouse cKit-APC and anti-mouse Sca1-PE staining (right panel). Data shown correspond to one mouse femur analyzed on week 20 post-primary transplantation. Flow cytometry data was obtained was analyzed using a BD FACSAria II and BD FACSDiva software. All animal experiments were performed under the approval of Weill Cornell Medicine Institutional Animal Care and Use Committee. Flow cytometry data was obtained was analyzed using a BD FACSAria II and BD FACSDiva software.

Similar articles

Cited by

References

    1. de Bruijn MF, Speck NA, Peeters MC & Dzierzak E Definitive hematopoietic stem cells first develop within the major arterial regions of the mouse embryo. The EMBO journal 19, 2465–2474, doi:10.1093/emboj/19.11.2465 (2000). - DOI - PMC - PubMed
    1. Heissig B et al. Recruitment of stem and progenitor cells from the bone marrow niche requires MMP-9 mediated release of kit-ligand. Cell 109, 625–637 (2002). - PMC - PubMed
    1. Hooper AT et al. Engraftment and reconstitution of hematopoiesis is dependent on VEGFR2-mediated regeneration of sinusoidal endothelial cells. Cell stem cell 4, 263–274, doi:10.1016/j.stem.2009.01.006 (2009). - DOI - PMC - PubMed
    1. Butler JM et al. Development of a vascular niche platform for expansion of repopulating human cord blood stem and progenitor cells. Blood 120, 1344–1347, doi:10.1182/blood-2011-12-398115 (2012). - DOI - PMC - PubMed
    1. Butler JM et al. Endothelial cells are essential for the self-renewal and repopulation of Notch-dependent hematopoietic stem cells. Cell stem cell 6, 251–264, doi:10.1016/j.stem.2010.02.001 (2010). - DOI - PMC - PubMed

Publication types

Substances