. 2018 Nov;563(7732):569-573.
doi: 10.1038/s41586-018-0697-7. Epub 2018 Nov 14.

Autophagy maintains tumour growth through circulating arginine

Affiliations

Autophagy maintains tumour growth through circulating arginine

Laura Poillet-Perez et al. Nature. 2018 Nov.

Erratum in

Abstract

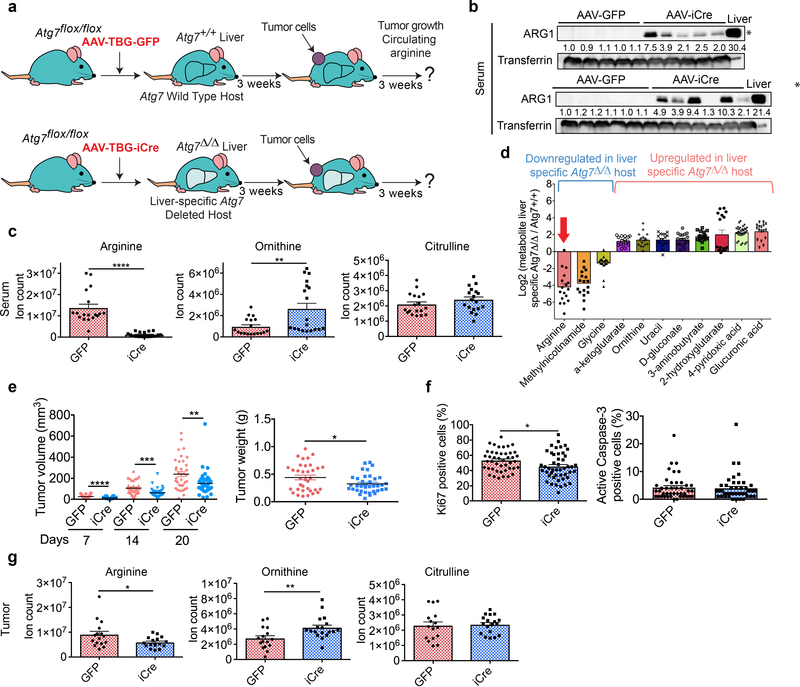
Autophagy captures intracellular components and delivers them to lysosomes, where they are degraded and recycled to sustain metabolism and to enable survival during starvation1-5. Acute, whole-body deletion of the essential autophagy gene Atg7 in adult mice causes a systemic metabolic defect that manifests as starvation intolerance and gradual loss of white adipose tissue, liver glycogen and muscle mass1. Cancer cells also benefit from autophagy. Deletion of essential autophagy genes impairs the metabolism, proliferation, survival and malignancy of spontaneous tumours in models of autochthonous cancer6,7. Acute, systemic deletion of Atg7 or acute, systemic expression of a dominant-negative ATG4b in mice induces greater regression of KRAS-driven cancers than does tumour-specific autophagy deletion, which suggests that host autophagy promotes tumour growth1,8. Here we show that host-specific deletion of Atg7 impairs the growth of multiple allografted tumours, although not all tumour lines were sensitive to host autophagy status. Loss of autophagy in the host was associated with a reduction in circulating arginine, and the sensitive tumour cell lines were arginine auxotrophs owing to the lack of expression of the enzyme argininosuccinate synthase 1. Serum proteomic analysis identified the arginine-degrading enzyme arginase I (ARG1) in the circulation of Atg7-deficient hosts, and in vivo arginine metabolic tracing demonstrated that serum arginine was degraded to ornithine. ARG1 is predominantly expressed in the liver and can be released from hepatocytes into the circulation. Liver-specific deletion of Atg7 produced circulating ARG1, and reduced both serum arginine and tumour growth. Deletion of Atg5 in the host similarly regulated [corrected] circulating arginine and suppressed tumorigenesis, which demonstrates that this phenotype is specific to autophagy function rather than to deletion of Atg7. Dietary supplementation of Atg7-deficient hosts with arginine partially restored levels of circulating arginine and tumour growth. Thus, defective autophagy in the host leads to the release of ARG1 from the liver and the degradation of circulating arginine, which is essential for tumour growth; this identifies a metabolic vulnerability of cancer.


Conflict of interest statement

The other authors declare no competing financial interests.

Figures

Extended data Fig. 1:
Extended data Fig. 1:. Host autophagy promotes growth of different tumor cell types.
a-c-e, Comparison of tumor weight between Atg7+/+ (n=5) and Atg7Δ/Δ (a, n=4; c, n=5; e, n=4) hosts after injection of 1.3 (a), MB49 (c) or 71.8 (e) cells. Data are mean +/− S.E.M (*p<0.05, **p<0.01. b-d-f, IHC quantification of Ki67 and active Caspase-3 positive cells in tumors from Atg7+/+ and Atg7Δ/Δ hosts. Data are mean +/− S.E.M (*p<0.05, ***p<0.001, ****p<0.0001).
Extended data Fig. 2:
Extended data Fig. 2:. Immune response is not involved in decreased tumor growth observed in Atg7Δ/Δ hosts.
a-c, Comparison of tumor weight between Atg7+/+ (n=5) and Atg7Δ/Δ (a, n=5; c, n=6) hosts after injection of 1.7 (a), 1.9 (c) cells. Data are mean +/− S.E.M. b-d, IHC quantification of Ki67 and active Caspase-3 positive cells in 1.7 (b) and 1.9 (d) tumors from Atg7+/+ and Atg7Δ/Δ hosts. Data are mean +/− S.E.M. e, Representative IHC pictures and quantification of CD3, CD4 and CD8 positive cells in tumors from Atg7+/+ and Atg7Δ/Δ hosts. Data are mean +/− S.E.M. f, Comparison of tumor volume and weight between Atg7+/+ (n=10), Atg7+/+ + CD4/CD8 antibody depletion (n=15), Atg7Δ/Δ (n=7) and Atg7Δ/Δ + CD4/CD8 antibody depletion (n=8) hosts. Data are mean +/− S.E.M (*p<0.05, ****p<0.0001). g, Immune components fold change between Atg7+/+ and Atg7Δ/Δ with or without antibody depletion (n=5 each). Treg, T regulatory cells; DC, dendritic cells; MDSC, myeloid-derived suppressor cells. Data are mean +/− S.E.M (***p<0.001, ****p<0.0001) by Two-way ANOVA test.
Extended data Fig. 3:
Extended data Fig. 3:. Tumor cells are arginine auxotrophs.
a, YUMM 1.3, 71.8, MB49 and YUMM 1.7, 1.9 proliferation in vitro in medium containing different percentage of arginine. Cell density was measured every 2 hours using the IncuCyte. Data are representative of 3 independent experiments performed in duplicate. b, Western blotting showing expression of ASS1, ASL and OTC in kidney and liver from Atg7+/+ and Atg7Δ/Δ hosts. *p<0.05 compared to Atg7+/+ hosts. Data are representative of 3 independent experiments. Actin was used as a loading (Kidney ASL, Liver OTC) and processing (Kidney ASS1, Liver ASS1 and ASL) control. c, Western blotting showing expression of ASS1, ASL and OTC in YUMM 1.7 tumors from Atg7+/+ and Atg7Δ/Δ hosts. Data are representative of 2 independent experiments. Actin was used as a loading (OTC) and processing (ASS1, ASL) control. d, Analysis of serum nitric oxide levels in Atg7+/+ (n=11) and Atg7Δ/Δ (n=9) hosts. Data are mean +/− S.E.M.
Extended data Fig. 4:
Extended data Fig. 4:. Atg7 deletion increases serum arginine degradation but does not modify arginine metabolism in kidney and liver.
a, Serum 13C6-arginine and 13C5-ornithine in Atg7+/+ and Atg7Δ/Δ hosts (n=3 each) overtime. Data are mean +/− S.E.M. b, Concentration (μΜ) of arginine, citrulline, and ornithine in serum from Atg7+/+ (n=3) and Atg7Δ/Δ hosts (n=4) after infusion with 13C615N4-arginine. c-d, Concentration (nmol/g) of arginine, citrulline, and ornithine in kidney (c) and liver (d) from Atg7+/+ and Atg7Δ/Δ hosts (n=2 each) after infusion with 13C615N4-arginine. Data are mean (**p<0.01 by Two-way ANOVA test).
Extended data Fig. 5:
Extended data Fig. 5:. Liver-specific Atg7 deletion lead to liver cell enlargement without affecting other tissues.
a-b-c, Western blotting showing expression of Atg7 in liver (n=11 each) (a), brain (n= 9 and 11, respectively) (b) and kidney (n=10 each) (c) from Atg7+/+ and liver-specific Atg7Δ/Δ hosts. *p<0.05 compared to Atg7+/+ hosts. Data are representative of 2 independent experiments. Actin was used as a loading control. d, Representative H&E tissue staining from Atg7+/+ and liver-specific Atg7Δ/Δ hosts. Pictures are representative of 2 independent experiments. e, Analysis of serum nitric oxide levels in Atg7+/+(n=13) and liver-specific Atg7Δ/Δ (n=15) hosts. Data are mean +/− S.E.M. f, Comparison of serum metabolites significantly regulated in Atg7Δ/Δ and liver-specific Atg7Δ/Δ hosts (n=17 each, p<0.05).
Extended data Fig. 6:
Extended data Fig. 6:. Atg5 deletion increased serum ARG1, decreased serum arginine and tumor growth.
a, Experimental design to induce host mice with conditional whole-body Atg5 deletion (Atg5Δ/Δ) and wild type controls (Atg5+/+) with which to assess tumor growth. Ubc-CreERT2/+;Atg5+/+ and Ubc-CreERT2/+;Atg5flox/flox mice were injected with TAM at 8 to 10 weeks of age to delete Atg5 and create Atg5+/+ and Atg5Δ/Δ hosts. Mice were then injected subcutaneously with tumor cells and tumor growth was monitored over 3 weeks. b, Comparison of tumor weight between Atg5+/+ (n=4) and Atg5Δ/Δ hosts (n=3). Data are mean +/− S.E.M (**p<0.01). c, IHC quantification of Ki67 and active Caspase-3 positive cells in tumors from Atg5+/+ and Atg5Δ/Δ hosts. Data are mean +/− S.E.M (****p<0.0001). d, Western blotting showing expression of ARG1 in serum from Atg5+/+ (n=3), Atg5Δ/Δ (n=4) and Atg7Δ/Δ (n=3) hosts. *p<0.05 compared to Atg5+/+ hosts. Transferrin was used as a loading control e, Serum arginine, ornithine and citrulline levels in Atg5+/+ (n=4) and Atg5Δ/Δ (n=3) hosts obtained by LC-MS. Data are mean +/− S.E.M (*p<0.05, **p<0.01).
Extended data Fig. 7:
Extended data Fig. 7:. Liver-specific Atg5 deleted hosts present liver cell enlargement, increased serum ARG1 and decreased serum arginine.
a, Experimental design to induce liver-specific deletion of Atg5. Atg5flox/flox mice were injected (tail vein) with AAV-TBG-GFP or AAV-TBG-iCre at 8 to 10 weeks of age to delete Atg5 in liver and create Atg5+/+ and liver-specific Atg5Δ/Δ hosts, respectively. b, Western blotting showing expression of Atg5 in liver, brain and kidney from Atg5+/+ and liver-specific Atg5Δ/Δ hosts (n=6 each). *p<0.05 compared to Atg5+/+ hosts. Actin was used as a loading control c, H&E tissue staining from Atg5+/+ and liver-specific Atg5Δ/Δ hosts (n=6 each). d, Western blotting showing expression of ARG1 in serum from Atg5+/+ and liver-specific Atg5Δ/Δ hosts (n=6 each). *p<0.05 compared to Atg5+/+ hosts. Transferrin was used as a loading control e, Serum arginine, ornithine and citrulline levels in Atg5+/+ and liver-specific Atg5Δ/Δ hosts (n=6 each) obtained by LC-MS. Data are mean +/− S.E.M (***p<0.001, ****p<0.0001).
Extended data Fig. 8:
Extended data Fig. 8:. Dietary arginine supplementation rescues YUMM 1.3 tumor growth in Atg7Δ/Δ hosts.
a, Serum arginine, ornithine and citrulline in Atg7+/+ (n=5), Atg7+/+ + 1% arg (n=5), Atg7Δ/Δ (n=6) and Atg7Δ/Δ + 1% arg (n=6) hosts, obtained by LC-MS. Data are mean +/− S.E.M (*p<0.05, **p<0.01). b, Comparison of YUMM 1.3 tumor weight between Atg7+/+ and Atg7Δ/Δ (n=5 each) hosts with or without arginine supplementation. Data are mean +/− S.E.M. (**p<0.01, ****p<0.0001). c, IHC quantification of Ki67 and active Caspase-3 positive cells in tumors from Atg7+/+ and Atg7Δ/Δ hosts with or without arginine supplementation. Data are mean +/− S.E.M (**p<0.01, ****p<0.0001).
Fig. 1:
Fig. 1:. Host autophagy promotes growth of arginine auxotrophic tumors.
a, Experimental design to induce host mice with conditional whole-body Atg7 deletion (Atg7Δ/Δ) and wild type controls (Atg7+/+) with which to assess tumor growth. Ubc-CreERT2/+;Atg7+/+ and Ubc-CreERT2/+;Atg7flox/flox mice were injected with TAM to delete Atg7 and were then injected subcutaneously with tumor cells. Tumor growth was monitored over 3 weeks. b, Comparison of tumor weight between Atg7+/+ (n=5) and Atg7Δ/Δ hosts (n=8). Data are mean +/− S.E.M (****p<0.0001). c, IHC quantification of Ki67 and active Caspase-3 positive cells in tumors from Atg7+/+ and Atg7Δ/Δ hosts. Data are mean +/− S.E.M (***p<0.001). d, Serum metabolites with log2 fold change cut-offs of >1 or <−1 between Atg7+/+ (n=17) and Atg7Δ/Δ (n=17) hosts obtained by LC-MS with p<0.05. e, Illustration of the arginine metabolism. ASS1, Argininosuccinate synthase 1; ASL, Argininosuccinate lyase; ARG1, Arginase 1; NOS, Nitric oxide synthetase; OTC, Ornithine transcarbamylase. f, YUMM 1.1 proliferation in vitro in medium containing different percentages of arginine. Cell density was measured every 2 hours using IncuCyte. Data are representative of 3 independent experiments performed in duplicate. g, Western blotting showing expression of ASS1, ASL and OTC in tumors from Atg7+/+ and Atg7Δ/Δ hosts (n=4 each) representative of 3 independent experiments. Kidney was used as a control tissue for ASS1 and ASL while liver was used for OTC. Actin was used a loading control. In all figures, n= number of mice.
Fig. 2:
Fig. 2:. Serum ARG1 levels increase in Atg7Δ/Δ hosts and deplete circulating arginine.
a, Comparison of serum proteins between Atg7+/+ and Atg7Δ/Δ hosts (n=5 each) obtained by nano LC-MS/MS with corrected p<0.05. b, Proteins with log2 fold change cut-offs of >1 or <−1 between Atg7+/+ and Atg7Δ/Δ hosts. c, Western blotting showing expression of ARG1 in serum and liver from Atg7+/+ and Atg7Δ/Δ hosts. *p<0.05 compared to Atg7+/+ hosts. Data are representative of 2 independent experiments. Actin and transferrin were used as loading controls. d, Illustration of the 13C615N4-arginine tracer labelling pattern. e, Concentration (μΜ) of arginine, citrulline, and ornithine in serum from Atg7+/+ and Atg7Δ/Δ hosts (n=3 and 4, respectively) after infusion with 13C615N4-arginine. Data are mean +/− S.E.M. f, Concentration (nmol/g) of arginine, citrulline, and ornithine in tumor from Atg7+/+ and Atg7Δ/Δ hosts (n=2 each) after infusion with 13C615N4-arginine. Data are mean (***p<0.001 by Two-way ANOVA test).
Fig. 3:
Fig. 3:. Atg7 deletion in liver increases serum ARG1, and decreases serum arginine and tumor growth.
a, Experimental design to induce liver-specific deletion of Atg7. Atg7flox/flox mice were injected (tail vein) with AAV-TBG-GFP or AAV-TBG-iCre to delete Atg7 in liver and were injected subcutaneously with tumor cells. Tumor growth was monitored over 3 weeks. b, Western blotting showing expression of ARG1 in serum from Atg7+/+ and liver-specific Atg7Δ/Δ hosts (n=11 each). *p<0.05 compared to Atg7+/+ hosts. Data are representative of 2 independent experiments. Transferrin was used as a loading control. c, Serum arginine, ornithine and citrulline levels in Atg7+/+ and liver-specific Atg7Δ/Δ hosts (n=18 each) obtained by LC-MS. Data are mean +/− S.E.M (**p<0.01, ****p<0.0001). d, Serum metabolites with log2 fold change cut-offs of >1 or <−1 between Atg7+/+ and liver-specific Atg7Δ/Δ hosts (n=17 each) obtained by LC-MS with p<0.05. Data are mean +/− S.E.M. e, Comparison of tumor volume and weight between Atg7+/+ (n=17) and liver-specific Atg7Δ/Δ hosts (n=19). Data are mean +/− S.E.M (*p<0.05, **p<0.01, ***p<0.001, ****p<0.0001). f, IHC quantification of Ki67 and active Caspase-3 positive cells in tumors from Atg7+/+ and liver-specific Atg7Δ/Δ hosts. Data are mean +/− S.E.M (*p<0.05). g, Tumor arginine, ornithine and citrulline levels in Atg7+/+ (n=16) and liver-specific Atg7Δ/Δ (n=16) hosts obtained by LC-MS. Data are mean +/− S.E.M (*p<0.05, **p<0.01).
Fig. 4:
Fig. 4:. Dietary arginine supplementation rescues tumor growth in Atg7Δ/Δ hosts.
a, Experimental design to perform arginine supplementation and induce conditional whole-body Atg7 deletion to assess YUMM 1.1 tumor growth. Ubc-CreERT2/+;Atg7+/+ and Ubc-CreERT2/+;Atg7flox/flox mice were supplied with supplementary dietary arginine (0 or 1%). Seven days later, TAM was injected to delete Atg7 and mice were injected subcutaneously with tumor cells. Tumor growth was monitored over 3 weeks. b, Serum arginine, ornithine and citrulline in Atg7+/+ (n=5) and Atg7Δ/Δ (n=6) hosts with or without arginine supplementation, obtained by LC-MS. Data are mean +/− S.E.M (*p<0.05, **p<0.01, ***p<0.001). c, Comparison of tumor weight between Atg7+/+ (n=13), Atg7+/+ + 1% arginine (n=13), Atg7Δ/Δ (n=13) and Atg7Δ/Δ + 1% arginine (n=14) hosts. Data are mean +/− S.E.M (**p<0.01, ***p<0.001, ****p<0.0001). d, IHC quantification of Ki67 and active Caspase-3 positive cells in tumors from Atg7+/+ and Atg7Δ/Δ hosts with or without arginine supplementation. Data are mean +/− S.E.M (***p<0.001, ****p<0.0001). e, Model of host autophagy promoting tumor growth.

Comment in

References

    1. Karsli-Uzunbas G et al. Autophagy is required for glucose homeostasis and lung tumor maintenance. Cancer Discov 4, 914–927, doi:10.1158/2159-8290.CD-14-0363 (2014). - DOI - PMC - PubMed
    1. Komatsu M et al. Impairment of starvation-induced and constitutive autophagy in Atg7-deficient mice. J Cell Biol 169, 425–434, doi:10.1083/jcb.200412022 (2005). - DOI - PMC - PubMed
    1. Kuma A et al. The role of autophagy during the early neonatal starvation period. Nature 432, 1032–1036, doi:10.1038/nature03029 (2004). - DOI - PubMed
    1. Guo JY et al. Autophagy provides metabolic substrates to maintain energy charge and nucleotide pools in Ras-driven lung cancer cells. Genes Dev 30, 1704–1717, doi:10.1101/gad.283416.116 (2016). - DOI - PMC - PubMed
    1. Kamada Y, Sekito T & Ohsumi Y Autophagy in yeast: a TOR-mediated response to nutrient starvation. Curr Top Microbiol Immunol 279, 73–84 (2004). - PubMed

Publication types

MeSH terms