. 2018 Oct;27(5):387-396.
doi: 10.5607/en.2018.27.5.387. Epub 2018 Oct 31.

A Group of Descending Glutamatergic Neurons Activated by Stress in Corticolimbic Regions Project to the Nucleus Accumbens

Affiliations

A Group of Descending Glutamatergic Neurons Activated by Stress in Corticolimbic Regions Project to the Nucleus Accumbens

Jin-Young Park et al. Exp Neurobiol. 2018 Oct.

Abstract

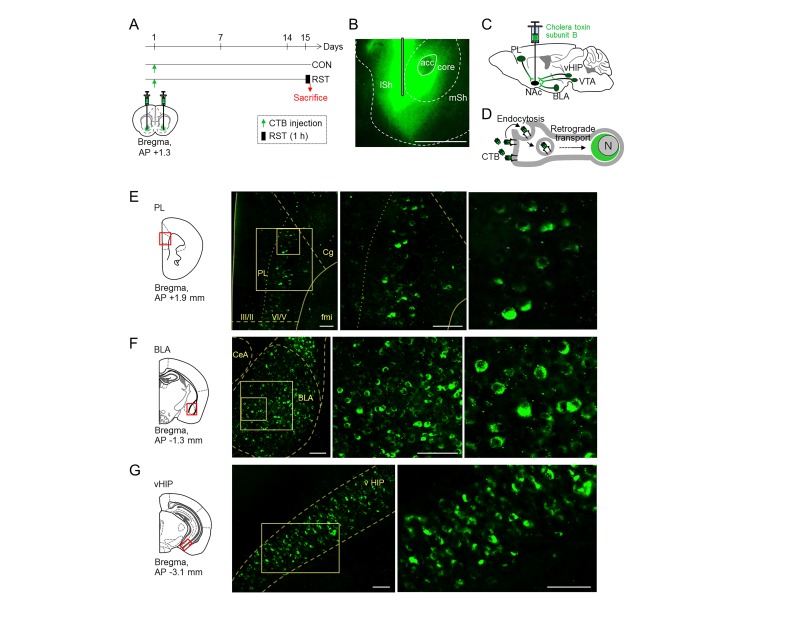
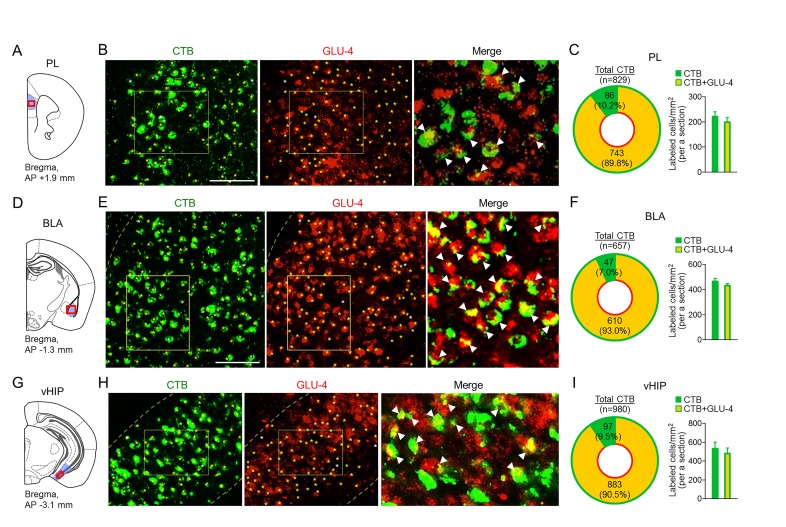
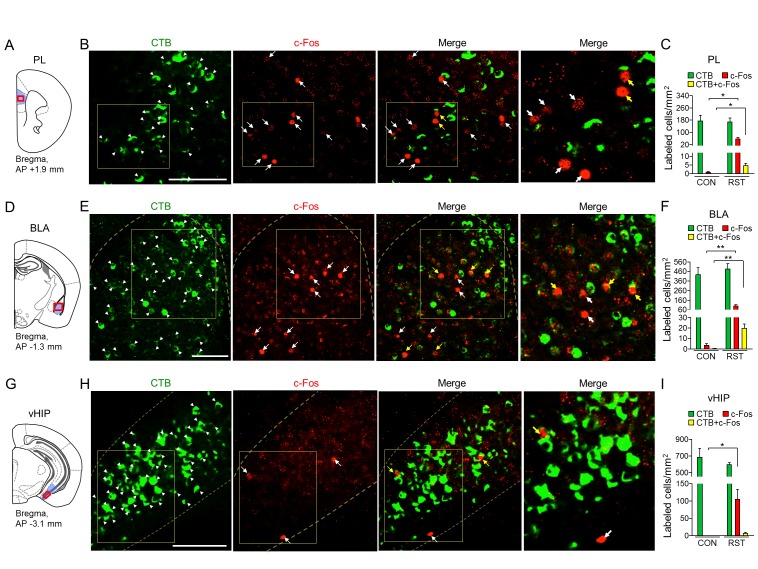
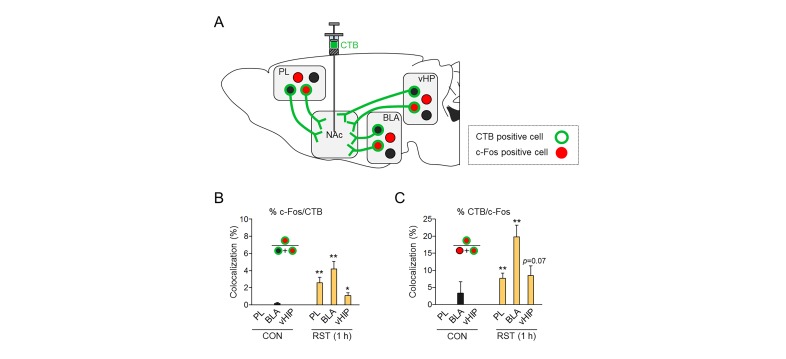
The nucleus accumbens (NAc) is the major component of the ventral striatum that regulates stress-induced depression. The NAc receives dopaminergic inputs from the ventral tegmental area (VTA), and the role of VTA-NAc neurons in stress response has been recently characterized. The NAc also receives glutamatergic inputs from various forebrain structures including the prelimbic cortex (PL), basolateral amygdala (BLA), and ventral hippocampus (vHIP), whereas the role of those glutamatergic afferents in stress response remains underscored. In the present study, we investigated the extent to which descending glutamatergic neurons activated by stress in the PL, BLA, and vHIP project to the NAc. To specifically label the input neurons into the NAc, fluorescent-tagged cholera toxin subunit B (CTB), which can be used as a retrograde neuronal tracer, was injected into the NAc. After two weeks, the mice were placed under restraint for 1 h. Subsequent histological analyses indicated that CTB-positive cells were detected in 170~680 cells/mm2 in the PL, BLA, and vHIP, and those CTB-positive cells were mostly glutamatergic. In the PL, BLA, and vHIP regions analyzed, stress-induced c-Fos expression was found in 20~100 cells/mm2. Among the CTB-positive cells, 2.6% in the PL, 4.2% in the BLA, and 1.1% in the vHIP were co-labeled by c-Fos, whereas among c-Fos-positive cells, 7.7% in the PL, 19.8% in the BLA, and 8.5% in the vHIP were co-labeled with CTB. These results suggest that the NAc receives a significant but differing proportion of glutamatergic inputs from the PL, BLA, and vHIP in stress response.

Keywords: Nucleus accumbens; Retrograde tracer; Stress; c-Fos.


Figures

Fig. 1
Fig. 1. Retrograde labeling of neurons projecting into the NAc. (A) Experimental design and time schedule for CTB injection (green arrows) into the NAc. After 14 days of the surgery, 1-h restraint was treated. Red arrow, time point for tissue preparation. CON, CTB-injected control mice; RST, CTB-injected and stress treated mice. (B, C) A fluorescence image (B) of Alexa-conjugated CTB (cholera toxin subunit B) expression in the lateral core and shell of the NAc 14 days after the surgery and a schematic diagram (C) of CTB injection (left panel). Projections from the prelimbic cortex (PL), ventral hippocampus (vHIP), ventral tegmental area (VTA), and basolateral amygdala (BLA) are indicated. acc, anterior commissures; core, NAc core; ISh, lateral shell of the NAc; mSH, medial shell of the NAc. Scale bar, 500 µm. (D) Schematic diagram illustrating endocytosis of CTB at the synaptic terminal and retrograde transport of fluorescent CTB along the axon and its translocation into the cell body region (adapted from [63, 64]). (E~G) CTB-positive cells in the PL (E), BLA (F), and vHIP (G). Schematic diagrams illustrating the coronal sections at the level of the PL (E), BLA (F), and vHIP (G). High magnification of the areas marked with a rectangle. Cg, cingulate cortex; fmi, anterior forceps minor of the corpus callosum; VI/V, cortical layers VI/V; II/III, cortical layers II/III; BLA, basolateral amygdala; CeA, central amygdala. Scale bars; 50 µm in the PL and BLA, and vHIP.
Fig. 2
Fig. 2. Most of CTB-positive cells in PL, BLA, and vHIP regions were stained by GLU-4, a glutamatergic neuron marker. (A~I) Schematic diagrams illustrating the coronal section of the PL (A), BLA (D), and vHIP (G), and the areas (filled blue area) analyzed for cells labeled by fluorescent-CTB (green) and anti-glutamate antibody (GLU-4, red). Fluorescence images showing cells labeled with CTB (green), or GLU-4 (red), and high magnification of an overlay (boxed areas, merged) in the PL (B), BLA (E), and vHIP (H). Quantification of CTB labeled cells, GLU-4 labeled cells, and CTB plus GLU-4 double-labeled cells in the PL (C), BLA (F), and vHIP (I). Venn diagrams showing the summed numbers of cells stained with CTB only (green) or CTB+GLU-4 (yellow) counted in the sections of PL (C), BLA (F), and vHIP (I) regions. Bar graphs showing the normalized mean number in mm2 of cells stained with CTB only (green) and double-labeled with CTB+GLU-4 (yellow) in the PL (C), BLA (F), and vHIP (I). n=4 animals for each region. *indicates cells stained with CTB or GLU-4. Arrow heads indicate cells stained with CTB and GLU-4. Scale bars; 50 µm in the PL and BLA, and 100 µm in the vHIP. All data are mean±SEM. Student's t-test.
Fig. 3
Fig. 3. Analyses of cells stained by the stimulation-dependent neural activity marker c-Fos and the retrograde tracer CTB in PL, BLA, and vHIP neurons. (A~I) Schematic diagrams illustrating the coronal section of the PL (A), BLA (D), and vHIP (G), the areas (filled blue area) analyzed for cells stained by c-Fos and/or fluorescent CTB, and high magnification (boxed areas). Fluorescence images showing cells labeled with CTB (green) or c-Fos (red), and high magnification of an overlay of CTB and c-Fos labeled cells (boxed area) in the PL (B), BLA (E), and vHIP (H). Arrow heads indicate CTB-positive cells and arrows indicate c-Fos-positive cells. Scale bars: Scale bars; 50 µm in the PL and BLA, and 100 µm in the vHIP. The examined sections of the PL were at the level of 1.95±0.01 mm (AP) from the bregma, those of the BLA were at −1.39±0.03 mm, and those of the vHIP were at −3.22±0.04 mm. The numbers of animals examined were n=3~4 animals for the PL, n=4~5 animals for the BLA, and n=3 animals each for the vHIP. Quantification of CTB labeled cells, c-Fos labeled cells, and CTB and c-Fos double-labeled cells in the PL (C), BLA (F), and vHIP (I) of control (CON) and restrained (RST) mice. All data are mean±SEM. *p<0.05, **p<0.01 (Student's t-test).
Fig. 4
Fig. 4. Proportion of neurons stained by c-Fos or CTB. (A) A schematic diagram illustrating PL, BLA, and vHIP neurons projecting to the NAc. Cells labeled by CTB (green line and circle) or expressing c-Fos protein (filled red circle). Fluorescent CTB was injected into the NAc. (B) Percentage of CTB-labeled cells that are c-Fos-positive in the PL, BLA, and vHIP in control (CON) and mice treated with 1-h restraint (RST). (C) Percentage of c-Fos-positive cells that were also CTB-labeled in the PL, vHIP, and BLA. All data are mean±SEM (n=3~5 animals for each region). *p<0.05, **p<0.01 (Student's t-test).

Similar articles

Cited by

References

    1. Russo SJ, Nestler EJ. The brain reward circuitry in mood disorders. Nat Rev Neurosci. 2013;14:609–625. - PMC - PubMed
    1. Floresco SB. The nucleus accumbens: an interface between cognition, emotion, and action. Annu Rev Psychol. 2015;66:25–52. - PubMed
    1. Beier KT, Steinberg EE, DeLoach KE, Xie S, Miyamichi K, Schwarz L, Gao XJ, Kremer EJ, Malenka RC, Luo L. Circuit architecture of VTA dopamine neurons revealed by systematic input-output mapping. Cell. 2015;162:622–634. - PMC - PubMed
    1. Aransay A, Rodríguez-López C, García-Amado M, Clascá F, Prensa L. Long-range projection neurons of the mouse ventral tegmental area: a single-cell axon tracing analysis. Front Neuroanat. 2015;9:59. - PMC - PubMed
    1. Britt JP, Benaliouad F, McDevitt RA, Stuber GD, Wise RA, Bonci A. Synaptic and behavioral profile of multiple glutamatergic inputs to the nucleus accumbens. Neuron. 2012;76:790–803. - PMC - PubMed