. 2018 Oct 31:9:2447.
doi: 10.3389/fmicb.2018.02447. eCollection 2018.

PGE2 Augments Inflammasome Activation and M1 Polarization in Macrophages Infected With Salmonella Typhimurium and Yersinia enterocolitica

Affiliations

PGE2 Augments Inflammasome Activation and M1 Polarization in Macrophages Infected With Salmonella Typhimurium and Yersinia enterocolitica

Austin E F Sheppe et al. Front Microbiol. .

Abstract

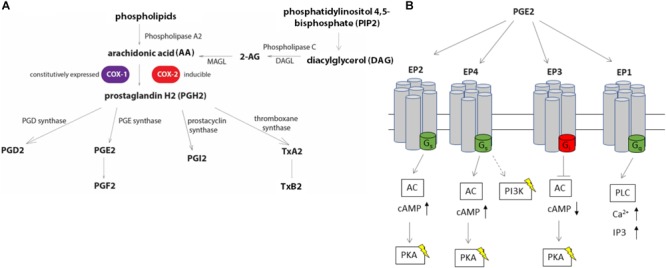
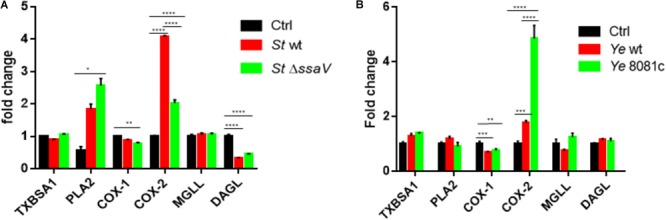
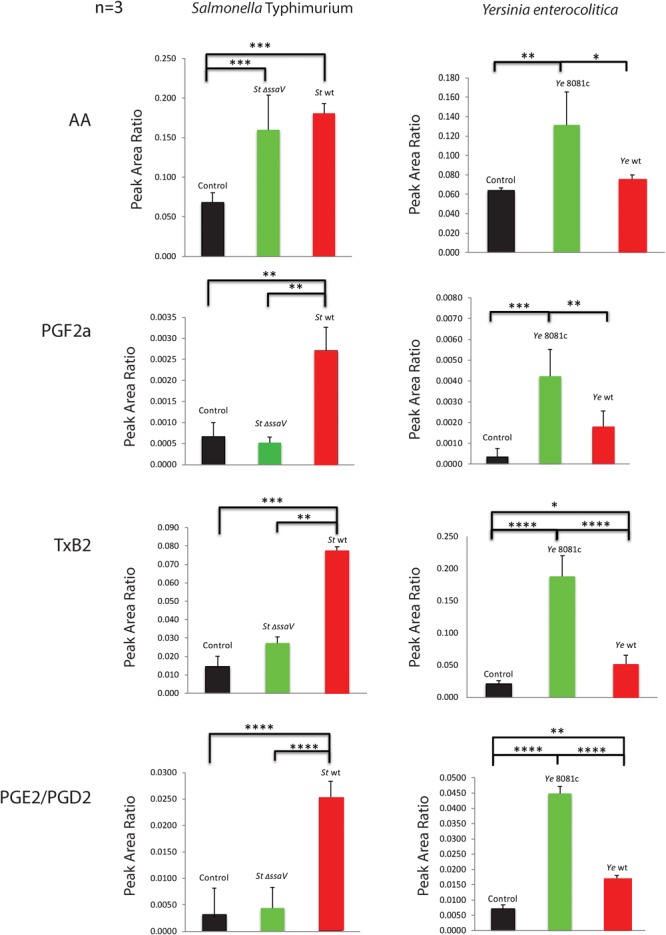
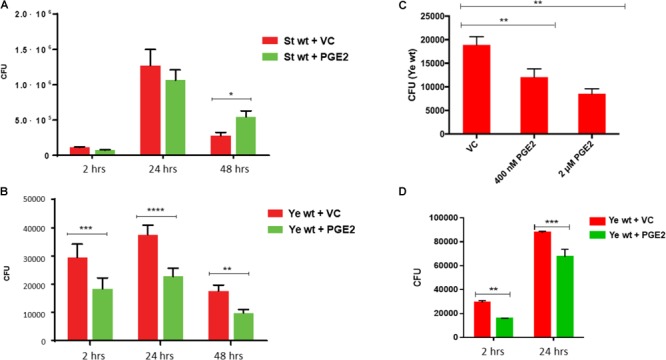
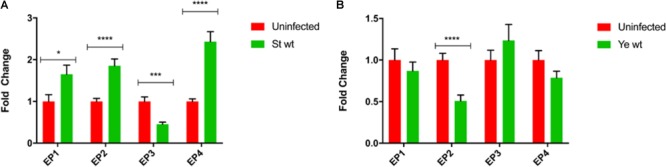
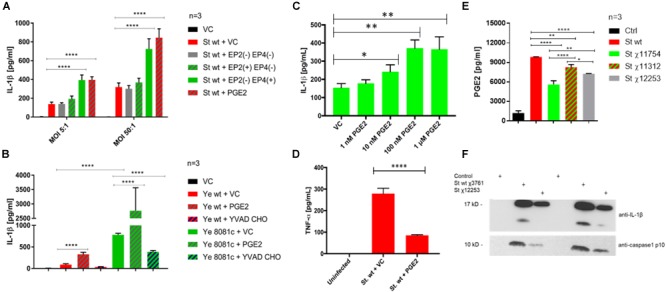
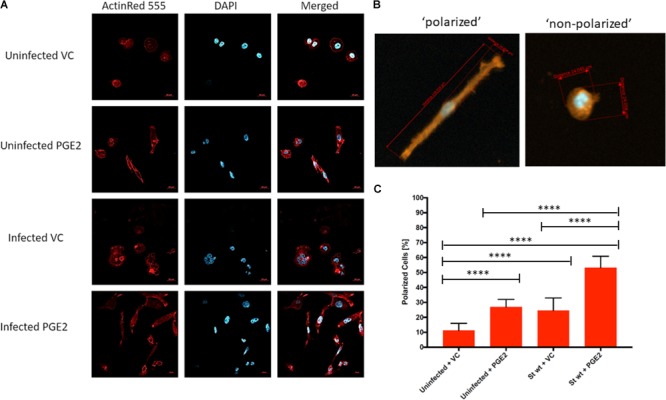
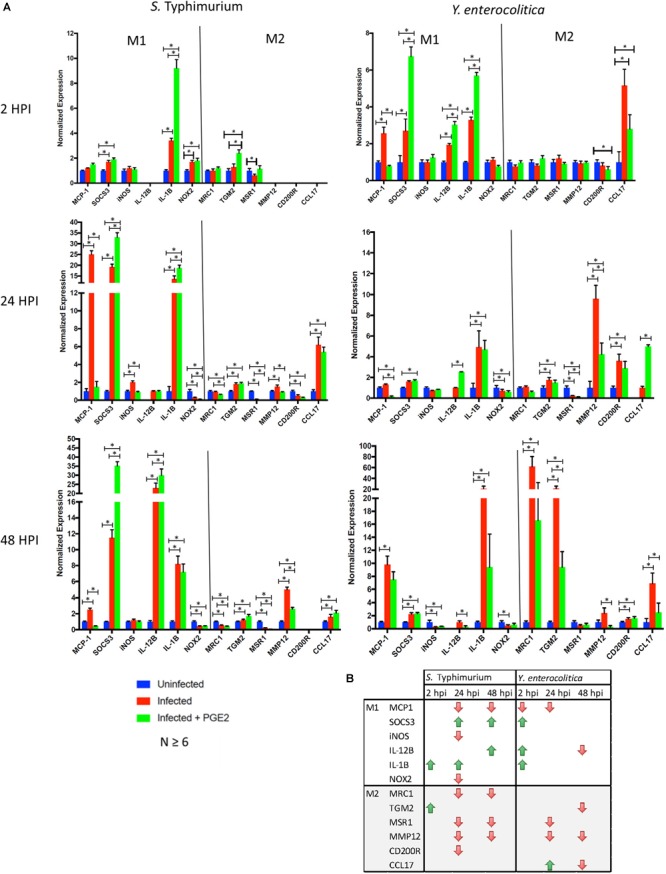
Eicosanoids are cellular metabolites, which shape the immune response, including inflammatory processes in macrophages. The effects of these lipid mediators on inflammation and bacterial pathogenesis are not clearly understood. Certain eicosanoids are suspected to act as molecular sensors for the recruitment of neutrophils, while others regulate bacterial uptake. In this study, gene expression analyses indicated that genes involved in eicosanoid biosynthesis including COX-1, COX-2, DAGL, and PLA-2 are differentially regulated in THP-1 human macrophages infected with Salmonella enterica Typhimurium or Yersinia enterocolitica. By using targeted metabolomics approach, we found that the eicosanoid precursor, arachidonic acid (AA) as well as its derivatives, including prostaglandins (PGs) PGF2α or PGE2/PGD2, and thromboxane TxB2, are rapidly secreted from macrophages infected with these Gram-negative pathogenic bacteria. The magnitude of eicosanoid biosynthesis in infected host cells depends on the presence of virulence factors of Y. enterocolitica and S. Typhimurium strains, albeit in an opposite way in Y. enterocolitica compared to S. Typhimurium infection. Trials with combinations of EP2/EP4 PGE2 receptor agonists and antagonists suggest that PGE2 signaling in these infection models works primarily through the EP4 receptor. Downstream of EP4 activation, PGE2 enhances inflammasome activation and represses M2 macrophage polarization while inducing key M1-type markers. PGE2 also led to a decreased numbers of Y. enterocolitica within macrophages. To summarize, PGE2 is a potent autocrine/paracrine activator of inflammation during infection in Gram-negative bacteria, and it affects macrophage polarization, likely controlling bacterial clearance by macrophages.

Keywords: Salmonella enterica Typhimurium; Yersinia enterocolitica; eicosanoids; inflammasome; macrophage polarization.


Figures

FIGURE 1
FIGURE 1
Eicosanoid biosynthesis and PGE2 signaling via EP receptors. (A) Biosynthesis of eicosanoids relies on the release of free arachidonic acid (AA) from membrane phospholipids via phospholipase A2 (PLA-2) or conversion of diacylglycerol to AA through phospholipase C (PLC). An alternative source of AA includes 2-arachidonoylglycerol (2-AG). AA is converted to prostaglandin H2 (PGH2) via the action of COX enzymes, COX-1 and COX-2. PGH2 can be converted to other derivatives, including PGE2 by PGE synthases. (B) PGE2 stimulates at least four different G-protein coupled receptors (EP1, EP2, EP3, and EP4). Stimulation of EP2 and EP4 receptors lead to an increase in intracellular cAMP levels by conversion of ATP to cAMP by adenylate cyclase (AC), while EP3 decreases intracellular cAMP levels by binding to the inhibitory G-protein subunit to AC upon PGE2 stimulation. The EP4 receptor stimulates PI3K pathway independent of cAMP, such as by modulating gene expression via NF-κB. EP1 activity is linked to the mobilization of intracellular Ca2+ by activating the phospholipase C pathway.
FIGURE 2
FIGURE 2
Eicosanoid biosynthetic genes are upregulated upon infection with S. Typhimurium or Y. enterocolitica. Targeted RT-PCR of eicosanoid biosynthetic genes was performed on THP-1-derived macrophages either uninfected/infected with S. Typhimurium (A) or Y. enterocolitica (B) for 2 h at an MOI of 50:1. For comparison, isogenic strains of S. Typhimurium lacking the T3SS (ΔssaV) and Y. enterocolitica lacking the pYV virulence plasmid (8081c) were used to infect THP-1 cells. Two-step RT-PCR was performed on a Stratagene MXP3005 using SYBRGreen reagents. Fold change was calculated using the ΔΔCt method. Two-way ANOVA along with Tukey’s post hoc tests were used to calculate significance (N = 3). p-values were indicated as follows: p ≤ 0.05; ∗∗p ≤ 0.01; ∗∗∗p ≤ 0.001; ∗∗∗∗p ≤ 0.0001.
FIGURE 3
FIGURE 3
Levels of eicosanoids secreted into culture medium by macrophages infected with S. Typhimurium or Y. enterocolitica. Triple quadrupole mass spectrometry-based targeted metabolomics study was performed on cell culture supernatants of THP-1 macrophages infected with S. Typhimurium or Y. enterocolitica for 2 h at an MOI of 50:1. The media extracts were analyzed for AA, PGF, TxB2, and PGE2/PGD2, and relative abundance was calculated using internal standards (N = 3). Significance was calculated by using Student’s t-test. p-values were indicated as follows: p ≤ 0.05; ∗∗p ≤ 0.01; ∗∗∗p ≤ 0.001; ∗∗∗∗p ≤ 0.0001.
FIGURE 4
FIGURE 4
Effect of PGE2 on bacterial load during infection with Salmonella Typhimurium or Yersinia enterocolitica. THP-1 macrophages (2.5 × 10⁵) were infected with (A) wild-type Salmonella or (B), (C) wild-type Yersinia (MOI of 50:1) in the presence or absence of PGE2. At the indicated times post-infection, macrophages were lysed with 0.1% Triton-X, diluted, and dilutions were plated on LB agar plates. A dose–response curve was generated by pretreating THP-1 macrophages with varying concentrations of PGE2 before infection with Y. enterocolitica, and then the resulting CFUs were measured 2 hpi (C). Similarly to (B), uptake and survival of Y. enterocolitica in HeLa cells was also evaluated (D). Results are represented as the mean ± SD of at least three identical wells across three independent experiments. Significance denoted by was calculated using Student’s t-test with p < 0.05. p-values were indicated as follows: p ≤ 0.05; ∗∗p ≤ 0.01; ∗∗∗p ≤ 0.001; ∗∗∗∗p ≤ 0.0001.
FIGURE 5
FIGURE 5
Transcript analysis of PGE2 receptors in THP-1 macrophages during S. Typhimurium and Y. enterocolitica infection. THP-1 macrophages (2.5 × 10⁵) were infected for 2 h with (A) S. Typhimurium or (B) Y. enterocolitica at an MOI of 50:1. Total RNA was extracted using a PureLink RNA mini kit, and cDNA was generated using the iScript system (Bio-Rad). RT-PCR was performed using SYBR green on a CFX96 Real-Time System (Bio-Rad) targeting prostanoid receptors EP1, EP2, EP3, EP4, and GAPDH as a reference gene. Resulting data were then normalized to GAPDH mRNA levels, and uninfected samples served as a baseline for fold change determination using the ΔΔCt method. Resulting data is representative of three biological replicates and three technical replicates and represents the mean fold change ± SD. One-way ANOVA test with Tukey’s multiple testing correction was used to establish statistical significance. p-values were indicated as follows: p ≤ 0.05; ∗∗p ≤ 0.01; ∗∗∗p ≤ 0.001; ∗∗∗∗p ≤ 0.0001.
FIGURE 6
FIGURE 6
PGE2 signaling and effects on inflammasome activation in S. Typhimurium and Y. enterocolitica infections. THP-1 macrophages (2.5 × 10⁵) were pre-treated with combinations of PGE2 (2 μM), PF04418948 [EP2(–), EP2 antagonist, 200 nM], L-161,982 [EP4(–), EP4 antagonist, 200 nM], Butaprost [EP2(+), EP2 agonist, 10 μM], L-902,688 [EP4(+), EP4 agonist, 1 μM], or YVAD-CHO (caspase-1 inhibitor, 1 μM) at 2 h prior to infection. The levels of IL-1β (A–C) and TNF-α (D) in cell culture supernatant from S. Typhimurium- (A,C,D) or Y. enterocolitica- (B) infected macrophages were measured via ELISA 2 hpi. One-way ANOVA test with Tukey’s multiple testing correction was used to establish statistical significance. p-values were indicated as follows: p ≤ 0.05; ∗∗p ≤ 0.01; ∗∗∗p ≤ 0.001; ∗∗∗∗p ≤ 0.0001. (E,F) PGE2 and IL-1β release from THP-1 macrophages infected with S. Typhimurium strains. THP-1 cells were infected with indicated strains (Table 1) of wild-type S. Typhimurium (MOI 50:1, 2 hpi). PGE2 in cell culture supernatant was measured by Prostaglandin E2 ELISA Kit (Cayman Chemical, United States) and the results were displayed in GraphPad. One-way ANOVA test with Tukey’s multiple testing correction was used to establish statistical significance. p-values were indicated as follows: p ≤ 0.05; ∗∗p ≤ 0.01; ∗∗∗p ≤ 0.001; ∗∗∗∗p ≤ 0.0001. (E) Cell culture supernatant was resolved on SDS-PAGE; IL-1β and caspase-1 p10 active form were visualized by western blotting (F).
FIGURE 7
FIGURE 7
Effect of PGE2 on macrophage morphology in S. Typhimurium-infected THP-1 macrophages. THP-1 macrophages (1.5 × 10⁶) were pre-treated with PGE2 (2 μM) or equal (v/v%) concentration of ethanol vehicle control for 2 h before infection with wild-type S. Typhimurium (MOI of 50:1, 48 hpi). Cells were then fixed, permeabilized, and stained for the actin cytoskeleton (ActinRed 555, red) and nucleus (DAPI, blue) (A). Polarized cells were determined by having a length to diameter ratio of at least 2:1. Approximately 30 cells were counted from five replicates for a total of 150 cells per treatment (Supplementary Table S1) (B). The number of polarized cells was counted and displayed as a percentage. Approximately 30 cells were counted from five replicates for a total of 150 cells per treatment. ANOVA test with Tukey’s multiple testing correction was used to establish statistical significance (C). p-values were indicated as follows: p ≤ 0.05; ∗∗p ≤ 0.01; ∗∗∗p ≤ 0.001; ∗∗∗∗p ≤ 0.0001.
FIGURE 8
FIGURE 8
Effects of PGE2 on macrophage polarization. (A,B). THP-1 macrophages were pre-treated with PGE2 (2 μM) or equal (v/v%) concentration of ethanol vehicle control for 2 h before infection with wild-type S. Typhimurium or Y. enterocolitica (MOI of 50:1, times as displayed in figures). Transcripts analysis of polarization targets in human THP-1 macrophages were measured by RT-(q)PCR (n = 6 or higher). Reference genes were determined experimentally for each time point from a set of four potential genes. A single reference gene (RPL37A, GAPDH or TBP) was used for all trials at the indicated time point. (B) Down- or upregulation of the transcripts in PGE2-treated infected cells compared to vehicle-treated infected cells is shown. p-values were indicated as follows: p ≤ 0.05; ∗∗p ≤ 0.01; ∗∗∗p ≤ 0.001; ∗∗∗∗p ≤ 0.0001.
FIGURE 9
FIGURE 9
Model of the effects of PGE2 secretion during infection with Gram-negative bacteria S. Typhimurium and Y. enterocolitica. Bacterial pathogens can stimulate the production of PGE2 from AA by activating COX-2 via TLR-LPS signaling or through other virulence factors such as Salmonella SpiC or Yersinia YopM. PGE2 is secreted and acts locally on EP2/EP4 receptors to repress M2 macrophage gene transcription by SOCS3. PGE2 increases IL-1β and IL-12βp40 transcription. The immature IL-1β is converted to mature IL-1β by activated caspase-1 during inflammasome activation and secreted into the environment. Inflammasomes can be stimulated or inhibited by specific bacterial components and virulence factors such as bacterial flagellin, or by YopM/SopB in Y. enterocolitica and S. Typhimurium, respectively.

Similar articles

Cited by

References

    1. Alhouayek M., Muccioli G. G. (2014). COX-2-derived endocannabinoid metabolites as novel inflammatory mediators. Trends Pharmacol. Sci. 35 284–292. 10.1016/j.tips.2014.03.001 - DOI - PubMed
    1. Alugubelly N., Hercik K., Kibler P., Nanduri B., Edelmann M. J. (2016). Analysis of differentially expressed proteins in Yersinia enterocolitica-infected HeLa cells. Biochim. Biophys. Acta 1864 562–569. 10.1016/j.bbapap.2016.02.004 - DOI - PMC - PubMed
    1. Anderson L., Seilhamer J. (1997). A comparison of selected mRNA and protein abundances in human liver. Electrophoresis 18 533–537. 10.1002/elps.1150180333 - DOI - PubMed
    1. Antunes L. C., Arena E. T., Menendez A., Han J., Ferreira R. B., Buckner M. M., et al. (2011). Impact of Salmonella infection on host hormone metabolism revealed by metabolomics. Infect Immun. 79 1759–1769. 10.1128/IAI.01373-10 - DOI - PMC - PubMed
    1. Beuzón C. R., Méresse S., Unsworth K. E., Ruíz-Albert J., Garvis S., Waterman S. R., et al. (2000). Salmonella maintains the integrity of its intracellular vacuole through the action of SifA. EMBO J. 19 3235–3249. 10.1093/emboj/19.13.3235 - DOI - PMC - PubMed

LinkOut - more resources