

FLO1, FLO5 and FLO11 Flocculation Gene Expression Impacts Saccharomyces cerevisiae Attachment to Penicillium chrysogenum in a Co-immobilization Technique
- PMID: 30429833
- PMCID: PMC6220091
- DOI: 10.3389/fmicb.2018.02586
FLO1, FLO5 and FLO11 Flocculation Gene Expression Impacts Saccharomyces cerevisiae Attachment to Penicillium chrysogenum in a Co-immobilization Technique
Abstract
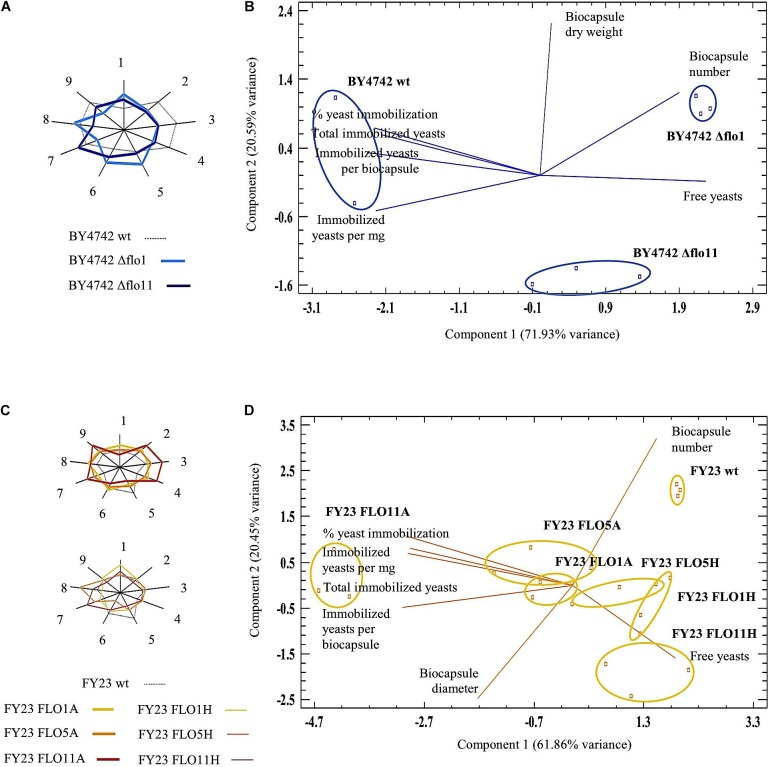
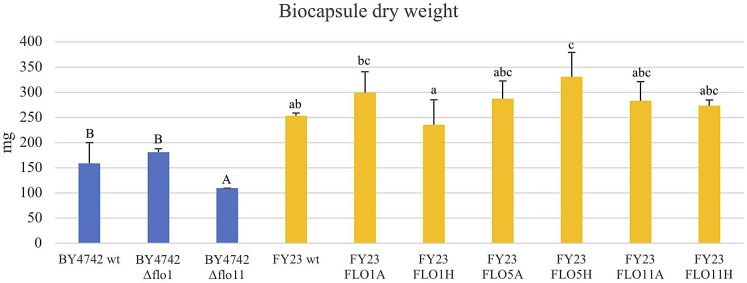
A reoccurring flaw of most yeast immobilization systems that limits the potential of the technique is leakage of the cells from the matrix. Leakage may be due to weakly adherent cells, deterioration of the matrix, or to new growth and loss of non-adherent daughter cells. Yeast biocapsules are a spontaneous, cost effective system of immobilization whereby Saccharomyces cerevisiae cells are attached to the hyphae of Penicillium chrysogenum, creating hollow spheres that allow recovery and reutilization. This attachment is based on naturally occurring adherent properties of the yeast cell surface. We hypothesized that proteins associated with flocculation might play a role in adherence to fungal hyphae. To test this hypothesis, yeast strains with overexpressed and deleted flocculation genes (FLO1, FLO5, and FLO11) were evaluated for biocapsule formation to observe the impact of gene expression on biocapsule diameter, number, volume, dry mass, and percent immobilized versus non-immobilized cells. Overexpression of all three genes enhanced immobilization and resulted in larger diameter biocapsules. In particular, overexpression of FLO11 resulted in a five fold increase of absorbed cells versus the wild type isogenic strain. In addition, deletion of FLO1 and FLO11 significantly decreased the number of immobilized yeast cells compared to the wild type BY4742. These results confirm the role of natural adherent properties of yeast cells in attachment to fungal hyphae and offer the potential to create strongly adherent cells that will produce adherent progeny thereby reducing the potential for cell leakage from the matrix.
Keywords: FLO gene; Penicillium chrysogenum; Saccharomyces cerevisiae; co-immobilization; flocculation.
Figures


Similar articles
-
FLO5 gene controls flocculation phenotype and adhesive properties in a Saccharomyces cerevisiae sparkling wine strain.Sci Rep. 2017 Sep 7;7(1):10786. doi: 10.1038/s41598-017-09990-9. Sci Rep. 2017. PMID: 28883485 Free PMC article.
-
Controlled expression of the dominant flocculation genes FLO1, FLO5, and FLO11 in Saccharomyces cerevisiae.Appl Environ Microbiol. 2008 Oct;74(19):6041-52. doi: 10.1128/AEM.00394-08. Epub 2008 Aug 15. Appl Environ Microbiol. 2008. PMID: 18708514 Free PMC article.
-
Genetic diversity of FLO1 and FLO5 genes in wine flocculent Saccharomyces cerevisiae strains.Int J Food Microbiol. 2014 Nov 17;191:45-52. doi: 10.1016/j.ijfoodmicro.2014.08.028. Epub 2014 Aug 28. Int J Food Microbiol. 2014. PMID: 25218464
-
New insights on yeast and filamentous fungus adhesion in a natural co-immobilization system: proposed advances and applications in wine industry.Appl Microbiol Biotechnol. 2019 Jun;103(12):4723-4731. doi: 10.1007/s00253-019-09870-4. Epub 2019 May 11. Appl Microbiol Biotechnol. 2019. PMID: 31079167 Review.
-
Yeast flocculation: what brewers should know.Appl Microbiol Biotechnol. 2003 May;61(3):197-205. doi: 10.1007/s00253-002-1200-8. Epub 2003 Jan 25. Appl Microbiol Biotechnol. 2003. PMID: 12698276 Review.
Cited by
-
Yeast cell vacuum infusion into fungal pellets as a novel cell encapsulation methodology.Appl Microbiol Biotechnol. 2023 Sep;107(18):5715-5726. doi: 10.1007/s00253-023-12681-3. Epub 2023 Jul 25. Appl Microbiol Biotechnol. 2023. PMID: 37490127 Free PMC article.
-
Screening and In Silico Analyses of the Yeast Saccharomyces cerevisiae Σ1278b Bank Mutants Using Citral as a Natural Antimicrobial.Foods. 2024 May 8;13(10):1457. doi: 10.3390/foods13101457. Foods. 2024. PMID: 38790757 Free PMC article.
-
Chitosan modulates Pochonia chlamydosporia gene expression during nematode egg parasitism.Environ Microbiol. 2021 Sep;23(9):4980-4997. doi: 10.1111/1462-2920.15408. Epub 2021 Feb 5. Environ Microbiol. 2021. PMID: 33496078 Free PMC article.
-
Heterologous Expression of CFL1 Confers Flocculating Ability to Cutaneotrichosporon oleaginosus Lipid-Rich Cells.J Fungi (Basel). 2022 Dec 11;8(12):1293. doi: 10.3390/jof8121293. J Fungi (Basel). 2022. PMID: 36547626 Free PMC article.
-
Nano-enhanced biocarriers: ferric oxide-modified chitosan and calcium alginate beads for improved fermentation efficiency and reusability in a bubble column bioreactor.Biotechnol Lett. 2025 Jun 29;47(4):70. doi: 10.1007/s10529-025-03611-6. Biotechnol Lett. 2025. PMID: 40581879 Free PMC article.
References
-
- Behera S., Arora R., Nandhagopal N., Kumar S. (2014). Importance of chemical pretreatment for bioconversion of lignocellulosic biomass. Renew. Sustain. Energy Rev. 36 91–106. 10.1016/j.rser.2014.04.047 - DOI
-
- Bony M., Barre P., Blondin B. (1998). Distribution of the flocculation protein, Flop, at the cell surface during yeast growth: the availability of Flop determines the flocculation level. Yeast 14 25–35. - PubMed
-
- Donalies U. E., Stahl U. (2001). Phase-specific gene expression in Saccharomyces cerevisiae, using maltose as carbon source under oxygen-limiting conditions. Curr. Genet. 39 150–153. - PubMed
LinkOut - more resources
Full Text Sources
Molecular Biology Databases