. 2018 Oct 31:9:2626.
doi: 10.3389/fmicb.2018.02626. eCollection 2018.

Contribution of Host Genetics to the Variation of Microbial Composition of Cecum Lumen and Feces in Pigs

Affiliations

Contribution of Host Genetics to the Variation of Microbial Composition of Cecum Lumen and Feces in Pigs

Congying Chen et al. Front Microbiol. .

Abstract

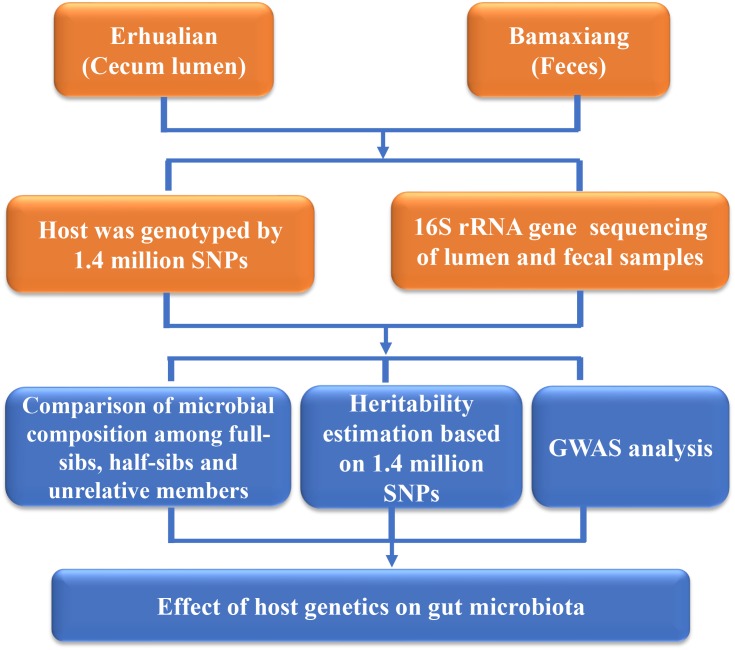
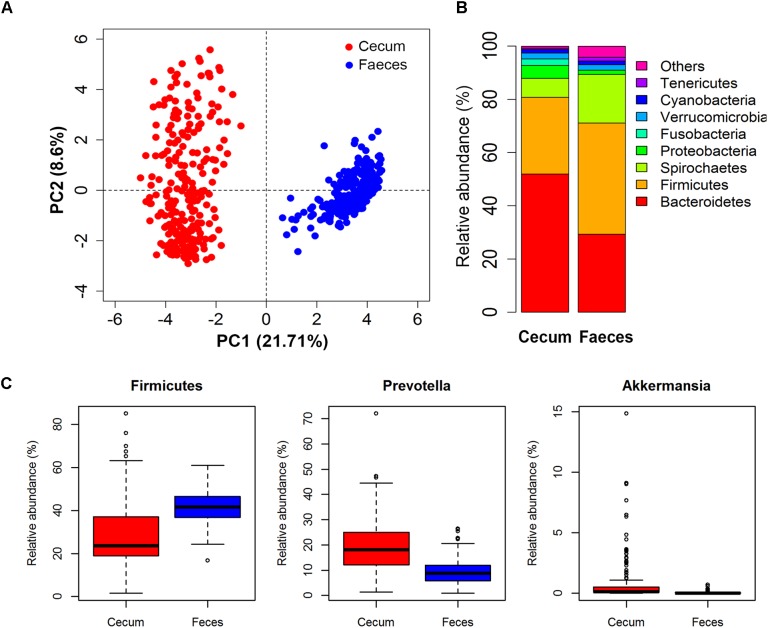
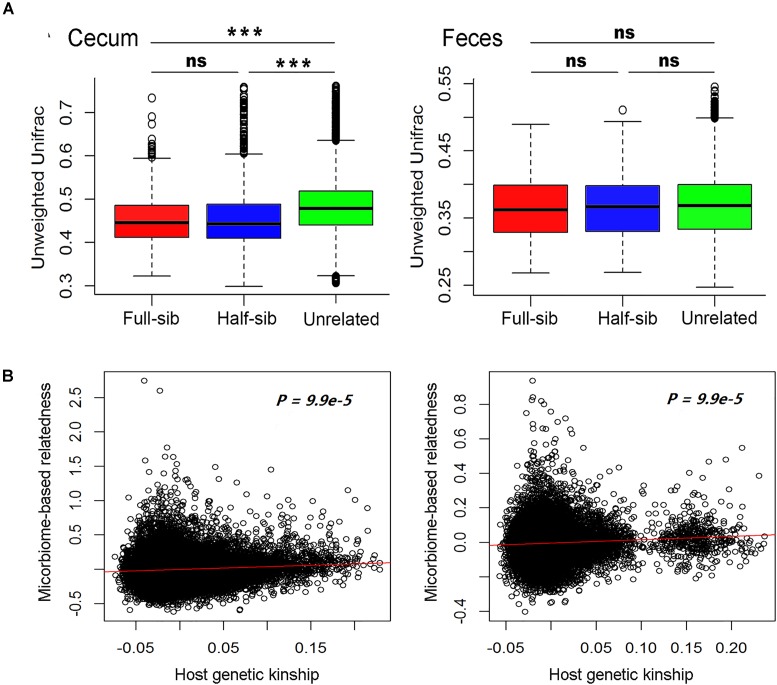
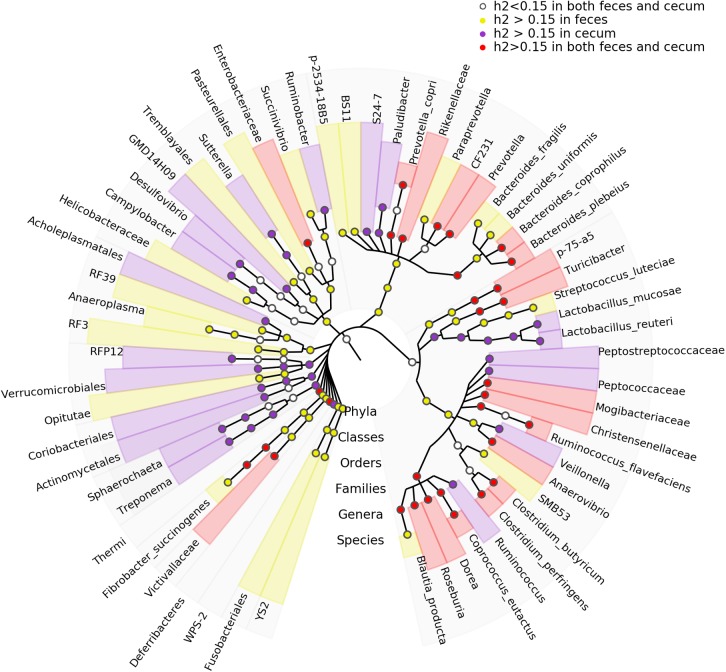
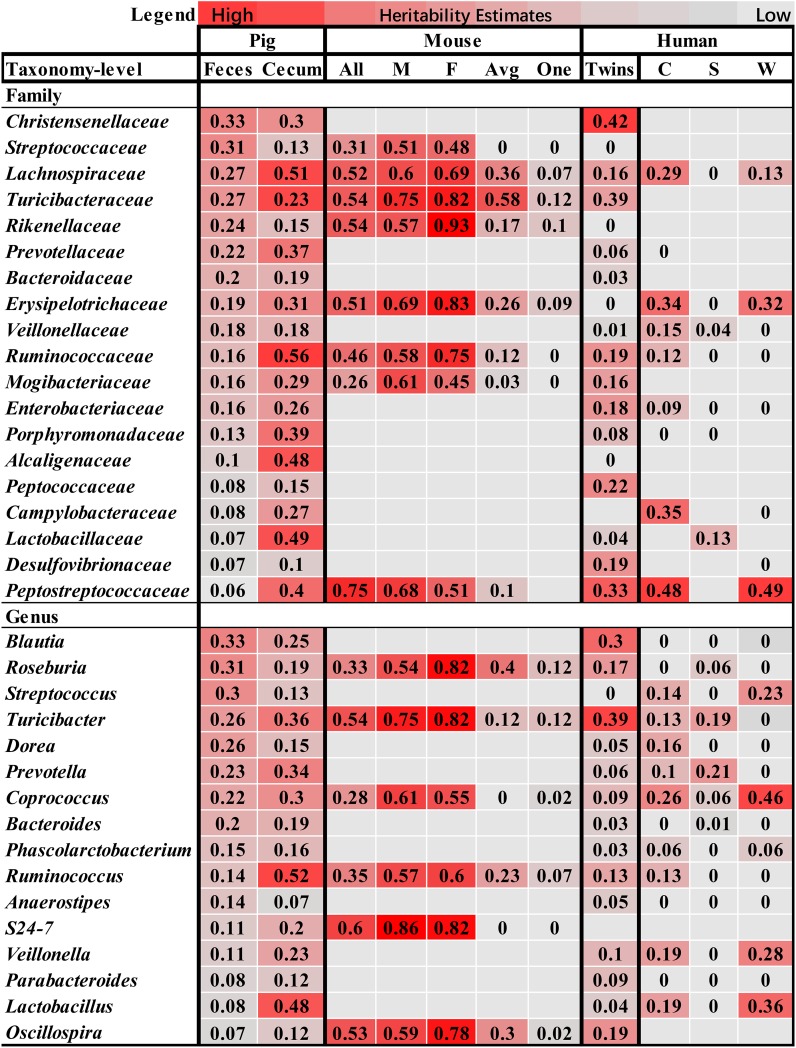
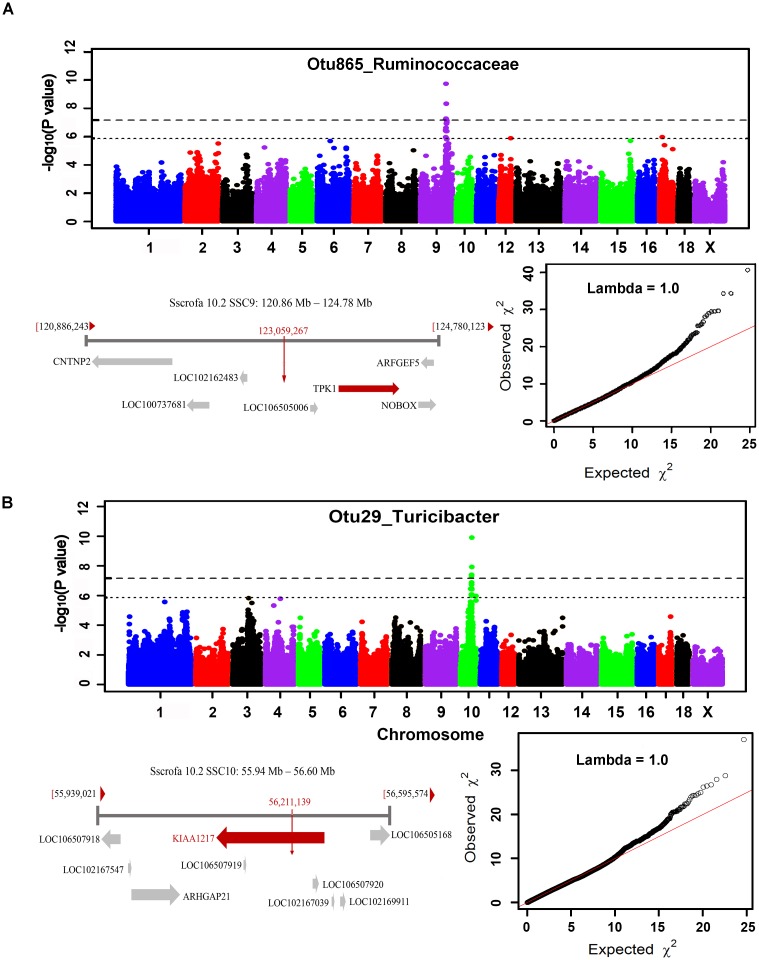
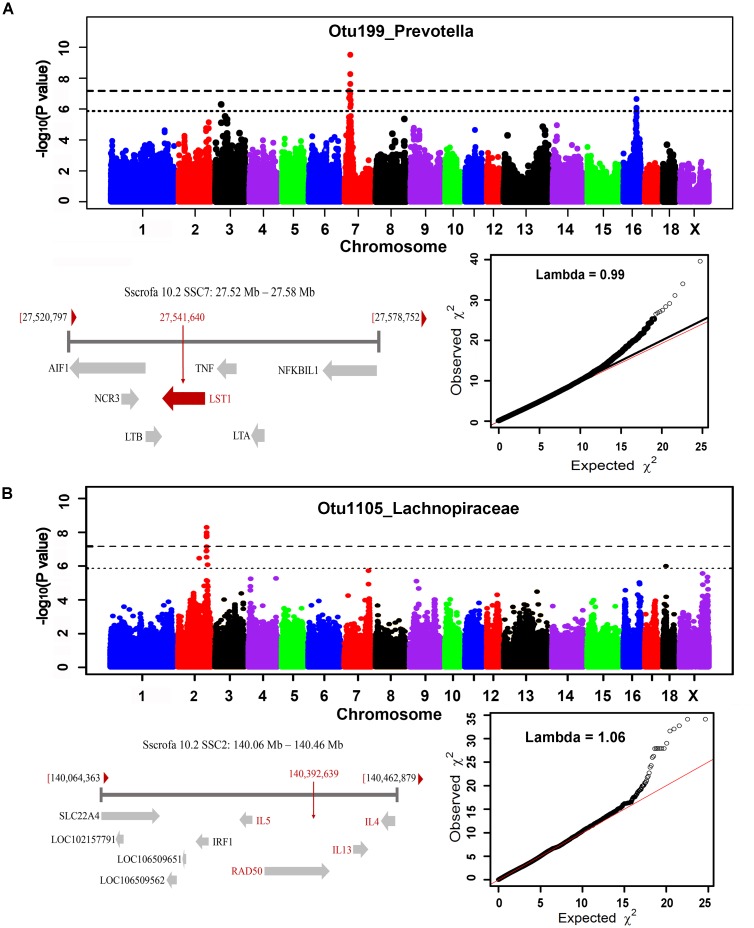
Pigs are a perfect model for studying the interaction between host genetics and gut microbiome due to the high similarity of gastrointestine and digestive system with humans, and the easily controlled feeding conditions. In this study, two pig populations which were raised in uniformed farm conditions and provided with the same commercial formula diet were used as the experimental animals. A systematical investigation of host genetic effect on the gut microbial composition was separately performed in porcine cecum lumen and feces samples through the comparison of microbial composition among full-sibs, half-sibs and unrelated members, heritability estimate (h 2), and genome-wide association study (GWAS). The results showed that full-sib members had a higher similarity of microbial composition than unrelated individuals. A significant correlation was observed between the microbial composition-based kinship and the host SNP-based kinship in both populations (P < 9.9 × 10⁻⁵). We identified 81 and 67 microbial taxa having h 2 > 0.15 in fecal and cecum luminal samples, respectively, including 31 taxa with h 2 > 0.15 in both types of samples. GWAS identified 40 and 34 significant associations between host genomic loci and the abundance or presence/absence of bacterial taxa in the fecal and cecum luminal samples. Functional classifications of host candidate genes related to microbial taxa are mainly associated with metabolism, immunity functions and response, and signal transduction. The high similarity of heritable taxa and functional categories of candidate genes among pig, human and mouse suggests the similar mechanism of the host genetic effect on gut microbiome across mammalian species. The results from this study provided another evidence that host genetics contributes significantly to the gut microbiome.

Keywords: candidate gene; genome-wide association study; gut microbiota; heritability estimate; host genetics; pigs.


Figures

FIGURE 1
FIGURE 1
Flowchart depicting the experimental design for studying the host genetic effect on gut microbial composition in pigs.
FIGURE 2
FIGURE 2
Comparison of the microbial composition between two types of samples and among individuals within population with 16S rRNA gene sequencing data. (A) PCA analysis showed great difference of microbial composition between cecum lumen and feces; (B) Comparison of microbial composition at the phylum level; and (C) Distribution of relative abundances of bacterial genera among individuals. Samples/bacterial genera are represented along the horizontal axis, and relative abundance is denoted by the vertical axis.
FIGURE 3
FIGURE 3
Host genetic effect on microbial compositions of cecum lumen and feces. (A) Comparison of the phylogenetic diversity of microbial composition among full-sib pairs, half-sib pairs and unrelated individuals by Unweighted Unifrac analysis. Full-sib pairs showed a higher similarity of microbial composition than unrelated individuals in both Erhualian (EHL) and Bamaxiang (BMX). The analysis was performed by QIIME (v 1.9). (B) Host genetic kinship calculated from host genome data (x-axis) is correlated with the microbial composition-based kinship (y-axis). In the panels, solid red lines represent a linear regression fit to the data.
FIGURE 4
FIGURE 4
Taxonomic representation of heritable bacteria taxa. The central dot in cladogram represents kingdom; each successive circle moving outward is one step lower phylogenetically. The phylogenic relationships of the taxa were obtained by the RDP database (Release 11.4). The circles showing different colors represent the taxa with different strength of heritability in cecum lumen and feces as measured by h2.
FIGURE 5
FIGURE 5
Comparison of the heritability of microbial taxa among pig, human and mouse. The color gradient over the heritability estimates ranges from the lowest heritability estimate (white) to the highest heritability estimate (red) in the given study. The heritability estimates in mouse were obtained from the studies reported by Org et al. (2015b), in which heritability was estimated using all mice (All), male (M), female (F), an average per strain (Avg) and a single mouse per strain (One), and O’Connor et al. (2014). The estimates in human were referred to the studies by Goodrich et al. (2016a), and Davenport et al. (2015), in which the heritability was estimated in the Winter (W), Summer (S), and seasons combined dataset (C).
FIGURE 6
FIGURE 6
GWAS results and candidate gene annotation for Ruminococcaceae (A) and Turicibacter (B). For Manhattan plots, X-axis shows chromosomal positions. Y-axis shows –log10 P-values from GWAS. The horizontal dotted lines indicate the thresholds of genome-wide and suggestive significance level. Candidate gene closest to the top SNP for each locus was identified based on Porcine reference genome assembly 10.2 in Ensemble. The red vertical lines indicate the positions of the top SNPs. The red horizontal arrow bar represents the closest gene.
FIGURE 7
FIGURE 7
MHC region on SSC7 (A) and interleukin gene family region on SSC2 (B) that were identified to associate Prevotella and Lachnospiraceae. For Manhattan plots, X-axis shows chromosomal positions. Y-axis shows –log10 P-values from GWAS. The horizontal dotted lines indicate the thresholds of genome-wide and suggestive significance level. The red horizontal arrow bar represents the closest gene.

References

    1. Aulchenko Y. S., Ripke S., Isaacs A., van Duijn C. M. (2007). GenABEL: an R library for genome-wide association analysis. Bioinformatics 23 1294–1296. 10.1093/bioinformatics/btm108 - DOI - PubMed
    1. Benjamini Y., Hochberg Y. (1995). Controlling the false discovery rate: a practical and powerful approach to multiple testing. J. R. Stat. Soc. Ser. B 57 289–300.
    1. Benson A. K., Kelly S. A., Legge R., Ma F., Low S. J., Kim J., et al. (2010). Individuality in gut microbiota composition is a complex polygenic trait shaped by multiple environmental and host genetic factors. Proc. Natl. Acad. Sci. U.S.A. 107 18933–18938. 10.1073/pnas.1007028107 - DOI - PMC - PubMed
    1. Blekhman R., Goodrich J. K., Huang K., Sun Q., Bukowski R., Bell J. T., et al. (2015). Host genetic variation impacts microbiome composition across human body sites. Genome Biol. 16:191. 10.1186/s13059-015-0759-1 - DOI - PMC - PubMed
    1. Bonder M. J., Kurilshikov A., Tigchelaar E. F., Mujagic Z., Imhann F., Vila A. V., et al. (2016). The effect of host genetics on the gut microbiome. Nat. Genet. 48 1407–1412. 10.1038/ng.3663 - DOI - PubMed

LinkOut - more resources