

Rainbow Trout Erythrocytes ex vivo Transfection With a DNA Vaccine Encoding VHSV Glycoprotein G Induces an Antiviral Immune Response
- PMID: 30429850
- PMCID: PMC6220650
- DOI: 10.3389/fimmu.2018.02477
Rainbow Trout Erythrocytes ex vivo Transfection With a DNA Vaccine Encoding VHSV Glycoprotein G Induces an Antiviral Immune Response
Abstract
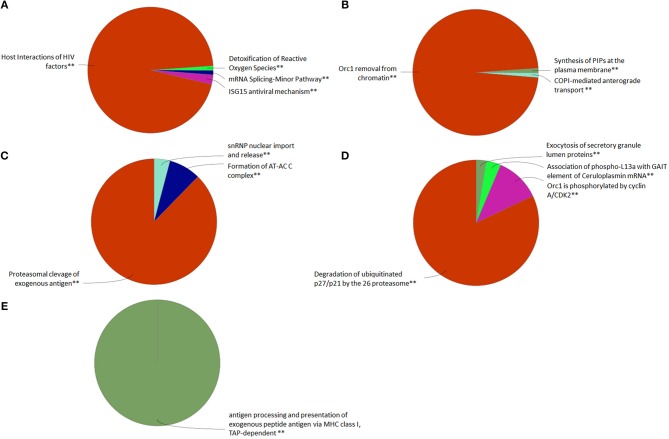
Fish red blood cells (RBCs), are integral in several biologic processes relevant to immunity, such as pathogen recognition, pathogen binding and clearance, and production of effector molecules and cytokines. So far, one of the best strategies to control and prevent viral diseases in aquaculture is DNA immunization. DNA vaccines (based on the rhabdoviral glycoprotein G [gpG] gene) have been shown to be effective against fish rhabdoviruses. However, more knowledge about the immune response triggered by DNA immunization is necessary to develop novel and more effective strategies. In this study, we investigated the role of fish RBCs in immune responses induced by DNA vaccines. We show for the first time that rainbow trout RBCs express gpG of viral hemorrhagic septicaemia virus (VHSV) (GVHSV) when transfected with the DNA vaccine ex vivo and modulate the expression of immune genes and proteins. Functional network analysis of transcriptome profiling of RBCs expressing GVHSV revealed changes in gene expression related to G-protein coupled receptor (GPCR)-downstream signaling, complement activation, and RAR related orphan receptor α (RORA). Proteomic profile functional network analysis of GVHSV-transfected RBCs revealed proteins involved in the detoxification of reactive oxygen species, interferon-stimulated gene 15 (ISG15) antiviral mechanisms, antigen presentation of exogenous peptides, and the proteasome. Conditioned medium of GVHSV-transfected RBCs conferred antiviral protection and induced ifn1 and mx gene expression in RTG-2 cells infected with VHSV. In summary, rainbow trout nucleated RBCs could be actively participating in the regulation of the fish immune response to GVHSV DNA vaccine, and thus may represent a possible carrier cells for the development of new vaccine approaches.
Keywords: DNA vaccine; VHSV glycoprotein G; erythrocytes; immune response; proteome; rainbow trout; red blood cells; transcriptome.
Figures


Similar articles
-
Time-course study of the protection induced by an interferon-inducible DNA vaccine against viral haemorrhagic septicaemia in rainbow trout.Fish Shellfish Immunol. 2019 Feb;85:99-105. doi: 10.1016/j.fsi.2018.06.056. Epub 2018 Jun 30. Fish Shellfish Immunol. 2019. PMID: 29969707
-
VHSV G glycoprotein major determinants implicated in triggering the host type I IFN antiviral response as DNA vaccine molecular adjuvants.Vaccine. 2014 Oct 14;32(45):6012-9. doi: 10.1016/j.vaccine.2014.07.111. Epub 2014 Sep 6. Vaccine. 2014. PMID: 25203447
-
Cell-mediated immune responses in rainbow trout after DNA immunization against the viral hemorrhagic septicemia virus.Dev Comp Immunol. 2008;32(3):239-52. doi: 10.1016/j.dci.2007.05.010. Epub 2007 Jun 26. Dev Comp Immunol. 2008. PMID: 17629943
-
DNA vaccines as a tool for analysing the protective immune response against rhabdoviruses in rainbow trout.Fish Shellfish Immunol. 2002 May;12(5):439-53. doi: 10.1006/fsim.2002.0422. Fish Shellfish Immunol. 2002. PMID: 12194454 Review.
-
Immune sensing of DNA and strategies for fish DNA vaccine development.Fish Shellfish Immunol. 2020 Jun;101:252-260. doi: 10.1016/j.fsi.2020.03.064. Epub 2020 Apr 1. Fish Shellfish Immunol. 2020. PMID: 32247047 Review.
Cited by
-
Immune Functions of Erythrocytes in Osteichthyes.Front Immunol. 2020 Sep 15;11:1914. doi: 10.3389/fimmu.2020.01914. eCollection 2020. Front Immunol. 2020. PMID: 33072066 Free PMC article. Review.
-
Immunomodulatory Lectin-like Peptides for Fish Erythrocytes-Targeting as Potential Antiviral Drug Delivery Platforms.Int J Mol Sci. 2021 Oct 30;22(21):11821. doi: 10.3390/ijms222111821. Int J Mol Sci. 2021. PMID: 34769254 Free PMC article.
-
IFIT5 Participates in the Antiviral Mechanisms of Rainbow Trout Red Blood Cells.Front Immunol. 2019 Apr 16;10:613. doi: 10.3389/fimmu.2019.00613. eCollection 2019. Front Immunol. 2019. PMID: 31040842 Free PMC article.
-
Fish Red Blood Cells Modulate Immune Genes in Response to Bacterial Inclusion Bodies Made of TNFα and a G-VHSV Fragment.Front Immunol. 2019 May 22;10:1055. doi: 10.3389/fimmu.2019.01055. eCollection 2019. Front Immunol. 2019. PMID: 31178858 Free PMC article.
-
Potential Role of Rainbow Trout Erythrocytes as Mediators in the Immune Response Induced by a DNA Vaccine in Fish.Vaccines (Basel). 2019 Jul 3;7(3):60. doi: 10.3390/vaccines7030060. Vaccines (Basel). 2019. PMID: 31277329 Free PMC article.
References
-
- Glomski CA, Tamburlin J, Chainani M. The phylogenetic odyssey of the erythrocyte. III. Fish, the lower vertebrate experience. Histol Histopathol. (1992) 7:501–28. - PubMed
Publication types
MeSH terms
Substances
LinkOut - more resources
Full Text Sources
Miscellaneous