. 2018 Oct 31:9:2483.
doi: 10.3389/fimmu.2018.02483. eCollection 2018.

Induced B Cell Development in Adult Mice

Affiliations

Induced B Cell Development in Adult Mice

Anne-Margarete Brennecke et al. Front Immunol. .

Abstract

We employed the B-Indu-Rag1 model in which the coding exon of recombination-activating gene 1 (Rag1) is inactivated by inversion. It is flanked by inverted loxP sites. Accordingly, B cell development is stopped at the pro/pre B-I cell precursor stage. A B cell-specific Cre recombinase fused to a mutated estrogen receptor allows the induction of RAG1 function and B cell development by application of Tamoxifen. Since Rag1 function is recovered in a non-self-renewing precursor cell, only single waves of development can be induced. Using this system, we could determine that B cells minimally require 5 days to undergo development from pro/preB-I cells to the large and 6 days to the small preB-II cell stage. First immature transitional (T) 1 and T2 B cells could be detected in the bone marrow at day 6 and day 7, respectively, while their appearance in the spleen took one additional day. We also tested a contribution of adult bone marrow to the pool of B-1 cells. Sublethally irradiated syngeneic WT mice were adoptively transferred with bone marrow of B-Indu-Rag1 mice and B cell development was induced after 6 weeks. A significant portion of donor derived B-1 cells could be detected in such adult mice. Finally, early VH gene usage was tested after induction of B cell development. During the earliest time points the VH genes proximal to D/J were found to be predominantly rearranged. At later time points, the large family of the most distal VH prevailed.

Keywords: B cell development; B-2/B-1a/B-1b; CSR; RAG; T-dependent/-independent; VH usage; antibodies; bone marrow.


Figures

Figure 1
Figure 1
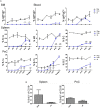
Progenitor and immature B cells after TAM-mediated induction of B cell development in different organs of adult B-Indu-Rag1 mice. (A) Large (left) and small (right) preB-II cells in BM at indicated time points after induction of B lymphopoiesis. (B) Kinetics of transitional B cell (T1 and T2) appearance at different anatomical sites (BM, peripheral blood, spleen) and time points post induction, as indicated. (C) Ratio of B cells with a T1 and T2 phenotype in BM and spleen of B-Indu-Rag1 mice at indicated time points after TAM administration. Note that the T1/T2 ratio of Wt mice is shown for comparison (right bar). (D) Cell proliferation of T1 cells from BM and spleen of TAM-treated B-Indu-Rag1 (left) and Wt (right) mice, as revealed by BrdU incorporation in vivo. Labeling was carried out exactly as described by the vendor. BrdU 2 mg was given i.p. 9 days after application of TAM and the incorporation was analyzed 2 h later by flow cytometric analysis. (A–D): Graphs show percentages of indicated B cell populations as median ± SEM (n ≥ 3 mice); asterisks in graphs indicate the level of significance (see methods for details). The experiments were carried out at least twice.
Figure 2
Figure 2
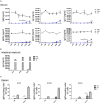
BM-derived mature B cells rise over time in B-Indu-Rag1 mice after TAM-mediated induction of B lymphopoiesis. (A) Graphs depict the kinetics of newly generated BCR+ B cell accumulation (IgM+IgD+, IgMhighIgDlow, B-1a, B-1b, B-2) at different anatomical sites [BM, blood, spleen, peritoneal cavity (PeC)], as indicated. (B) Cell proliferation of CD19+ B cells from spleen and peritoneal cavity of TAM-treated B-Indu-Rag1 (left) and Wt (right) mice, as revealed by BrdU incorporation in vivo. The proliferation of T1 was analyzed 9 days after induction. BrdU was given i.p. and 2 h later the incorporation was analyzed by flow cytometric analysis. (A,B) Mean percentages ± SEM (n ≥ 3 mice); asterisks in graphs indicate the level of significance (see methods for details). The experiments were carried out at least twice.
Figure 3
Figure 3
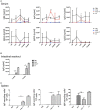
Induction of B lymphopoiesis in B-Indu-Rag1 mice correlates with increased Ig concentrations over time. Ig classes (IgM, IgA, IgG) and IgG subclasses (1, 2a, 2b, 3) in (A) serum and (B) intestinal washout of 3 mice per group were quantified by ELISA (ng/ml) at different time points after initiation of the experiment, as indicated. Blue squares: TAM-treated B-Indu-Rag1 mice; black circles: Rag1−/−; mice; black triangles: Wt mice. (C) Number of IgM-secreting cells among 105 total cells from BM and spleen of TAM-treated B-Indu-Rag1 mice, as revealed by ELISPOT at indicated time points after initiation of the experiment. Data from Rag1−/− and Wt mice are included for comparison (2–3 mice per group). (A–C), mean values ± SEM; asterisks in graphs indicate the level of significance (see methods for details). The experiments were carried out at least twice.
Figure 4
Figure 4
Adoptive T cell transfer increases B cell numbers in spleen of TAM-treated B-Indu-Rag1 mice. As indicated, shown are absolute numbers of different BCR+ B cell populations (IgM+IgD+, IgMhighIgDlow, B-1a, B-1b, B-2) at different anatomical sites (top: BM; middle: spleen; bottom: peritoneal cavity, PeC) and 3 and 8 weeks after initiation of the experiment. Note that, in addition to cohorts of B-Indu-Rag1 mice ± adoptive T cell transfer 1 day prior to TAM administration (Indu; Indu+T), we included Rag1−/− and Wt mice for comparison (n = 3–4 mice per group). Graphs depict mean values ± SEM; asterisks in graphs indicate the level of significance comparing “Indu” and “Indu+T”. The experiments were carried out at least twice.
Figure 5
Figure 5
T cell transfer enhances Ig secretion by newly generated B cells. See legends to Figures 3, 4 for experimental details. In brief, at indicated time points after initiation of the experiment, mouse cohorts described in Figure 4 were subjected to ELISA-based Ig quantification in (A) serum (n = 2–4 mice per group) and (B) intestinal washout (n = 3). (C) Number of Ig-secreting B cells determined by ELISpot. Graphs depict Ig concentrations (ng/ml) or number of Ig-producing cells as median values ± SEM; asterisks in graphs indicate the level of significance comparing “Indu” and “Indu+T”.
Figure 6
Figure 6
B lymphopoiesis in the adult BM can contribute to the mature B-1a cell pool. Tracking newly generated B-1a cells derived from adult BM. After irradiation conditioning, CB20 mice (IgMb) or Rag1−/− mice (no endogenous IgM+ cells) were reconstituted with B-Indu-Rag1-derived BM (IgMa). 6 weeks later, cohorts of chimeric CB20 recipients were administered with TAM to induce B lymphopoiesis from engrafted B-Indu-Rag1 BM. (A) Dot plots depict representative flow cytometry of IgMa and IgMb surface expression among gated viable cells (FSC/SSC) among peritoneal exudate cells from CB20 mice (IgMb) at day 21 after TAM treatment. (B) Tracking mature IgMa+ B cell subsets (B-1a, B-1b, B-2) among peritoneal exudate cells of chimeric Rag1−/− (left) and CB20 (right) mice. Graphs depict the percentage of B-Indu-Rag1 BM-derived IgMa+ cells as median values ± SEM; asterisks in graphs indicate the level of significance, as indicated. (n = 5 mice per experimental group).
Figure 7
Figure 7
TAM-induced early B cell development in the adult BM is strongly biased toward VDJ rearrangements that involve proximal VH gene segments. (A) Kinetics of VH gene usage in the BM of B-Indu-Rag1 mice after induction of B lymphopoiesis, as revealed by analysis of sequenced RT-PCR products at indicated time points after TAM administration. Mean number of analyzed sequences: 407. (B) Quantification of VH gene usage in FACS-purified populations of large and small preB-II cells from BM of Wt mice (BALB/c) with continuous B cell development. Mean number of analyzed sequences: 472. Arrows in graphs indicate the position of individual VH gene families relative to the D/J clusters of the murine IgH gene locus (proximal to D/J: 36-60, SM7, Q52, 7183; distal: J558).

References

    1. Baumgarth N. Innate-like B cells and their rules of engagement. Adv Exp Med Biol. (2013) 785:57–66. 10.1007/978-1-4614-6217-0_7 - DOI - PubMed
    1. Hardy RR, Hayakawa K. B cell development pathways. Annu Rev Immunol. (2001) 19:595–621. 10.1146/annurev.immunol.19.1.595 - DOI - PubMed
    1. Hayakawa K, Hardy RR. Development and function of B-1 cells. Curr Opin Immunol. (2000) 12:346–53. 10.1016/S0952-7915(00)00098-4 - DOI - PubMed
    1. Esplin BL, Welner RS, Zhang Q, Borghesi LA, Kincade PW. A differentiation pathway for B1 cells in adult bone marrow. Proc Natl Acad Sci USA. (2009) 106:5773–8. 10.1073/pnas.0811632106 - DOI - PMC - PubMed
    1. Montecino-Rodriguez E, Leathers H, Dorshkind K. Identification of a B-1 B cell-specified progenitor. Nat Immunol. (2006) 7:293–301. 10.1038/ni1301 - DOI - PubMed

LinkOut - more resources