. 2018 Oct 31:9:2519.
doi: 10.3389/fimmu.2018.02519. eCollection 2018.

High-Dimensional Profiling Reveals Heterogeneity of the Th17 Subset and Its Association With Systemic Immunomodulatory Treatment in Non-infectious Uveitis

Affiliations

High-Dimensional Profiling Reveals Heterogeneity of the Th17 Subset and Its Association With Systemic Immunomodulatory Treatment in Non-infectious Uveitis

Fleurieke H Verhagen et al. Front Immunol. .

Abstract

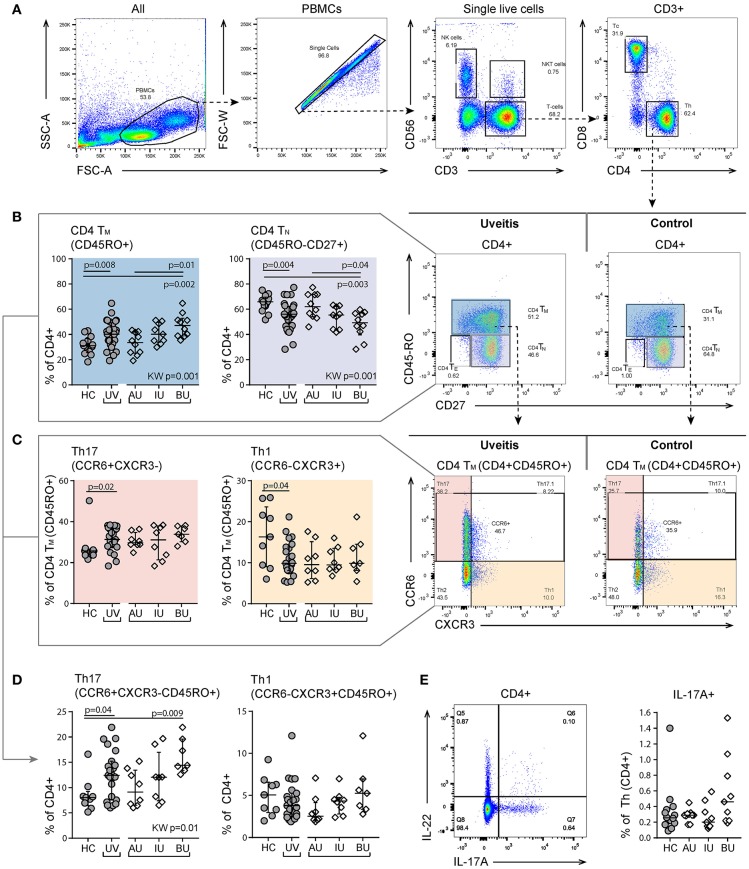
Background: Non-infectious uveitis (NIU) is a severe intra ocular inflammation, which frequently requires prompt systemic immunosuppressive therapy (IMT) to halt the development of vision-threatening complications. IMT is considered when NIU cannot be treated with corticosteroids alone, which is unpredictable in advance. Previous studies have linked blood cell subsets to glucocorticoid sensitivity, which suggests that the composition of blood leukocytes may early identify patients that will require IMT. Objective: To map the blood leukocyte composition of NIU and identify cell subsets that stratify patients that required IMT during follow-up. Methods: We performed controlled flow cytometry experiments measuring a total of 37 protein markers in the blood of 30 IMT free patients with active non-infectious anterior, intermediate, and posterior uveitis, and compared these to 15 age and sex matched healthy controls. Results from manual gating were validated by automatic unsupervised gating using FlowSOM. Results: Patients with uveitis displayed lower relative frequencies of Natural Killer cells and higher relative frequencies of memory T cells, in particular the CCR6+ lineages. These results were confirmed by automatic gating by unsupervised clustering using FlowSOM. We observed considerable heterogeneity in memory T cell subsets and abundance of CXCR3-CCR6+ (Th17) cells between the uveitis subtypes. Importantly, regardless of the uveitis subtype, patients that eventually required IMT in the course of the study follow-up exhibited increased CCR6+ T cell abundance before commencing therapy. Conclusion: High-dimensional immunoprofiling in NIU patients shows that clinically distinct forms of human NIU exhibit shared as well as unique immune cell perturbations in the peripheral blood and link CCR6+ T cell abundance to systemic immunomodulatory treatment.

Keywords: CCR6; Th17; flow cytometry; immunosuppressive therapy; non-infectious uveitis.


Figures

Figure 1
Figure 1
The overall blood leukocyte composition is changed in non-infectious uveitis (A). We performed high-dimensional immune profiling of blood of non-infectious uveitis and control samples by multi-color flow cytometry in 10 independent experiments that were integrated for meta-analyses. (B) Principal component analysis (projection onto first two principal components) of the combined flow cytometry data of the 45 samples of this study, including the “internal control” (i.e., an aliquot from a single healthy donor isolated and frozen at the same day) that was taken along for each experiment. The close clustering of the internal control samples across all experiments as shown in the projection of the first two components indicates low inter-experiment variability. (C) Heatmap of unsupervised hierarchical clustering of the 50 manually gated cell subsets which largest variability between the groups (based on the ANOVA). Heatmap colors represent the changes in proportion from relatively lower proportion (in blue) to higher proportion (in red). Dendrograms indicating the clustering relationships between disease groups and leukocyte populations are shown to the left and above the heatmap. The sample meta-data are indicated above and the leukocyte subsets contributing to these clusters are indicated on the right. M1: first color marker to define leukocyte population. M2: additional color marker to define chemokine receptor and/or cytokine production. Populations with the same M1 and M2 colors differ in additional (not highlighted) protein markers (e.g., CD161) or represent the same population in a different gated population (% of CD4+CD45RO+ vs. % of CD3). AU, HLA-B27 associated anterior uveitis; BU, Birdshot Uveitis; F, female; HC, healthy control; IC, internal control; IMT, requirement for systemic (non-corticosteroid) immunosuppressive therapy during follow-up; IU, idiopathic intermediate uveitis; M, male; PC, principal component; Th, T helper cell; TNF, tumor necrosis factor; UV, all uveitis patients combined.
Figure 2
Figure 2
Heterogeneity in memory T cell subsets and abundance of CXCR3-CCR6+ (Th17) cells between uveitis subtypes. (A) Gating strategy of a representative sample used to identify T helper (Th. CD3+CD4+) and cytotoxic T cells (Tc. CD3+CD8+). (B) Shift in proportion from naïve to memory T helper cells in uveitis patients compared to controls. The proportion of CD4+TN and CD4+TM cells shows heterogeneity between the uveitis subtypes and the observed difference between uveitis and healthy controls is mainly driven by BU patients. (C) Within the CD4+TM there is an increase of Th17 (CCR6+CXCR3-) and a decrease in Th1 (CCR6-CXCR3+) cells in uveitis patients compared to healthy controls. (D) BU displayed an increase in Th17 cells within the total CD4+ T cell population compared to the other patient groups. (E) left: gating strategy used to identify IL-17A expressing CD4+ T helper cells using the intracellular cytokine panel. Right: percentage of IL-17A+ cells within the total CD4+ T cell population. The gating of intracellular cytokines (including IL17A) from CD4 T cells in given in more detail in Figure S2. Bars indicate the median and interquartile range. P-values between HC and UV are from Wilcoxon rank-sum test, p-values between uveitis subgroups are from Kruskal–Wallis (KW) test with post-hoc Dunn's correction for multiple testing. AU, HLA-B27 associated anterior uveitis; BU, Birdshot uveitis; HC, healthy control; IL, interleukin; IU, idiopathic intermediate uveitis; TE, effector T cell (CD45RO-CD27-); Th, T helper cell (CD3+CD4+); TM, memory T cell (CD45RO+); TN, naïve T cell (CD45RO-CD27+); PBMC, peripheral blood mononuclear cell; TNF, tumor necrosis factor; UV, all uveitis patients combined.
Figure 3
Figure 3
Flow cytometry analysis of T regulatory cells. Top and second row: gating strategy used to identify T regulatory (Treg, CD25highFoxP3+) cells. Live single cells are gated as indicated in Figure S1. Bottom row: levels of circulating Tregs as % of (memory) CD4+ T cells. All Tregs are also CD127- (see “overlay” plot). Bars in scatter plots indicate median, error bars indicate interquartile range. Abbreviations: AU, HLA-B27 associated anterior uveitis; BU, Birdshot uveitis; HC, healthy control; IU, idiopathic intermediate uveitis; UV, Combined uveitis samples.
Figure 4
Figure 4
Flow cytometry of peripheral blood mononuclear cells shows changes in the proportion of CD8+ T cell subsets. (A) Decrease of CD8+ T cells in uveitis compared to healthy controls. Representative patient and control sample. CD3+ cells are gated from live single cells, as is indicated in Figure S1. (B) Decrease in the CD45RO-CD27- TE population. (C) CCR10+ CD8+ TM cells are significantly higher in BU compared to IU. Bars in plots indicate median, error bars indicate interquartile range. P-values between HC and UV are from Wilcoxon rank-sum test, p-values between uveitis subgroups are from Kruskal–Wallis (KW) test with post-hoc Dunn's correction for multiple testing. AU, HLA-B27 associated anterior uveitis; BU, Birdshot uveitis; HC, healthy control; IU, idiopathic intermediate uveitis; Tc, cytotoxic Tcell; Th, Thelper cell; TE, effector Tcells (CD45RO-CD27-); TN, naïve (CD45RO-CD27+); TM, memory (CD45RO+); UV, Combined Uveitis samples.
Figure 5
Figure 5
Flow cytometry of peripheral blood mononuclear cells shows a decrease of plasmacytoid dendritic cells in non-infectious uveitis. (A) Gating strategy used to identify dendritic cell subsets (representative sample). Live single cells are gated as indicated in Figure S1. (B) The frequency of circulating plasmacytoid and myeloid dendritic cell subsets as percentage of the HLA-DR+Lineage (CD3,CD19,CD56)CD16CD14 cells. Bars in plots indicate median, error bars indicate interquartile range. P-values between HC and UV are from Wilcoxon rank-sum test, p-values between uveitis subgroups are from Kruskal–Wallis (KW) test with post-hoc Dunn's correction for multiple testing. AU, HLA-B27 associated anterior uveitis; BU, Birdshot uveitis; HC, healthy control; IU, idiopathic intermediate uveitis; KW, Kruskal–Wallis test; mDC, myeloid dendritic cell; pDC, plasmacytoid dendritic cell; UV, Combined Uveitis samples.
Figure 6
Figure 6
Flow cytometry of peripheral blood mononuclear cells shows a decrease of Natural Killer (NK) cells in uveitis. Left: levels of circulating NK (CD56+CD3-) cells as % of PBMCs. Right: gating strategy used to identify NK cells. Live single cells are gated as indicated in Figure S1. Bars in plots indicate median, error bars indicate interquartile range. P-values between HC and UV are from Wilcoxon rank-sum test, p-values between uveitis subgroups are from Kruskal–Wallis (KW) test with post-hoc Dunn's correction for multiple testing. AU, HLA-B27 associated anterior uveitis; BU, Birdshot uveitis; HC, healthy control; IU, idiopathic intermediate uveitis; PBMC's, peripheral blood mononuclear cells; UV, Combined Uveitis samples.
Figure 7
Figure 7
Automatic gating by unsupervised clustering using FlowSOM identifies cell (meta) clusters associated with non-infectious uveitis. Using FlowSOM, we clustered all individual cells within the single-cell gates of all samples into 100 distinct clusters based on the surface protein expression. Using unsupervised clustering, the 100 clusters were clustered into 22 meta-clusters of different cell types and organized in the minimal spanning tree on the right. The meta-clusters are represented by unique colors (all meta-cluster comparisons between uveitis and controls are provided in Figure S3). For each cluster (i.e., cell population), pie charts indicate the relative expression for each of the different surface markers and the pie size corresponds to the average size of the population in the samples. Three clusters and their associated meta-clusters (A–C) are indicated. P-values between HC and UV are from Wilcoxon rank-sum test (*P < 0.05, **P < 0.01, ns, non-significant). For these three meta-clusters, the relative densities of normalized expression of the surface protein markers for from the T cell panel are indicated above and for each associated cluster the pie charts provide the relative expression of each surface marker.
Figure 8
Figure 8
CCR6+ T cells are increased in patients that need systemic immunomodulatory treatment. (A) Unsupervised hierarchical clustering of the top 10 T cell subsets in 23 patients with complete data distinguishes two clusters of patients that are characterized by altered proportion of CD4+ and CD8+ T cell populations and differential requirement of IMT during follow-up. Heatmap colors represent the relative difference in proportion from relatively low (in blue) to high (in red) for each manually gated population. Data were normalized using quantum normalization and log transformation. Data are scaled using Auto scaling. The sample meta-data and the leukocyte subsets contributing to these clusters are indicated. M1, first color marker to define CD4 or CD8 expression in T cell populations; M2, additional color marker to define chemokine receptor or CD161 expression for each T cell population. (B) FlowSOM analysis identified a cluster from meta-cluster B with significantly higher abundance in patients that required IMT during follow-up before commencing therapy. This IMT associated FlowSOM cluster has a phenotype consistent with Th17 cells (CD3+CD4+CD45RO+CXCR3-CCR6+). The pie chart indicates the relative expression for each of the different surface markers that is expressed on this cluster. The scatterplot (left) depicts the proportion of this cluster within the live single cell gate that was fed into the FlowSOM algorithm. Bars indicate median with interquartile range. (C) Scatterplot of manually gated Th17 (CXCR3-CCR6+ of CD4+ TM cells) cells shown for controls and the treatment groups. Bars indicate the median. P-values are from Wilcoxon rank-sum test. AU, HLA-B27 associated anterior uveitis; BU, Birdshot uveitis; F, female; HC, healthy control; IMT, requirement for systemic (non-corticosteroid) immunosuppressive therapy during follow-up; IU, idiopathic intermediate uveitis; M, male.

Similar articles

Cited by

References

    1. Thorne JE, Suhler E, Skup M, Tari S, Macaulay D, Chao J, et al. . Prevalence of noninfectious uveitis in the United States. JAMA Ophthalmol. (2016) 134:1237–45. 10.1001/jamaophthalmol.2016.3229 - DOI - PubMed
    1. Suttorp-Schulten MS, Rothova A. The possible impact of uveitis in blindness: a literature survey. Br J Ophthalmol. (1996) 80:844–8. - PMC - PubMed
    1. de Smet MD, Taylor SRJ, Bodaghi B, Miserocchi E, Murray PI, Pleyer U, et al. . Understanding uveitis: the impact of research on visual outcomes. Prog Retin Eye Res. (2011) 30:452–70. 10.1016/j.preteyeres.2011.06.005 - DOI - PubMed
    1. Gui W, Dombrow M, Marcus I, Stowe MH, Tessier-Sherman B, Yang E, et al. Quality of life in patients with noninfectious uveitis treated with or without systemic anti-inflammatory therapy. Ocul Immunol Inflamm. (2015) 23:135–43. 10.3109/09273948.2013.874445 - DOI - PubMed
    1. Jabs DA, Rosenbaum JT, Foster CS, Holland GN, Jaffe GJ, Louie JS, et al. . Guidelines for the use of immunosuppressive drugs in patients with ocular inflammatory disorders: recommendations of an expert panel. Am J Ophthalmol. (2000) 130:492–513. 10.1016/S0002-9394(00)00659-0 - DOI - PubMed

Publication types

LinkOut - more resources