

Sonodynamic therapy-induced foam cells apoptosis activates the phagocytic PPARγ-LXRα-ABCA1/ABCG1 pathway and promotes cholesterol efflux in advanced plaque
- PMID: 30429880
- PMCID: PMC6217053
- DOI: 10.7150/thno.26193
Sonodynamic therapy-induced foam cells apoptosis activates the phagocytic PPARγ-LXRα-ABCA1/ABCG1 pathway and promotes cholesterol efflux in advanced plaque
Abstract
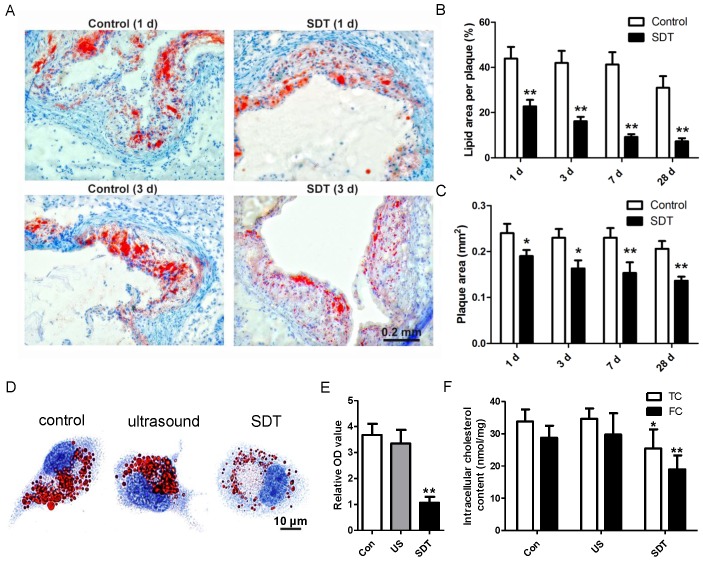
In advanced atherosclerotic plaques, defective efferocytosis of apoptotic foam cells and decreased cholesterol efflux contribute to lesion progression. In our previous study, we demonstrated that 5-aminolevulinic acid (ALA)-mediated sonodynamic therapy (SDT) could induce foam cells apoptosis via the mitochondrial-caspase pathway. In the current research, we sought to explore ALA-SDT-induced apoptosis of phagocytes and the effects of cholesterol efflux and efferocytosis in advanced apoE-/- mice plaque. Methods: apoE-/- mice fed western diet were treated with ALA-SDT and sacrificed at day 1, day 3, day 7 and day 28 post treatment. THP-1 macrophage-derived foam cells were treated with ALA-SDT. 5 hours later, the supernatant was collected and added to fresh foam cells (phagocytes). Then, the lipid area, efferocytosis, cholesterol efflux, anti-inflammatory reactions and PPARγ-LXRα-ABCA1/ABCG1 pathway were detected in plaque in vivo and in phagocytes in vitro. Results: We found that ALA-SDT induced foam cells apoptosis coupled with efferocytosis and upregulation of Mer tyrosine kinase (MerTK) both in vivo and in vitro. The lipid content in plaque decreased as early as 1 day after ALA-SDT and this tendency persisted until 28 days. The enhancement of phagocytes cholesterol efflux was accompanied by an approximately 40% decrease in free cholesterol and a 24% decrease in total cholesterol in vitro. More importantly, anti-inflammatory factors such as TGFβ and IL-10 were upregulated by ALA-SDT treatment. Finally, we found that PPARγ-LXRα-ABCA1/ABCG1 pathway was activated both in vivo and in vitro by ALA-SDT, which could be blocked by PPARγ siRNA. Conclusions: Activation of PPARγ-LXRα-ABCA1/ABCG1 pathway induced by ALA-SDT treatment engages a virtuous cycle that enhances efferocytosis, cholesterol efflux and anti-inflammatory reactions in advanced plaque in vivo and in phagocytes in vitro.
Keywords: atherosclerosis; cholesterol efflux; foam cells; phagocyte; sonodynamic therapy.
Conflict of interest statement
Competing Interests: The authors have declared that no competing interest exists.
Figures


Similar articles
-
The Lian-Dou-Qing-Mai Formula activates the PPARγ-LXRα-ABCA1/ABCG1 pathway by regulating IL-10, leading to the promotion of cholesterol efflux and a reduction in atherosclerotic plaques.Histol Histopathol. 2025 Apr;40(4):585-596. doi: 10.14670/HH-18-803. Epub 2024 Aug 19. Histol Histopathol. 2025. PMID: 39315497
-
Leonurine Prevents Atherosclerosis Via Promoting the Expression of ABCA1 and ABCG1 in a Pparγ/Lxrα Signaling Pathway-Dependent Manner.Cell Physiol Biochem. 2017;43(4):1703-1717. doi: 10.1159/000484031. Epub 2017 Oct 18. Cell Physiol Biochem. 2017. PMID: 29045950
-
Propofol up-regulates expression of ABCA1, ABCG1, and SR-B1 through the PPARγ/LXRα signaling pathway in THP-1 macrophage-derived foam cells.Cardiovasc Pathol. 2015 Jul-Aug;24(4):230-5. doi: 10.1016/j.carpath.2014.12.004. Epub 2014 Dec 27. Cardiovasc Pathol. 2015. PMID: 25600616
-
Brothers in Arms: ABCA1- and ABCG1-Mediated Cholesterol Efflux as Promising Targets in Cardiovascular Disease Treatment.Pharmacol Rev. 2020 Jan;72(1):152-190. doi: 10.1124/pr.119.017897. Pharmacol Rev. 2020. PMID: 31831519
-
A novel therapeutic strategy for atherosclerosis: autophagy-dependent cholesterol efflux.J Physiol Biochem. 2022 Aug;78(3):557-572. doi: 10.1007/s13105-021-00870-5. Epub 2022 Jan 22. J Physiol Biochem. 2022. PMID: 35064467 Review.
Cited by
-
Gene Therapy for Cardiovascular Disease: Basic Research and Clinical Prospects.Front Cardiovasc Med. 2021 Nov 5;8:760140. doi: 10.3389/fcvm.2021.760140. eCollection 2021. Front Cardiovasc Med. 2021. PMID: 34805315 Free PMC article. Review.
-
USP22 enhances atherosclerotic plaque stability and macrophage efferocytosis by stabilizing PPARγ.Commun Biol. 2025 Apr 29;8(1):678. doi: 10.1038/s42003-025-08116-6. Commun Biol. 2025. PMID: 40301680 Free PMC article.
-
Genomic Variants and Multilevel Regulation of ABCA1, ABCG1, and SCARB1 Expression in Atherogenesis.J Cardiovasc Dev Dis. 2021 Dec 2;8(12):170. doi: 10.3390/jcdd8120170. J Cardiovasc Dev Dis. 2021. PMID: 34940525 Free PMC article. Review.
-
Advances in imaging and treatment of atherosclerosis based on organic nanoparticles.APL Bioeng. 2022 Dec 5;6(4):041501. doi: 10.1063/5.0127835. eCollection 2022 Dec. APL Bioeng. 2022. PMID: 36483980 Free PMC article. Review.
-
Natural products in atherosclerosis therapy by targeting PPARs: a review focusing on lipid metabolism and inflammation.Front Cardiovasc Med. 2024 Apr 18;11:1372055. doi: 10.3389/fcvm.2024.1372055. eCollection 2024. Front Cardiovasc Med. 2024. PMID: 38699583 Free PMC article. Review.
References
-
- Gistera A, Hansson GK. The immunology of atherosclerosis. Nat Rev Nephrol. 2017;13:368–80. - PubMed
-
- Cochain C, Zernecke A. Macrophages and immune cells in atherosclerosis: recent advances and novel concepts. Basic Res Cardiol. 2015;110:34. - PubMed
-
- Moreno PR, Sanz J, Fuster V. Promoting mechanisms of vascular health: circulating progenitor cells, angiogenesis, and reverse cholesterol transport. J Am Coll Cardiol. 2009;53:2315–23. - PubMed
-
- Boren J, Williams KJ. The central role of arterial retention of cholesterol-rich apolipoprotein-B-containing lipoproteins in the pathogenesis of atherosclerosis: a triumph of simplicity. Curr Opin Lipidol. 2016;27:473–83. - PubMed
-
- McLaren JE, Michael DR, Ashlin TG, Ramji DP. Cytokines, macrophage lipid metabolism and foam cells: implications for cardiovascular disease therapy. Prog Lipid Res. 2011;50:331–47. - PubMed
Publication types
MeSH terms
Substances
LinkOut - more resources
Full Text Sources
Medical
Miscellaneous
