

CD44 Expression Profile Varies According to Maturational Subtypes and Molecular Profiles of Pediatric T-Cell Lymphoblastic Leukemia
- PMID: 30430079
- PMCID: PMC6220090
- DOI: 10.3389/fonc.2018.00488
CD44 Expression Profile Varies According to Maturational Subtypes and Molecular Profiles of Pediatric T-Cell Lymphoblastic Leukemia
Abstract
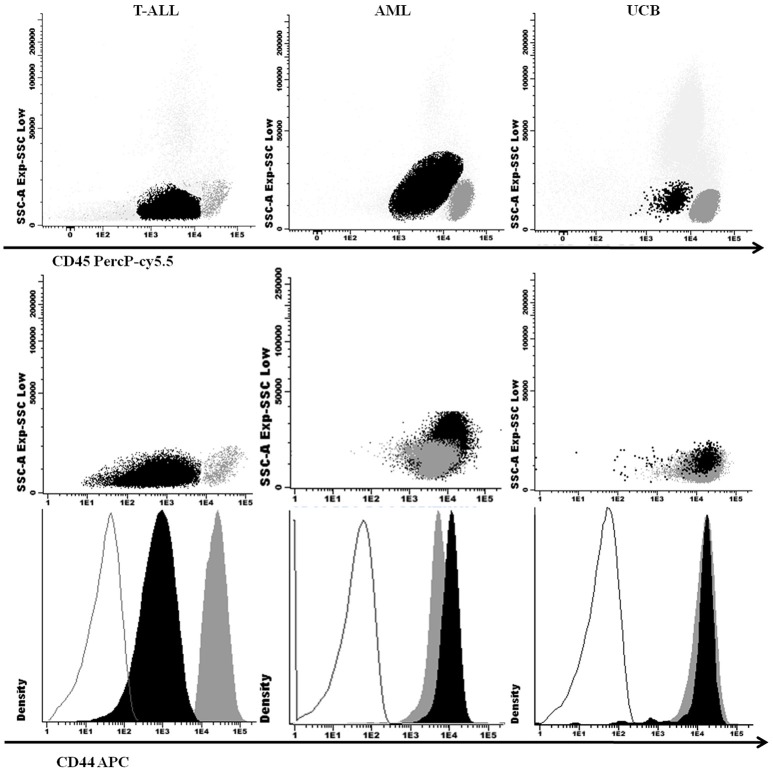
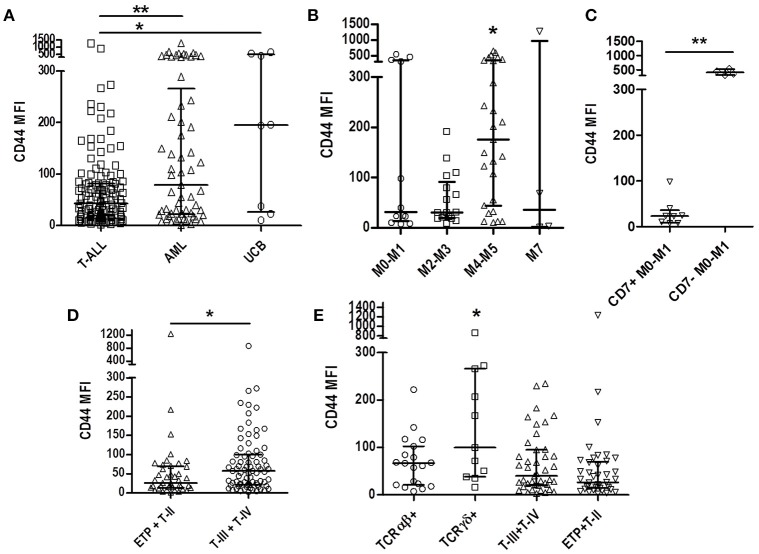
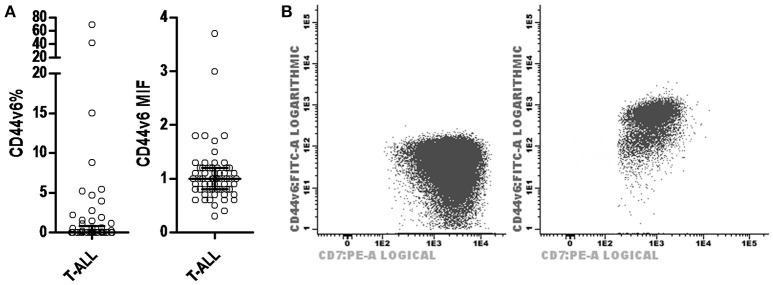
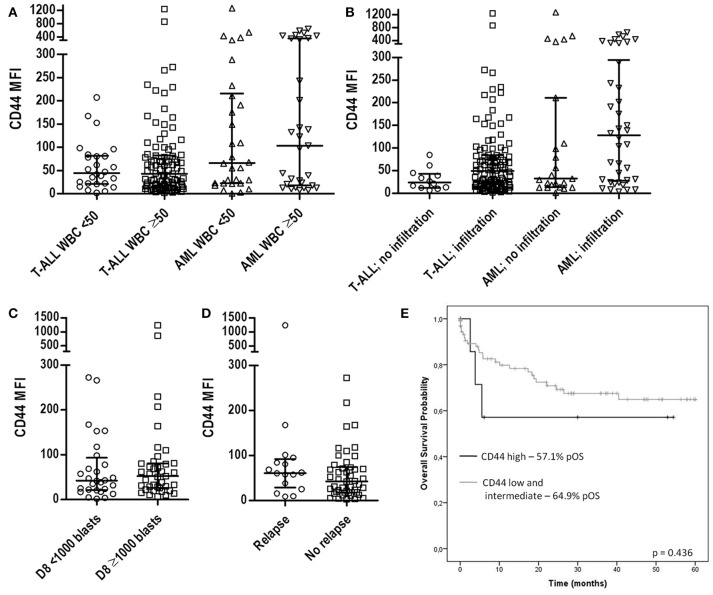
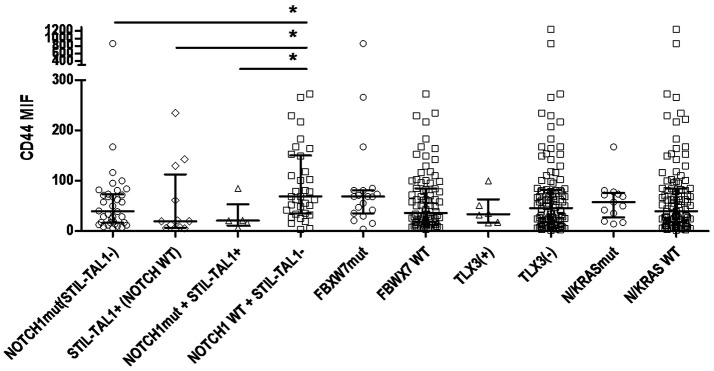
CD44 is a glycoprotein expressed in leucocytes and a marker of leukemia-initiating cells, being shown to be important in the pathogenesis of T cell acute lymphoblastic leukemia (T-ALL). In this study, we have (i) identified the aberrant antigenic pattern of CD44 and its isoform CD44v6 in T-ALL; (ii) tested the association with different T-cell subtypes and genomic alterations; (iii) identified the impact of CD44 status in T-ALL outcome. Samples from 184 patients (123 T-ALL and 61 AML; <19 years) were analyzed throughout multiparametric flow cytometry. Mutations in N/KRAS, NOTCH1, FBXW7 as well as STIL-TAL1 and TLX3 rearrangements were detected using standard molecular techniques. CD44 expression was characterized in all T-ALL and AML cases. Compared with AML samples in which the median fluorescence intensity (MFI) was 79.1 (1-1272), T-ALL was relatively low, with MFI 43.2 (1.9-1239); CD44v6 expression was rarely found, MFI 1 (0.3-3.7). T-ALL immature subtypes (mCD3/CD1aneg) had a lower CD44 expression, MFI 57.5 (2.7-866.3), whereas mCD3/TCRγδpos cases had higher expressions, MFI 99.9 (16.4-866.3). NOTCH1 mut and STIL-TAL1 were associated with low CD44 expression, whereas N/KRAS mut and FBXW7 mut cases had intermediate expression. In relation to clinical features, CD44 expression was associated with tumor infiltrations (p = 0.065). However, no association was found with initial treatment responses and overall survival prediction. Our results indicate that CD44 is aberrantly expressed in T-ALL being influenced by different genomic alterations. Unraveling this intricate mechanism is required to place CD44 as a therapeutic target in T-ALL.
Keywords: CD44; CD44/CD44v6; NOTCH1; T-cell leukemia; acute myeloid leukemia.
Figures
Similar articles
-
The Profile of Immunophenotype and Genotype Aberrations in Subsets of Pediatric T-Cell Acute Lymphoblastic Leukemia.Front Oncol. 2019 Apr 30;9:316. doi: 10.3389/fonc.2019.00316. eCollection 2019. Front Oncol. 2019. PMID: 31338319 Free PMC article.
-
T-lymphoid/myeloid mixed phenotype acute leukemia and early T-cell precursor lymphoblastic leukemia similarities with NOTCH1 mutation as a good prognostic factor.Cancer Manag Res. 2019 May 2;11:3933-3943. doi: 10.2147/CMAR.S196574. eCollection 2019. Cancer Manag Res. 2019. PMID: 31118806 Free PMC article.
-
NOTCH1 and/or FBXW7 mutations predict for initial good prednisone response but not for improved outcome in pediatric T-cell acute lymphoblastic leukemia patients treated on DCOG or COALL protocols.Leukemia. 2010 Dec;24(12):2014-22. doi: 10.1038/leu.2010.204. Epub 2010 Sep 23. Leukemia. 2010. PMID: 20861909
-
T cell acute lymphoblastic leukemia/lymphoma: a human cancer commonly associated with aberrant NOTCH1 signaling.Curr Opin Hematol. 2004 Nov;11(6):426-33. doi: 10.1097/01.moh.0000143965.90813.70. Curr Opin Hematol. 2004. PMID: 15548998 Review.
-
[Biological properties and sensitivity to induction therapy of differentiated cells expressing atypical immunophenotype in acute leukemia of children].Folia Med Cracov. 2001;42(3):5-80. Folia Med Cracov. 2001. PMID: 12353422 Review. Polish.
Cited by
-
Updating recommendations of the Brazilian Group of Flow Cytometry (GBCFLUX) for diagnosis of acute leukemias using four-color flow cytometry panels.Hematol Transfus Cell Ther. 2021 Oct-Dec;43(4):499-506. doi: 10.1016/j.htct.2021.04.001. Epub 2021 May 21. Hematol Transfus Cell Ther. 2021. PMID: 34127423 Free PMC article.
-
Minimal residual disease assessment in acute lymphoblastic leukemia by 4-color flow cytometry: Recommendations from the MRD Working Group of the Brazilian Society of Bone Marrow Transplantation.Hematol Transfus Cell Ther. 2021 Jul-Sep;43(3):332-340. doi: 10.1016/j.htct.2020.09.148. Epub 2020 Nov 21. Hematol Transfus Cell Ther. 2021. PMID: 33281111 Free PMC article.
-
Identification of co-expressed genes associated with MLL rearrangement in pediatric acute lymphoblastic leukemia.Biosci Rep. 2020 May 29;40(5):BSR20200514. doi: 10.1042/BSR20200514. Biosci Rep. 2020. PMID: 32347296 Free PMC article.
-
The emerging scenario of immunotherapy for T-cell Acute Lymphoblastic Leukemia: advances, challenges and future perspectives.Exp Hematol Oncol. 2023 Jan 9;12(1):5. doi: 10.1186/s40164-022-00368-w. Exp Hematol Oncol. 2023. PMID: 36624522 Free PMC article. Review.
-
Hyaluronic Acid-Based Drug Delivery Systems for Cancer Therapy.Cells. 2025 Jan 7;14(2):61. doi: 10.3390/cells14020061. Cells. 2025. PMID: 39851489 Free PMC article. Review.
References
LinkOut - more resources
Full Text Sources
Miscellaneous