Machine learning of brain gray matter differentiates sex in a large forensic sample
- PMID: 30430711
- PMCID: PMC6397072
- DOI: 10.1002/hbm.24462
Machine learning of brain gray matter differentiates sex in a large forensic sample
Abstract
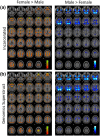
Differences between males and females have been extensively documented in biological, psychological, and behavioral domains. Among these, sex differences in the rate and typology of antisocial behavior remains one of the most conspicuous and enduring patterns among humans. However, the nature and extent of sexual dimorphism in the brain among antisocial populations remains mostly unexplored. Here, we seek to understand sex differences in brain structure between incarcerated males and females in a large sample (n = 1,300) using machine learning. We apply source-based morphometry, a contemporary multivariate approach for quantifying gray matter measured with magnetic resonance imaging, and carry these parcellations forward using machine learning to classify sex. Models using components of brain gray matter volume and concentration were able to differentiate between males and females with greater than 93% generalizable accuracy. Highly differentiated components include orbitofrontal and frontopolar regions, proportionally larger in females, and anterior medial temporal regions proportionally larger in males. We also provide a complimentary analysis of a nonforensic healthy control sample and replicate our 93% sex discrimination. These findings demonstrate that the brains of males and females are highly distinguishable. Understanding sex differences in the brain has implications for elucidating variability in the incidence and progression of disease, psychopathology, and differences in psychological traits and behavior. The reliability of these differences confirms the importance of sex as a moderator of individual differences in brain structure and suggests future research should consider sex specific models.
Keywords: MRI; antisocial behavior; gender; machine learning; sex; source-based morphometry.
© 2018 Wiley Periodicals, Inc.
Conflict of interest statement
The authors declare that they have no potential conflict of interests.
Figures


Similar articles
-
Age of gray matters: Neuroprediction of recidivism.Neuroimage Clin. 2018 Jun 3;19:813-823. doi: 10.1016/j.nicl.2018.05.036. eCollection 2018. Neuroimage Clin. 2018. PMID: 30013925 Free PMC article.
-
Multivariate models of brain volume for identification of children and adolescents with fetal alcohol spectrum disorder.Hum Brain Mapp. 2020 Apr 1;41(5):1181-1194. doi: 10.1002/hbm.24867. Epub 2019 Nov 18. Hum Brain Mapp. 2020. PMID: 31737980 Free PMC article.
-
Brain gray matter differences among forensic psychiatric patients with psychosis and incarcerated individuals without psychosis: A source-based morphometry study.Neuroimage Clin. 2021;30:102673. doi: 10.1016/j.nicl.2021.102673. Epub 2021 Apr 15. Neuroimage Clin. 2021. PMID: 34215145 Free PMC article.
-
Sex differences in the adolescent brain.Brain Cogn. 2010 Feb;72(1):46-55. doi: 10.1016/j.bandc.2009.10.008. Epub 2009 Nov 13. Brain Cogn. 2010. PMID: 19913969 Free PMC article. Review.
-
Sex differences matter: Males and females are equal but not the same.Physiol Behav. 2023 Feb 1;259:114038. doi: 10.1016/j.physbeh.2022.114038. Epub 2022 Nov 22. Physiol Behav. 2023. PMID: 36423797 Review.
Cited by
-
Insights into Sex and Gender Differences in Brain and Psychopathologies Using Big Data.Life (Basel). 2023 Aug 2;13(8):1676. doi: 10.3390/life13081676. Life (Basel). 2023. PMID: 37629533 Free PMC article. Review.
-
"Precision Medicine" and the Failed Search for Binary Brain Sex Differences to Address Gender Behavioral Health Disparities.Am J Hum Biol. 2025 Apr;37(4):e70041. doi: 10.1002/ajhb.70041. Am J Hum Biol. 2025. PMID: 40207611 Free PMC article. Review.
-
Editorial: Bridging Gaps Between Sex and Gender in Neurosciences.Front Neurosci. 2020 Jun 11;14:561. doi: 10.3389/fnins.2020.00561. eCollection 2020. Front Neurosci. 2020. PMID: 32595445 Free PMC article. No abstract available.
-
Findings from machine learning in clinical medical imaging applications - Lessons for translation to the forensic setting.Forensic Sci Int. 2020 Nov;316:110538. doi: 10.1016/j.forsciint.2020.110538. Epub 2020 Oct 18. Forensic Sci Int. 2020. PMID: 33120319 Free PMC article. Review.
-
Patch individual filter layers in CNNs to harness the spatial homogeneity of neuroimaging data.Sci Rep. 2021 Dec 27;11(1):24447. doi: 10.1038/s41598-021-03785-9. Sci Rep. 2021. PMID: 34961762 Free PMC article.
References
-
- Alper, J. S. (1985). Sex differences in brain asymmetry: A critical analysis. Feminist Studies, 11(1), 7–37. 10.2307/3180130 - DOI
-
- Archer, J. (2004). Sex differences in aggression in real‐world settings: A meta‐analytic review. Review of General Psychology, 8(4), 291–322. 10.1037/1089-2680.8.4.291 - DOI
Publication types
MeSH terms
Grants and funding
- R01 DA026964/DA/NIDA NIH HHS/United States
- R01 DA026505/DA/NIDA NIH HHS/United States
- R01MH071896/MH/NIMH NIH HHS/United States
- R01MH085010/MH/NIMH NIH HHS/United States
- R01 DA020870/DA/NIDA NIH HHS/United States
- R01DA026505/DA/NIDA NIH HHS/United States
- MacArthur Foundation/International
- R01DA026964/DA/NIDA NIH HHS/United States
- R01EB005846/EB/NIBIB NIH HHS/United States
- R01MH070539/MH/NIMH NIH HHS/United States
- R01 MH071896/MH/NIMH NIH HHS/United States
- R01 EB020407/EB/NIBIB NIH HHS/United States
- P20 GM103472/GM/NIGMS NIH HHS/United States
- R01DA020870/DA/NIDA NIH HHS/United States
- R01 MH118695/MH/NIMH NIH HHS/United States
- R01 MH085010/MH/NIMH NIH HHS/United States
- R01 EB005846/EB/NIBIB NIH HHS/United States
- R01 EB006841/EB/NIBIB NIH HHS/United States
- P20GM103472/GM/NIGMS NIH HHS/United States
- R01 MH070539/MH/NIMH NIH HHS/United States
LinkOut - more resources
Full Text Sources

