. 2019 Jan;25(1):25-36.
doi: 10.1089/ten.TEC.2018.0290. Epub 2018 Dec 28.

A High-Throughput Workflow to Study Remodeling of Extracellular Matrix-Based Microtissues

Affiliations

A High-Throughput Workflow to Study Remodeling of Extracellular Matrix-Based Microtissues

Katherine A Cummins et al. Tissue Eng Part C Methods. 2019 Jan.

Erratum in

Abstract

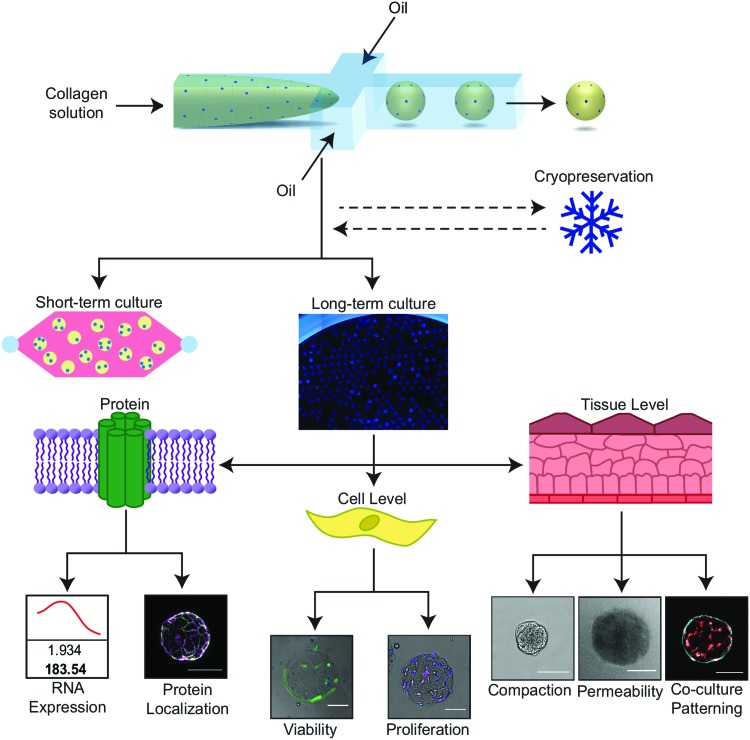
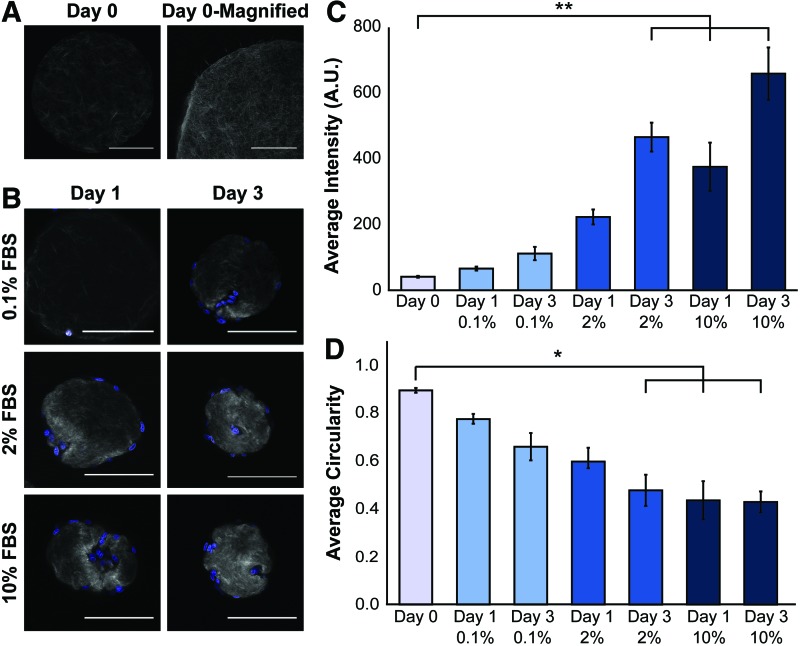
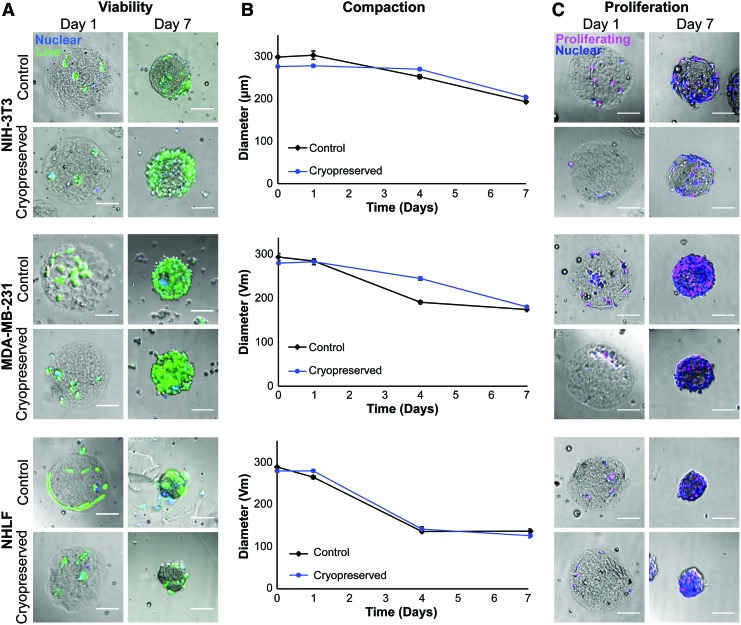
The described microtissue-microwell workflow is uniquely suited for high-throughput study of extracellular matrix (ECM) remodeling at the molecular, cellular, and tissue levels and demonstrates possibilities of studying progressive, heterogeneous diseases in a way that is meaningful for drug discovery and development. We outline several assays that can be utilized in studying tissue-level diseases and functions that involve cell-ECM interactions and ECM remodeling (e.g., cancer, fibrosis, wound healing) in pursuit of an improved three-dimensional cell culturing system. Finally, we demonstrate the ability to cryopreserve cells encapsulated in microtissue constructs while remaining highly viable, proliferative, and retaining cell functions that are involved in ECM remodeling.

Keywords: 3D cell culture; ECM remodeling; droplets; high-throughput screening; microfluidics; microtissues.


Conflict of interest statement

No competing financial interests exist.

Figures

<b>FIG. 1.</b>
FIG. 1.
The microtissue–microwell workflow facilitates functional and mechanistic analysis at multiple scales. Our workflow facilitates studies of tissue remodeling and disease progression on tissue, cellular, and subcellular scales in short- and long-term studies, while visualizing global and local behaviors. This system is compatible with a wide range of cell types, ECM proteins, and biological assays, making this a practical solution for high-throughput fabrication and handling of 3D tissue engineering construct. Scale bars are 100 μm. 3D, three-dimensional; ECM, extracellular matrix. Color images available online at www.liebertpub.com/tec
<b>FIG. 2.</b>
FIG. 2.
Microwells enabled long-term culture of large microtissue populations. (A) Brightfield imaging reveals that microtissues aggregate when cultured for 4 days in standard low adhesion plates. (B) Quantification of individual microtissues after 1 week of culture in standard low adhesion plates (blue bars) reveals that the population is reduced by over 100-fold. By contrast, microtissues cultured in patterned agarose microwells (red bars), remained separated over the same 1-week period. (C) To fabricate microwells, plasma-treated PDMS stamps with 300-μm diameter posts were placed into 2% agarose solution and (D) removed once polymerized. (E) Brightfield combined with blue fluorescence imaging shows microtissues contained in agarose microwells in a 12-well plate. Microtissues are labeled blue by encapsulating blue fluorescent beads within the polymerized collagen matrix. Scale bars 500 μm. PDMS, polydimethylsiloxane. Color images available online at www.liebertpub.com/tec
<b>FIG. 3.</b>
FIG. 3.
EDTA release allows for studying microtissue remodeling on short and long timescales. (A) Brightfield imaging of microtissues after 1 and 5 days of culture with encapsulated NHLFs or coated with NHLFs or HUVECs. The actin cytoskeleton was visualized with phalloidin (green) and nuclei with Draq5 (magenta). After 1 day, we observed a reduction in construct size, which was partially reversed after releasing cells with EDTA. After 5 days, this reversal was not observed. To quantify these effects with construct size, we measured (B) microtissue projected area and confirmed that on a population scale at early time points, compaction was partially reversible, while after 5 days of culture remodeling was not reversible. We calculated significance with a paired t-test with a Bonferroni correction for multiple comparisons (***p < 0.00025, *p < 0.013, standard error shown). Projected area is normalized to the average area of each microtissue batch after fabrication. (C) Fluorescence imaging with optical sectioning shows that fibronectin (green) and collagen IV (magenta) were deposited on the surface of the microtissues; however, the collagen IV was disrupted by EDTA treatment. All scale bars 100 μm and sample sizes are an average of 38 microtissues per condition. HUVECs, human umbilical vein endothelial cells; NHLFs, normal human lung fibroblasts. Color images available online at www.liebertpub.com/tec
<b>FIG. 4.</b>
FIG. 4.
Microwells facilitate tracking of discrete microtissues and coupling live imaging data with endpoint staining. (A) Brightfield and fluorescence imaging of collagen microtissues containing NHLFs and encapsulated fluorescent beads (blue) to mark construct borders were cultured in 0.1% (or 10%) serum for 1 week. All scale bars 100 μm. (B, C) Areas of 121 individual microtissues cultured in 0.1% FBS (B) and 137 constructs cultured in 10% FBS (C) were measured and plotted. A red dashed line indicates a threshold compaction level of 30% compaction. Projected area is normalized to day 0 for each microtissue compaction trajectory. (D) Population averages show similar compaction trajectories between 0.1% and 10% serum conditions. Shown with standard error. (E, F) Probability density functions of microtissue area at each time point reveal heterogeneity in the populations, indicated by bimodal distributions on day 1 (red) and day 2 (yellow) populations. (G) We observed a strong negative correlation between actin intensity and the time at which a 30% reduction in projected area occurred, as indicated by correlation coefficients of −0.68 and −0.65 for 0.1% and 10% FBS conditions, respectively. This suggests that a faster compaction rate is correlated to increased actin expression. We also found that higher serum conditions corresponded to elevated actin intensity and increased compaction rates. FBS, fetal bovine serum. Color images available online at www.liebertpub.com/tec
<b>FIG. 5.</b>
FIG. 5.
SHG microscopy revealed local ECM remodeling of collagen constructs. (A) Acellular collagen microtissues were coated with NHLFs and cultured for 3 days in varying serum concentrations. Collagen compaction and ECM remodeling were observed using SHG to visualize collagen fibers (gray) and Hoechst to stain the nuclei (blue). A section of an acellular slice is magnified (scale bar 50 μm) and the brightness adjusted to demonstrate the complex topography and fibrillar nature of the constructs. (B) Increased SHG signal intensity correlates to increased collagen fiber density and we qualitatively observed that with increasing serum and incubation time, cells interact with and increasingly modify their microenvironment. All other scale bars are 100 μm. (C) Average signal intensity from the collagen fibers was determined for each optical slice for each condition (n = 4–6 microtissues per condition). We observed that as serum concentrations increase, collagen fiber density increases due to compaction of fibroblasts. (D) Circularity of each construct is reported and with increasing serum concentrations and time, we found that microtissues became less circular (*p < 0.05, **p < 0.01, shown with standard error). SHG, second-harmonic generation. Color images available online at www.liebertpub.com/tec
<b>FIG. 6.</b>
FIG. 6.
Microtissues remain highly viable and functional after cryopreservation. (A) Brightfield and widefield fluorescence imaging of microtissues with encapsulated NIH 3T3, MDA-MB-231, and NHLF cells (nuclei shown in blue). Calcein AM (green) shows that all cell types had high viability (>83%) after 1 week of freezing and were over 90% viable after 1 week of culture in standard conditions, which was comparable to tissues that never underwent freezing. (B) Compaction of encapsulated cells indicated that before and after cryopreservation, cells were similarly contractile, compacting microtissues at similar rates and with the same trajectories. Shown with standard error and an average of 82 microtissues per condition. (C) Brightfield and widefield fluorescence imaging of cell proliferation after cryopreservation. Proliferative capacity, as determined with a Click-It EdU assay (nuclei shown in blue, proliferating cells in magenta). All microtissues in all conditions had cells that proliferated, indicating that cells retained their proliferative capacity after cryopreservation in the microtissues. All scale bars 100 μm. NIH 3T3, National Institute of Health 3T3. EdU, 5-ethynyl-2′-deoxyuridine. Color images available online at www.liebertpub.com/tec

References

    1. Lu P., Weaver V.M., and Werb Z. The extracellular matrix: a dynamic niche in cancer progression. J Cell Biol 196, 395, 2012 - PMC - PubMed
    1. Cox T.R., and Erler J.T. Remodeling and homeostasis of the extracellular matrix: implications for fibrotic diseases and cancer. Dis Models Mech 4, 165, 2011 - PMC - PubMed
    1. Venning F.A., Wullkopf L., and Erler J.T. Targeting ECM disrupts cancer progression. Front Oncol 5, 224, 2015 - PMC - PubMed
    1. Gialeli C., Theocharis A.D., and Karamanos N.K. Roles of matrix metalloproteinases in cancer progression and their pharmacological targeting. FEBS J 278, 16, 2011 - PubMed
    1. Klingberg F., Hinz B., and White E.S. The myofibroblast matrix: implications for tissue repair and fibrosis. J Pathol 229, 298, 2013 - PMC - PubMed

Publication types

Substances

LinkOut - more resources