

Astrocyte Elevated Gene 1 (AEG-1) Acts as a Promoter Gene in Clear Cell Renal Cell Carcinoma Cell Growth and Metastasis
- PMID: 30431025
- PMCID: PMC6253984
- DOI: 10.12659/MSM.911010
Astrocyte Elevated Gene 1 (AEG-1) Acts as a Promoter Gene in Clear Cell Renal Cell Carcinoma Cell Growth and Metastasis
Abstract
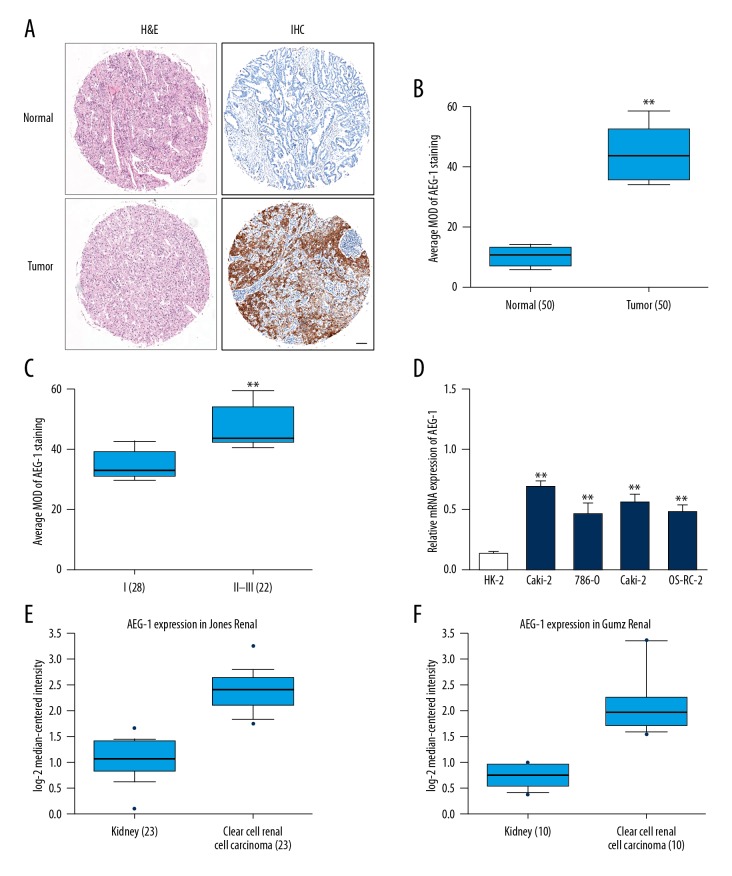
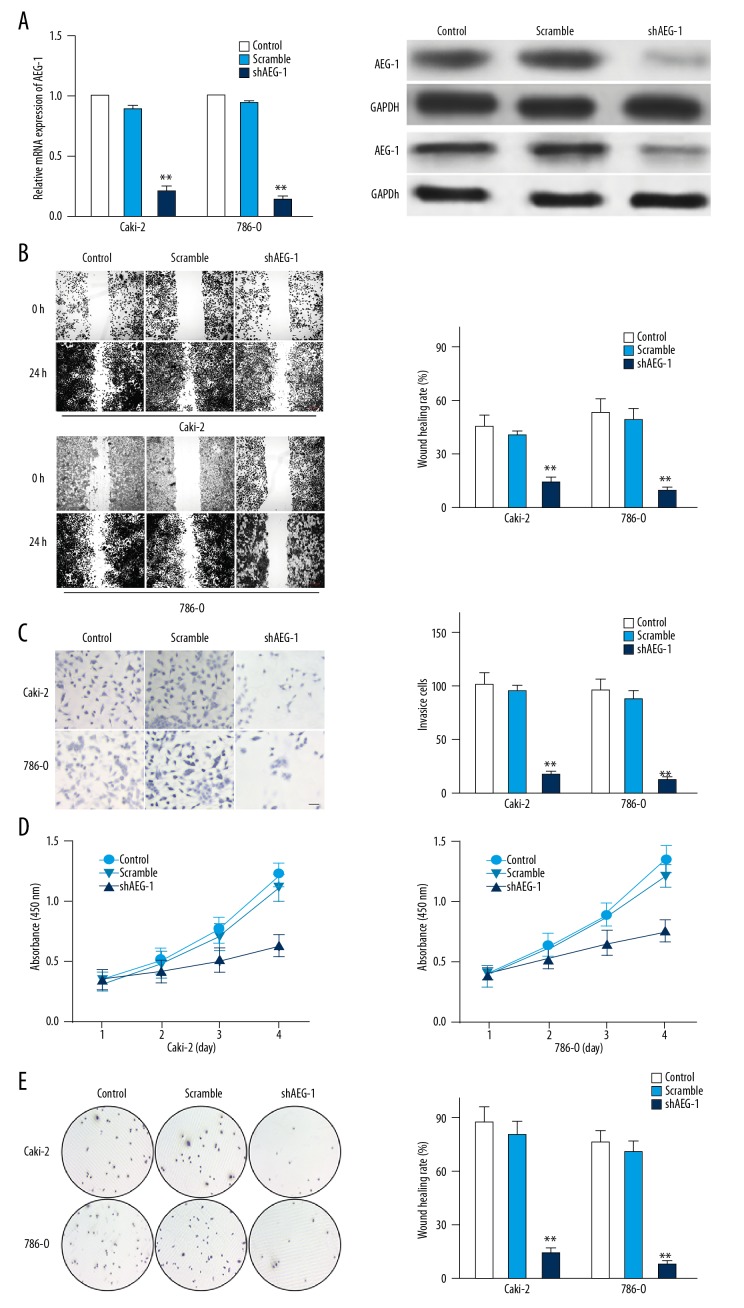
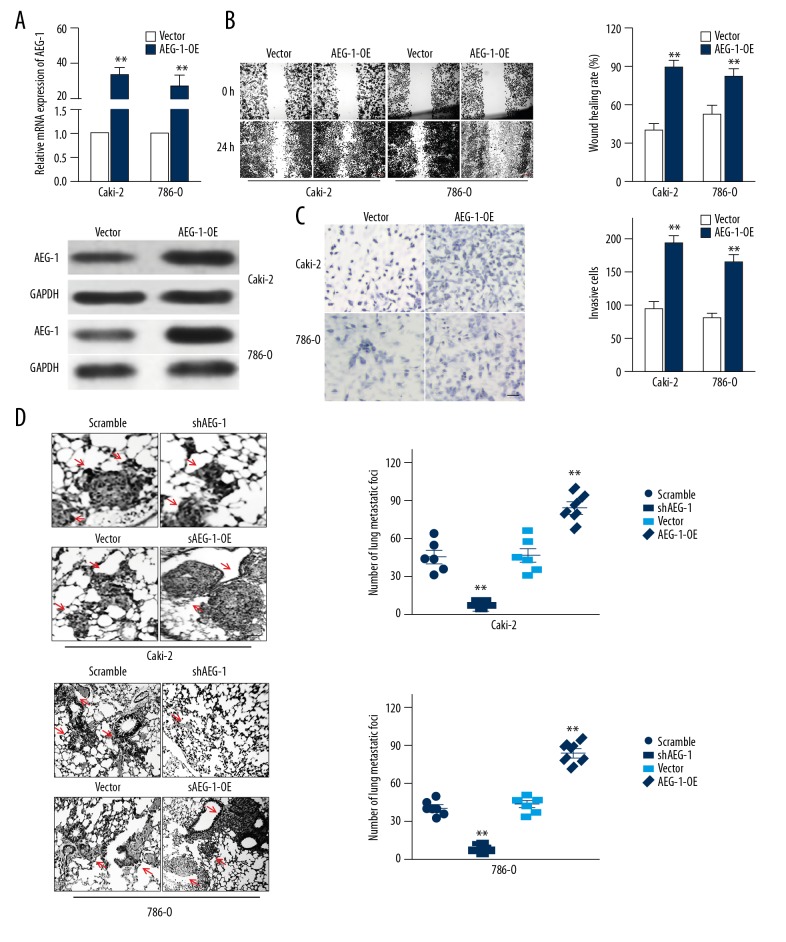
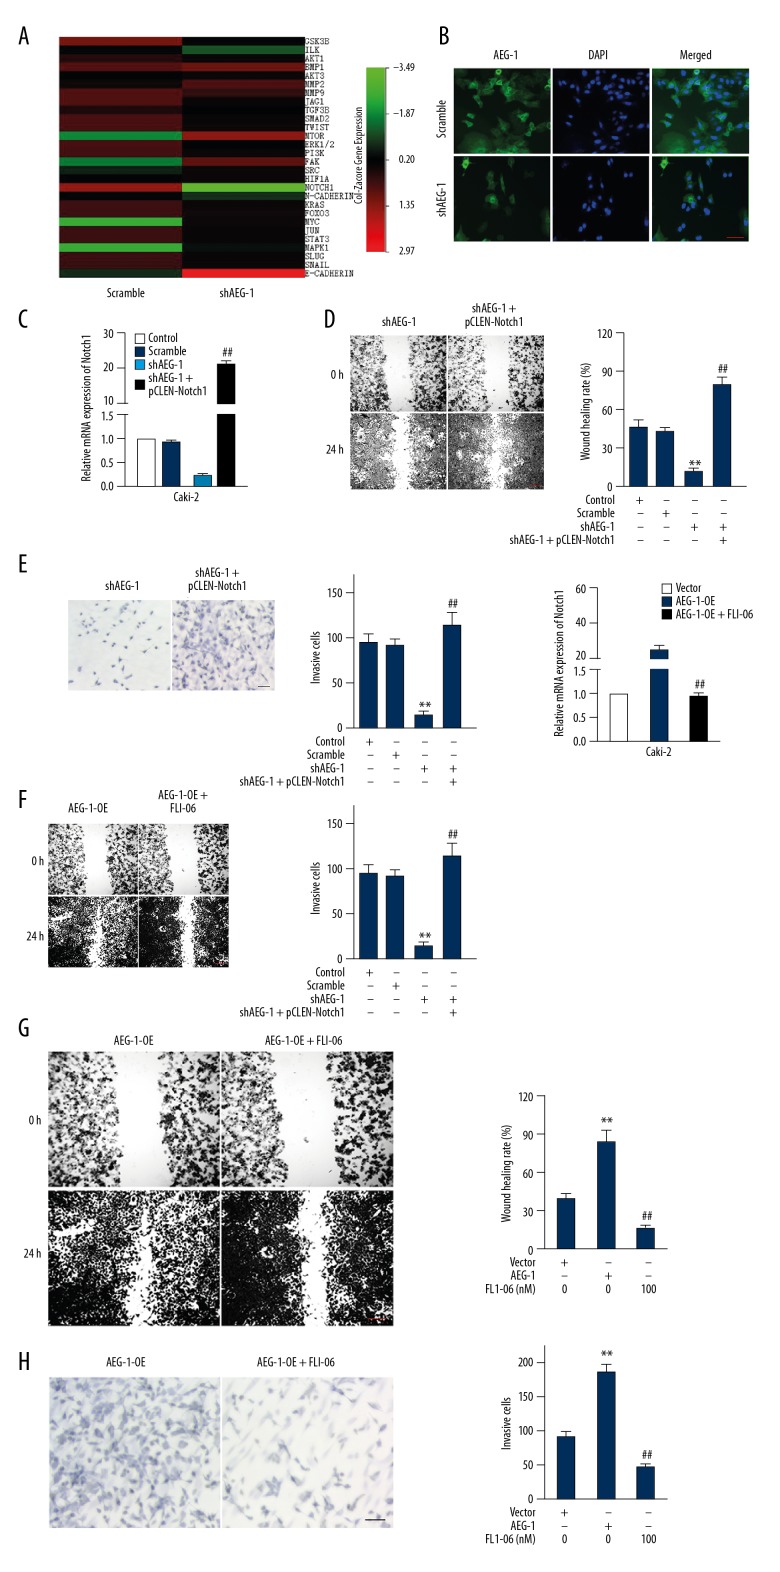
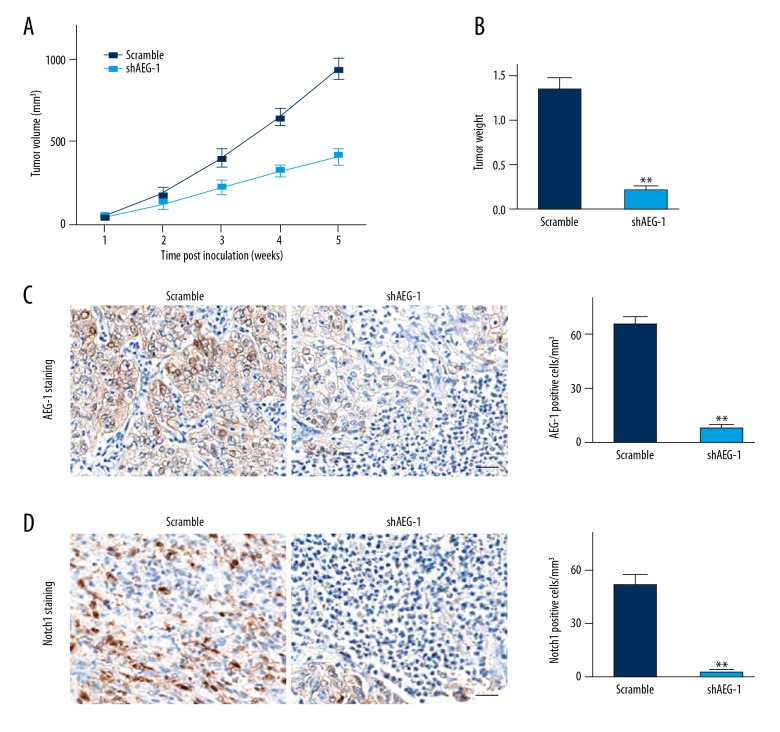
BACKGROUND Clear cell renal cell carcinoma (ccRCC) is usually incurable once it progresses to metastatic stage. Hence, in-depth investigations to reveal the precise molecular mechanisms behind the metastasis of ccRCC are required to improve the therapeutic outcome of ccRCC. MATERIAL AND METHODS The level of astrocyte elevated gene 1 (AEG-1) in ccRCC tissues and cell lines was determined by quantitative real-time PCR (qRT-PCR) assay. The MTS, colony formation, wound-healing, and Transwell invasion assays were used to assess the role of AEG-1 in ccRCC cells growth, migration, and invasion in vitro, respectively. Xenograft model and lung metastasis models were constructed to analyze the functions of AEG-1 in ccRCC cells growth and metastasis in vivo. RESULTS We found that AEG-1 was overexpressed in ccRCC and was associated with the progression of ccRCC. Knocked-down AEG-1 impaired the migration and invasion of ccRCC cells in vitro. Furthermore, under-expression of AEG-1 caused complete inhibition of ccRCC cells growth and metastasis in vivo. In contrast, overexpression of AEG-1 significantly increased the migration and invasion ability of ccRCC cells in vitro. Finally, we revealed that AEG-1 boosted the metastatic ability of ccRCC cells via regulating Notch homolog 1 (Notch1). CONCLUSIONS The AEG-1/Notch1 signaling axis plays a vital role in ccRCC cell growth and metastasis.
Conflict of interest statement
None.
Figures
Similar articles
-
Downregulation of CLDN7 due to promoter hypermethylation is associated with human clear cell renal cell carcinoma progression and poor prognosis.J Exp Clin Cancer Res. 2018 Nov 14;37(1):276. doi: 10.1186/s13046-018-0924-y. J Exp Clin Cancer Res. 2018. PMID: 30428910 Free PMC article.
-
Capn4 contributes to tumor invasion and metastasis in clear cell renal cell carcinoma cells via modulating talin-focal adhesion kinase signaling pathway.Acta Biochim Biophys Sin (Shanghai). 2018 May 1;50(5):465-472. doi: 10.1093/abbs/gmy031. Acta Biochim Biophys Sin (Shanghai). 2018. PMID: 29648579
-
Dicer is down-regulated in clear cell renal cell carcinoma and in vitro Dicer knockdown enhances malignant phenotype transformation.Urol Oncol. 2014 Jan;32(1):46.e9-17. doi: 10.1016/j.urolonc.2013.06.011. Epub 2013 Oct 4. Urol Oncol. 2014. PMID: 24094887
-
Astrocyte elevated gene-1: recent insights into a novel gene involved in tumor progression, metastasis and neurodegeneration.Pharmacol Ther. 2007 May;114(2):155-70. doi: 10.1016/j.pharmthera.2007.01.010. Epub 2007 Feb 24. Pharmacol Ther. 2007. PMID: 17397930 Free PMC article. Review.
-
Astrocyte elevated gene-1 (AEG-1): A multifunctional regulator of normal and abnormal physiology.Pharmacol Ther. 2011 Apr;130(1):1-8. doi: 10.1016/j.pharmthera.2011.01.008. Epub 2011 Jan 20. Pharmacol Ther. 2011. PMID: 21256156 Free PMC article. Review.
Cited by
-
MYCN-mediated regulation of the HES1 promoter enhances the chemoresistance of small-cell lung cancer by modulating apoptosis.Am J Cancer Res. 2019 Sep 1;9(9):1938-1956. eCollection 2019. Am J Cancer Res. 2019. PMID: 31598396 Free PMC article.
References
-
- Jingushi K, Kashiwagi Y, Ueda Y, et al. High miR-122 expression promotes malignant phenotypes in ccRCC by targeting occludin. Int J Oncol. 2017;51:289–97. - PubMed
-
- Kroeger N, Seligson DB, Signoretti S, et al. Poor prognosis and advanced clinicopathological features of clear cell renal cell carcinoma (ccRCC) are associated with cytoplasmic subcellular localisation of Hypoxia inducible factor-2alpha. Eur J Cancer. 2014;50:1531–40. - PubMed
MeSH terms
Substances
LinkOut - more resources
Full Text Sources
Medical
Research Materials
