Genistein attenuates renal fibrosis in streptozotocin‑induced diabetic rats
- PMID: 30431100
- PMCID: PMC6297769
- DOI: 10.3892/mmr.2018.9635
Genistein attenuates renal fibrosis in streptozotocin‑induced diabetic rats
Abstract
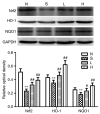
The present study aimed to investigate the antifibrogenic effects of genistein (GEN) on the kidney in streptozotocin (STZ)‑induced diabetic rats and to determine the associated mechanisms. Rats were randomized into four groups: Normal control (N), STZ (S), L (STZ + low‑dose GEN) and H (STZ + high‑dose GEN). After 8 weeks, the fasting blood glucose (FBG) level, the ratio of kidney weight to body weight (renal index), 24‑h urine protein, blood urea nitrogen (BUN), serum creatinine (SCr), renal total antioxidant capacity (T‑AOC), superoxide dismutase (SOD), lipid peroxidation (LPO), malondialdehyde (MDA) and hydroxyproline (Hyp) contents were measured. The histomorphology and ultrastructure of the kidney were also assessed. In addition, mRNA expression levels of transforming growth factor‑β1 (TGF‑β1) and protein expression levels of nuclear factor erythroid 2‑related factor 2 (Nrf2), heme oxygenase‑1 (HO‑1), NAD(P)H:quinone oxidoreductase 1 (NQO1), TGF‑β1, mothers against decapentaplegic homolog 3 (Smad3), phosphorylated (p)‑Smad3 and collagen IV were estimated. Compared with group N, the levels of FBG, renal index, 24‑h urine protein, BUN, SCr, LPO, MDA and Hyp were increased, whereas the levels of T‑AOC and SOD were decreased in group S. The structure of renal tissue was damaged, and the expression of Nrf2, HO‑1 and NQO1 were reduced, whereas the expression of TGF‑β1, Smad3, p‑Smad3 and collagen IV were increased in group S. Compared with group S, the aforementioned indices were improved in groups L and H. In conclusion, GEN exhibited reno‑protective effects in diabetic rats and its mechanisms may be associated with the inhibition of oxidative stress by activating the Nrf2‑HO‑1/NQO1 pathway, and the alleviation of renal fibrosis by suppressing the TGF‑β1/Smad3 pathway.
Keywords: genistein; diabetes mellitus; rat; renal fibrosis; oxidative stress; ransforming growth factor‑β1/mothers against decapentaplegic homolog 3 pathway.
Figures


Similar articles
-
Effect of genistein on myocardial fibrosis in diabetic rats and its mechanism.Mol Med Rep. 2018 Feb;17(2):2929-2936. doi: 10.3892/mmr.2017.8268. Epub 2017 Dec 12. Mol Med Rep. 2018. PMID: 29257312 Free PMC article.
-
Artemisinin attenuates early renal damage on diabetic nephropathy rats through suppressing TGF-β1 regulator and activating the Nrf2 signaling pathway.Life Sci. 2020 Sep 1;256:117966. doi: 10.1016/j.lfs.2020.117966. Epub 2020 Jun 11. Life Sci. 2020. PMID: 32535079
-
Protective effect of Icariin on the early stage of experimental diabetic nephropathy induced by streptozotocin via modulating transforming growth factor β1 and type IV collagen expression in rats.J Ethnopharmacol. 2011 Dec 8;138(3):731-6. doi: 10.1016/j.jep.2011.10.015. Epub 2011 Oct 19. J Ethnopharmacol. 2011. PMID: 22027446
-
Mangiferin Alleviates Renal Interstitial Fibrosis in Streptozotocin-Induced Diabetic Mice through Regulating the PTEN/PI3K/Akt Signaling Pathway.J Diabetes Res. 2020 Jan 31;2020:9481720. doi: 10.1155/2020/9481720. eCollection 2020. J Diabetes Res. 2020. PMID: 32076626 Free PMC article.
-
Genistein as a renoprotective agent: mechanistic insights into antioxidant, anti-inflammatory, and fibrosis-regulating pathways.Mol Biol Rep. 2025 May 24;52(1):500. doi: 10.1007/s11033-025-10603-2. Mol Biol Rep. 2025. PMID: 40411620 Review.
Cited by
-
Oxidative Stress and NRF2/KEAP1/ARE Pathway in Diabetic Kidney Disease (DKD): New Perspectives.Biomolecules. 2022 Sep 2;12(9):1227. doi: 10.3390/biom12091227. Biomolecules. 2022. PMID: 36139066 Free PMC article. Review.
-
Sinapic Acid Ameliorates the Progression of Streptozotocin (STZ)-Induced Diabetic Nephropathy in Rats via NRF2/HO-1 Mediated Pathways.Front Pharmacol. 2020 Jul 23;11:1119. doi: 10.3389/fphar.2020.01119. eCollection 2020. Front Pharmacol. 2020. PMID: 32792955 Free PMC article.
-
Exogenous H2S mitigates myocardial fibrosis in diabetic rats through suppression of the canonical Wnt pathway.Int J Mol Med. 2019 Aug;44(2):549-558. doi: 10.3892/ijmm.2019.4237. Epub 2019 Jun 10. Int J Mol Med. 2019. PMID: 31198980 Free PMC article.
-
A Review of Medicinal Plants with Renoprotective Activity in Diabetic Nephropathy Animal Models.Life (Basel). 2023 Feb 16;13(2):560. doi: 10.3390/life13020560. Life (Basel). 2023. PMID: 36836916 Free PMC article. Review.
-
A Review of the Potential of Nuclear Factor [Erythroid-Derived 2]-like 2 Activation in Autoimmune Diseases.Brain Sci. 2023 Oct 30;13(11):1532. doi: 10.3390/brainsci13111532. Brain Sci. 2023. PMID: 38002492 Free PMC article. Review.
References
-
- Tominaga T, Abe H, Ueda O, Goto C, Nakahara K, Murakami T, Matsubara T, Mima A, Nagai K, Araoka T, et al. Activation of bone morphogenetic protein 4 signaling leads to glomerulosclerosis that mimics diabetic nephropathy. J Biol Chem. 2011;286:20109–20116. doi: 10.1074/jbc.M110.179382. - DOI - PMC - PubMed
MeSH terms
Substances
LinkOut - more resources
Full Text Sources
Other Literature Sources
Medical
Miscellaneous

