

Duration of postoperative immobilization affects MMP activity at the healing graft-bone interface: Evaluation in a mouse ACL reconstruction model
- PMID: 30431170
- PMCID: PMC6411439
- DOI: 10.1002/jor.24177
Duration of postoperative immobilization affects MMP activity at the healing graft-bone interface: Evaluation in a mouse ACL reconstruction model
Abstract
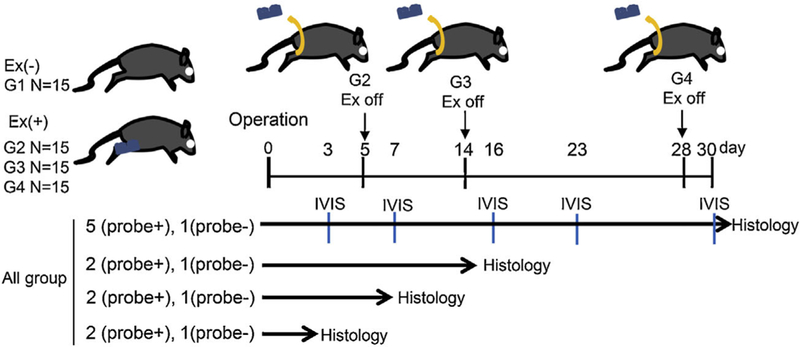
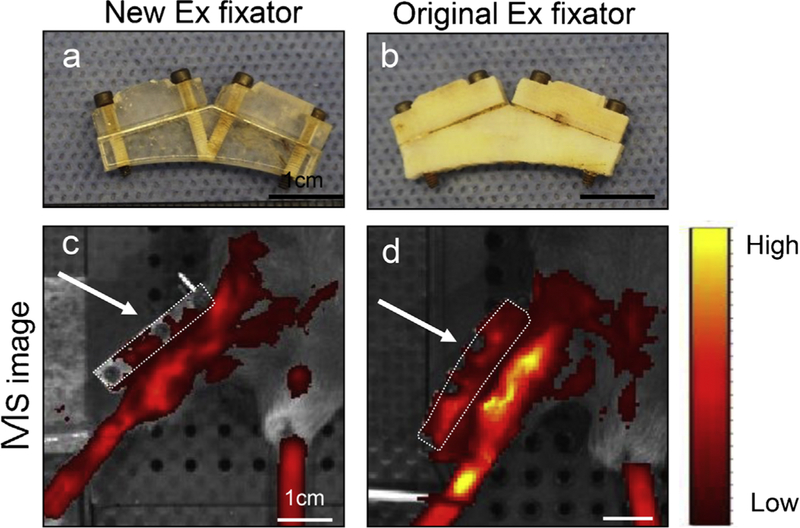
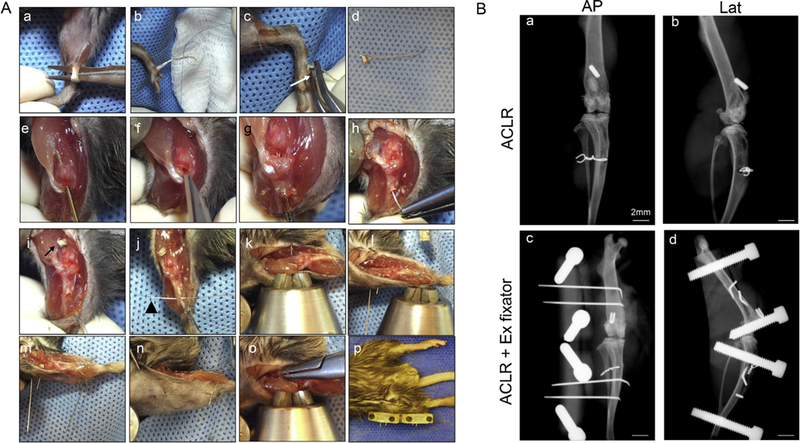
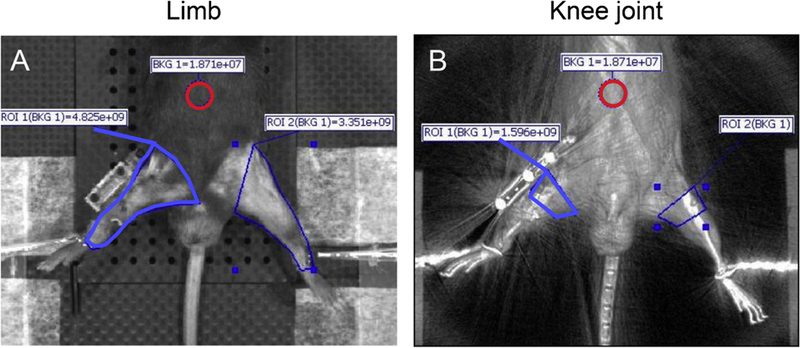
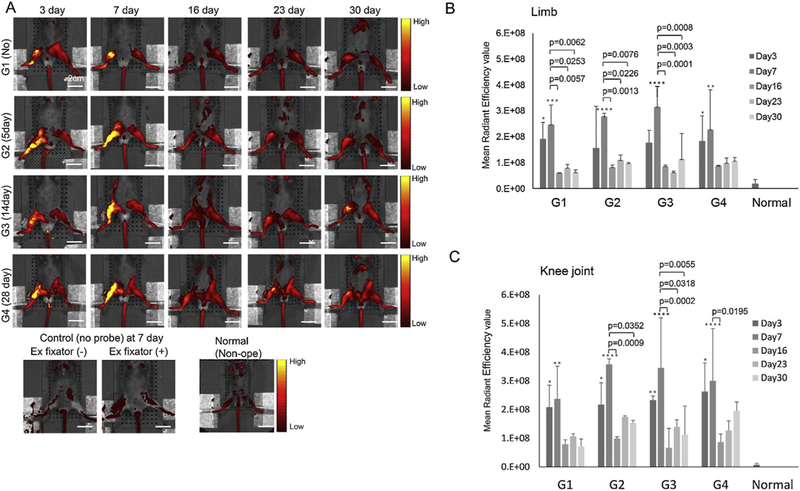
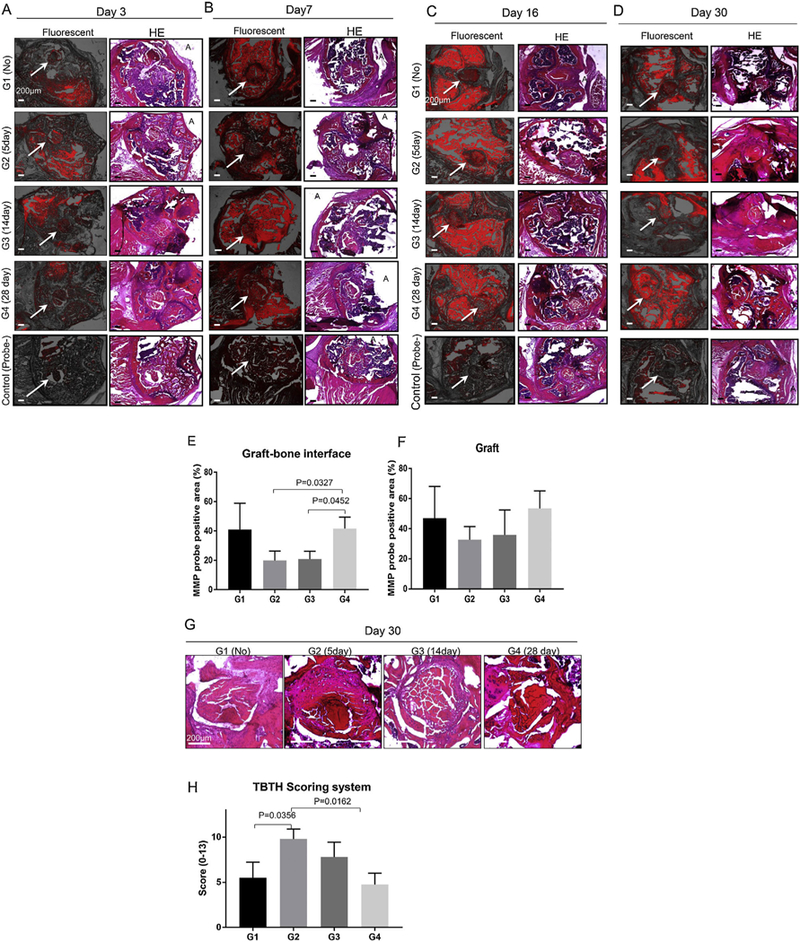
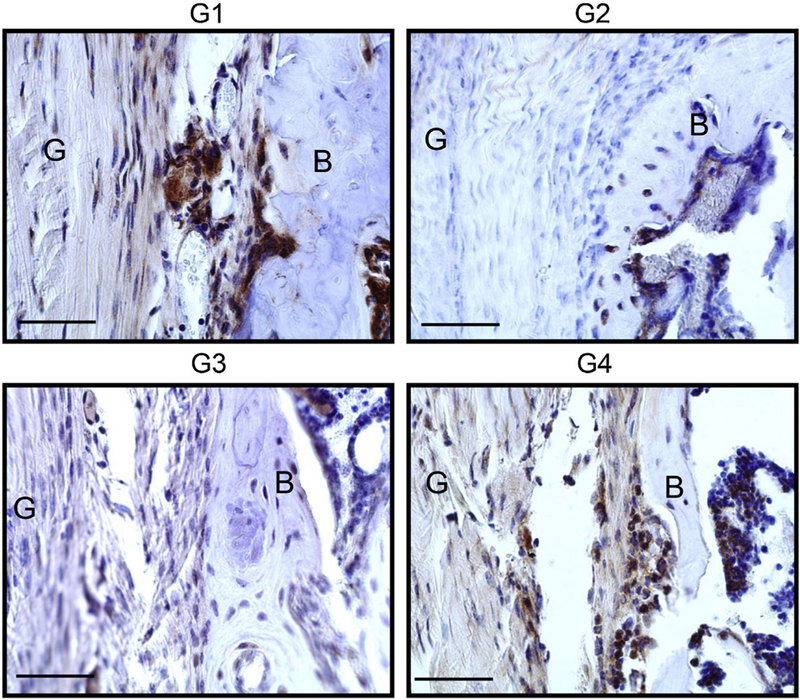
Excessive MMP activity may impair tendon-to-bone healing. However, little is known about the effect of joint motion on MMP activity after ACL reconstruction. The aim of this study was to determine the effect of different durations of knee immobilization on MMP activity in a mouse ACL reconstruction model using a fluorescent MMP probe which detects MMP 2, 3, 9, and 13 and near-infra red in vivo imaging. Sixty C57BL male mice underwent ACL reconstruction. Post-operatively, the animals were treated with free cage activity (Group 1), or with the use of an external fixator to restrict knee motion and weight bearing for 5 days (Group 2), 14 days (Group 3), and 28 days (Group 4). At days 3, 7, 16, 23, and 30, five mice underwent IVIS imaging. At days 3, 7, 16, and 30, histological analysis was also performed. Probe signal intensity in the whole limb peaked at day 7, followed by a decrease at day 16, and maintenance up to day 30. There was no significant difference among groups at any time point based on IVIS, but histologic localization of MMP probe signal showed significantly less activity in Group 2 and Group 3 compared to Group 4 in the bone tunnel at day 30. We demonstrated that short-term immobilization led to less MMP activity around the bone tunnel compared with prolonged immobilization. A short period of immobilization after ACL reconstruction might enhance graft-bone interface healing by mitigating excess MMP expression. These findings have implications for post-operative rehabilitation protocols following ACL reconstruction. © 2018 Orthopaedic Research Society. Published by Wiley Periodicals, Inc. J Orthop Res 37:325-334, 2019.
Keywords: ACL reconstruction; MMP; graft-bone interface healing; immobilization.
© 2018 Orthopaedic Research Society. Published by Wiley Periodicals, Inc.
Figures
Similar articles
-
Timing of Postoperative Mechanical Loading Affects Healing Following Anterior Cruciate Ligament Reconstruction: Analysis in a Murine Model.J Bone Joint Surg Am. 2017 Aug 16;99(16):1382-1391. doi: 10.2106/JBJS.17.00133. J Bone Joint Surg Am. 2017. PMID: 28816898
-
Effect of Dynamic Changes in Anterior Cruciate Ligament In Situ Graft Force on the Biological Healing Response of the Graft-Tunnel Interface.Am J Sports Med. 2018 Mar;46(4):915-923. doi: 10.1177/0363546517745624. Epub 2018 Jan 3. Am J Sports Med. 2018. PMID: 29298079
-
Restriction of Postoperative Joint Loading in a Murine Model of Anterior Cruciate Ligament Reconstruction: Botulinum Toxin Paralysis and External Fixation.J Knee Surg. 2017 Sep;30(7):687-693. doi: 10.1055/s-0036-1597274. Epub 2016 Dec 1. J Knee Surg. 2017. PMID: 27907934
-
Tendon Healing in Bone Tunnel after Human Anterior Cruciate Ligament Reconstruction: A Systematic Review of Histological Results.J Knee Surg. 2019 May;32(5):454-462. doi: 10.1055/s-0038-1653964. Epub 2018 May 21. J Knee Surg. 2019. PMID: 29783272
-
Effects of ACL graft placement on in vivo knee function and cartilage thickness distributions.J Orthop Res. 2017 Jun;35(6):1160-1170. doi: 10.1002/jor.23541. Epub 2017 Mar 24. J Orthop Res. 2017. PMID: 28213953 Free PMC article. Review.
Cited by
-
Mechanical stimulation improves rotator cuff tendon-bone healing via activating IL-4/JAK/STAT signaling pathway mediated macrophage M2 polarization.J Orthop Translat. 2022 Oct 6;37:78-88. doi: 10.1016/j.jot.2022.08.008. eCollection 2022 Nov. J Orthop Translat. 2022. PMID: 36262964 Free PMC article.
-
Biomechanical, histologic, and molecular characteristics of graft-tunnel healing in a murine modified ACL reconstruction model.J Orthop Translat. 2020 Jun 2;24:103-111. doi: 10.1016/j.jot.2020.05.004. eCollection 2020 Sep. J Orthop Translat. 2020. PMID: 32775202 Free PMC article.
-
Effects of Joint Immobilization and Treadmill Exercise on Articular Cartilage After ACL Reconstruction in Rats.Orthop J Sports Med. 2022 Oct 17;10(10):23259671221123543. doi: 10.1177/23259671221123543. eCollection 2022 Oct. Orthop J Sports Med. 2022. PMID: 36276424 Free PMC article.
-
Immobilization after injury alters extracellular matrix and stem cell fate.J Clin Invest. 2020 Oct 1;130(10):5444-5460. doi: 10.1172/JCI136142. J Clin Invest. 2020. PMID: 32673290 Free PMC article.
-
Platelet-rich plasma injections induce disease-modifying effects in the treatment of osteoarthritis in animal models.Knee Surg Sports Traumatol Arthrosc. 2021 Dec;29(12):4100-4121. doi: 10.1007/s00167-021-06659-9. Epub 2021 Aug 2. Knee Surg Sports Traumatol Arthrosc. 2021. PMID: 34341845
References
-
- Ellman MB, Sherman SL, Forsythe B, et al. 2015. Return to play following anterior cruciate ligament reconstruction. J Am Acad Orthop Surg 23:283–296. - PubMed
-
- Webster KE, Feller JA, Hartnett N, et al. 2016. Comparison of patellar tendon and hamstring tendon anterior cruciate ligament reconstruction: a 15-year follow-up of a randomized controlled trial. Am J Sports Med 44:83–90. - PubMed
-
- Pasternak B, Schepull T, Eliasson P, et al. 2010. Elevation of systemic matrix metalloproteinases 2 and 7 and tissue inhibitor of metalloproteinase 2 in patients with a history of Achilles tendon rupture: pilot study. Br J Sports Med 44:669–672. - PubMed
-
- Hirata M, Kugimiya F, Fukai A, et al. 2012. C/EBPbeta and RUNX2 cooperate to degrade cartilage with MMP-13 as the target and HIF-2alpha as the inducer in chondrocytes. Hum Mol Genet 21:1111–1123. - PubMed
-
- Bedi A, Kovacevic D, Hettrich C, et al. 2010. The effect of matrix metalloproteinase inhibition on tendon-to-bone healing in a rotator cuff repair model. J Shoulder Elbow Surg 19:384–391. - PubMed
MeSH terms
Substances
Grants and funding
LinkOut - more resources
Full Text Sources
Medical
Research Materials
