

3D gradient echo snapshot CEST MRI with low power saturation for human studies at 3T
- PMID: 30431179
- PMCID: PMC6718050
- DOI: 10.1002/mrm.27569
3D gradient echo snapshot CEST MRI with low power saturation for human studies at 3T
Abstract
Purpose: For clinical implementation, a chemical exchange saturation transfer (CEST) imaging sequence must be fast, with high signal-to-noise ratio (SNR), 3D coverage, and produce robust contrast. However, spectrally selective CEST contrast requires dense sampling of the Z-spectrum, which increases scan duration. This article proposes a compromise: using a 3D snapshot gradient echo (GRE) readout with optimized CEST presaturation, sampling, and postprocessing, highly resolved Z-spectroscopy at 3T is made possible with 3D coverage at almost no extra time cost.
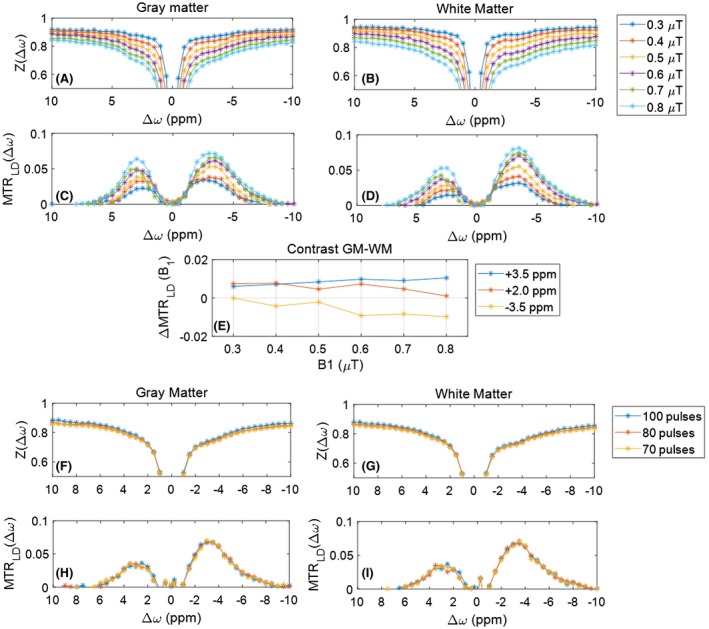
Methods: A 3D snapshot CEST sequence was optimized for low-power CEST MRI at 3T. Pulsed saturation was optimized for saturation power and saturation duration. Spectral sampling and postprocessing (B0 correction, denoising) was optimized for spectrally selective Lorentzian CEST effect extraction. Reproducibility was demonstrated in 3 healthy volunteers and feasibility was shown in 1 tumor patient.
Results: Low-power saturation was achieved by a train of 80 pulses of duration tp = 20 ms (total saturation time tsat = 3.2 seconds at 50% duty cycle) with B1 = 0.6 μT at 54 irradiation frequency offsets. With the 3D snapshot CEST sequence, a 180 × 220 × 54 mm field of view was acquired in 7 seconds per offset. Spectrally selective CEST effects at +3.5 and -3.5 ppm were quantified using multi-Lorentzian fitting. Reproducibility was high with an intersubject coefficient of variation below 10% in CEST contrasts. Amide and nuclear overhauser effect CEST effects showed similar correlations in tumor and necrosis as show in previous ultra-high field work.
Conclusion: A sophisticated CEST tool ready for clinical application was developed and tested for feasibility.
Keywords: APT; NOE; brain tumor; chemical exchange saturation transfer; magnetization transfer.
© 2018 International Society for Magnetic Resonance in Medicine.
Figures


Similar articles
-
Whole brain snapshot CEST at 3T using 3D-EPI: Aiming for speed, volume, and homogeneity.Magn Reson Med. 2020 Nov;84(5):2469-2483. doi: 10.1002/mrm.28298. Epub 2020 May 9. Magn Reson Med. 2020. PMID: 32385888
-
Chemical exchange saturation transfer MRI contrast in the human brain at 9.4 T.Neuroimage. 2018 Oct 1;179:144-155. doi: 10.1016/j.neuroimage.2018.06.026. Epub 2018 Jun 15. Neuroimage. 2018. PMID: 29894826
-
Systematic Evaluation of Amide Proton Chemical Exchange Saturation Transfer at 3 T: Effects of Protein Concentration, pH, and Acquisition Parameters.Invest Radiol. 2016 Oct;51(10):635-46. doi: 10.1097/RLI.0000000000000292. Invest Radiol. 2016. PMID: 27272542
-
Ytterbium chelated to 1,4,7,10-tetraazacyclododecane-1,4,7-triacetic acid,10-orthoaminoanilide.2011 Nov 26 [updated 2012 Jan 5]. In: Molecular Imaging and Contrast Agent Database (MICAD) [Internet]. Bethesda (MD): National Center for Biotechnology Information (US); 2004–2013. 2011 Nov 26 [updated 2012 Jan 5]. In: Molecular Imaging and Contrast Agent Database (MICAD) [Internet]. Bethesda (MD): National Center for Biotechnology Information (US); 2004–2013. PMID: 22238803 Free Books & Documents. Review.
-
Magnetization Transfer Contrast and Chemical Exchange Saturation Transfer MRI. Features and analysis of the field-dependent saturation spectrum.Neuroimage. 2018 Mar;168:222-241. doi: 10.1016/j.neuroimage.2017.04.045. Epub 2017 Apr 21. Neuroimage. 2018. PMID: 28435103 Free PMC article. Review.
Cited by
-
Current emerging MRI tools for radionecrosis and pseudoprogression diagnosis.Curr Opin Oncol. 2021 Nov 1;33(6):597-607. doi: 10.1097/CCO.0000000000000793. Curr Opin Oncol. 2021. PMID: 34534142 Free PMC article. Review.
-
Reproducibility of 3D chemical exchange saturation transfer (CEST) contrasts in the healthy brain at 3T.Sci Rep. 2024 Oct 27;14(1):25637. doi: 10.1038/s41598-024-75777-4. Sci Rep. 2024. PMID: 39465319 Free PMC article.
-
A fast multislice sequence for 3D MRI-CEST pH imaging.Magn Reson Med. 2021 Mar;85(3):1335-1349. doi: 10.1002/mrm.28516. Epub 2020 Oct 8. Magn Reson Med. 2021. PMID: 33031591 Free PMC article.
-
Angiopep-2, an MRI Biomarker, Dynamically Monitors Amyloid Deposition in Early Alzheimer's Disease.ACS Chem Neurosci. 2023 Jan 18;14(2):226-234. doi: 10.1021/acschemneuro.2c00513. Epub 2023 Jan 4. ACS Chem Neurosci. 2023. PMID: 36599050 Free PMC article.
-
Multiparametric Chemical Exchange Saturation Transfer MRI Detects Metabolic Changes in Mild Cognitive Impairment Cases at 3.0 Tesla.Neurochem Res. 2024 Dec 9;50(1):51. doi: 10.1007/s11064-024-04307-5. Neurochem Res. 2024. PMID: 39648256
References
-
- Forsen S, Hoffman RA. Study of moderately rapid chemical exchange reactions by means of nuclear magnetic double resonance. J Chem Phys. 1963;39:2892–2901.
-
- Ward K, Aletras A, Balaban R. A new class of contrast agents for MRI based on proton chemical exchange dependent saturation transfer (CEST). J Magn Reson. 2000;143:79–87. - PubMed
-
- Zhou J, Payen JF, Wilson DA, Traystman RJ, van Zijl P. Using the amide proton signals of intracellular proteins and peptides to detect pH effects in MRI. Nat Med. 2003;9:1085–1090. - PubMed
-
- Zaiss M, Windschuh J, Paech D, et al. Relaxation‐compensated CEST‐MRI of the human brain at 7T: unbiased insight into NOE and amide signal changes in human glioblastoma. NeuroImage. 2015;112:180–188. - PubMed
Publication types
MeSH terms
Substances
Grants and funding
LinkOut - more resources
Full Text Sources
Other Literature Sources
Medical
Research Materials
