. 2019 Feb 1;129(2):631-646.
doi: 10.1172/JCI123027. Epub 2019 Jan 7.

Lactate inhibits ATP6V0d2 expression in tumor-associated macrophages to promote HIF-2α-mediated tumor progression

Affiliations

Lactate inhibits ATP6V0d2 expression in tumor-associated macrophages to promote HIF-2α-mediated tumor progression

Na Liu et al. J Clin Invest. .

Abstract

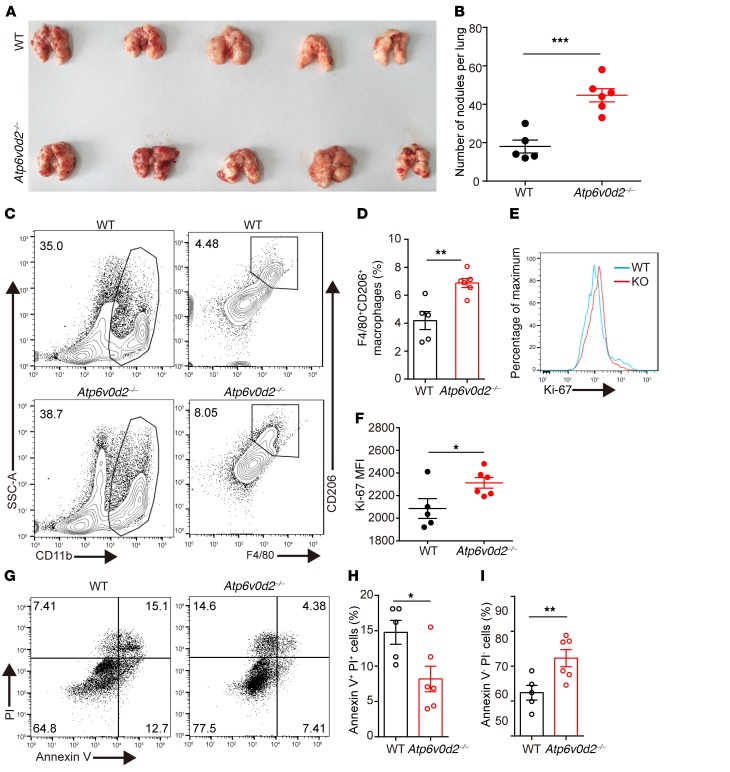
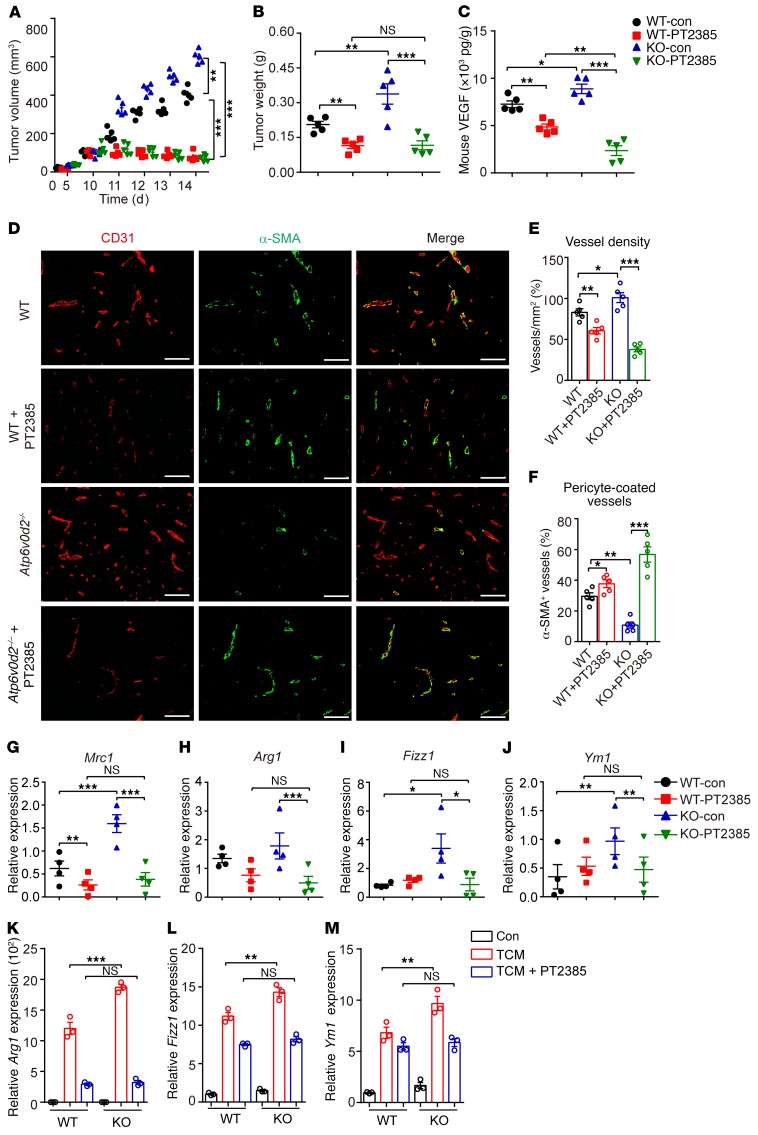
Macrophages perform key functions in tissue homeostasis that are influenced by the local tissue environment. Within the tumor microenvironment, tumor-associated macrophages can be altered to acquire properties that enhance tumor growth. Here, we found that lactate, a metabolite found in high concentration within the anaerobic tumor environment, activated mTORC1 that subsequently suppressed TFEB-mediated expression of the macrophage-specific vacuolar ATPase subunit ATP6V0d2. Atp6v0d2-/- mice were more susceptible to tumor growth, with enhanced HIF-2α-mediated VEGF production in macrophages that display a more protumoral phenotype. We found that ATP6V0d2 targeted HIF-2α but not HIF-1α for lysosome-mediated degradation. Blockade of HIF-2α transcriptional activity reversed the susceptibility of Atp6v0d2-/- mice to tumor development. Furthermore, in a cohort of patients with lung adenocarcinoma, expression of ATP6V0d2 and HIF-2α was positively and negatively correlated with survival, respectively, suggesting a critical role of the macrophage lactate/ATP6V0d2/HIF-2α axis in maintaining tumor growth in human patients. Together, our results highlight the ability of tumor cells to modify the function of tumor-infiltrating macrophages to optimize the microenvironment for tumor growth.

Keywords: Immunology; Lysosomes; Macrophages; Oncology.


Conflict of interest statement

Conflict of interest: The authors have declared that no conflict of interest exists.

Figures

Figure 1
Figure 1. Lactate activates mTORC1 signaling to suppress Atp6v0d2 expression in macrophages.
(AC, E, and F) Atp6v0d2 mRNA expression was determined by qRT-PCR. (A and B) LLC tumor-conditioned medium (TCM) was collected after 5 days culture of LLC cells (100% confluence). BMDMs were stimulated with LLC TCM (A) or a concentration gradient of LLC TCM (B) for 6 hours. (C) BMDMs were stimulated with medium, LLC TCM, or boiled LLC TCM (b-TCM; 100°C, 5 minutes) for 6 hours. (D) Lactate concentration in LLC TCM was determined. (E) BMDMs were stimulated with a concentration gradient of lactate for 6 hours. (F) BMDMs were stimulated with LLC TCM alone, or with the addition of different doses of 2-cyano-3-(4-hydroxyphenyl)-2-propenoic acid (CHC), a monocarboxylate channel transporter inhibitor. (G and H) Representative histograms (G) and bar chart (H) show the mean fluorescence intensity (MFI) for pS6 expression on macrophages that were starved with Earle’s balanced salt solution (EBSS) for 2 hours, followed by replacement with fresh medium (control), or fresh medium with lactate, b-TCM, or TCM for 1 hour. (I) BMDMs were starved with EBSS for 2 hours, followed by replacement with fresh medium in the presence of lactate (40 mM) or complete TCM for the indicated times. The amounts of nuclear-cytoplasmic fractionation of TFEB and pS6 were determined by immunoblot and amounts of TFEB in the nuclei were quantified relative to lamin B1. (J) RAW264.7 cells were stimulated with lactate (40 mM) or TCM for 4 hours and the binding of TFEB in the Atp6v0d2 promoter was determined by chromatin immunoprecipitation. (K and L) BMDMs were stimulated with lactate (K) or TCM (L) for 6 hours in the presence or absence of 15-minute pretreatment with Torin (1 μM). Atp6v0d2 mRNA expression was determined by qRT-PCR. Data are representative of 3 independent experiments (AI). Data were assessed by unpaired Student’s t test (A), 1-way ANOVA with Turkey’s test (B, C, E, F, and L) and are represented as mean ± SEM. *P < 0.05, **P < 0.01, ***P < 0.001. LA, lactate.
Figure 2
Figure 2. Atp6v0d2–/– mice are more susceptible to tumorigenesis.
(AC) Comparison of LLC tumor growth in WT and Atp6v0d2–/– mice (n = 7) after implantation: tumor growth rate (A), tumor weight (B), and representative images of excised tumors (C). (DF) Tumor growth of B16-F10 in WT and Atp6v0d2–/– mice (n = 5) after implantation: tumor growth rate (D), tumor weight (E), and representative images of excised tumors (F). (G) Immunoblot analysis of ATP6V0d2 expression in macrophages, CD4+ T cells, CD8+ T cells, fibroblasts, TAMs, B16-F1, B16-F10, and LLC cells. (HK) Atp6v0d2–/– mice were challenged s.c. with 5 × 10⁵ LLC cells alone, or together with 2 × 10⁵ either WT BMDMs or Atp6v0d2–/– BMDMs (n = 5). Tumor size was measured every 2 to 3 days (H). Tumor mass was determined at day 15 after inoculation (I). Representative images of tumors are presented (J). All experiments except HJ were repeated 2 times. Data were assessed by unpaired Student’s t test (A, B, D, and E) or 1-way ANOVA with Turkey’s post hoc test (H and I) and are represented as mean ± SEM. *P < 0.05; **P < 0.01; ***P < 0.001. NS, not significant. Scale bars: 5 mm (C, F, and J).
Figure 3
Figure 3. Atp6v0d2-deficient mice were more susceptible to lung metastasis.
(AI) WT and Atp6v0d2–/– mice were injected i.v. with 8 × 10⁵ LLC cells. On day 15 after injection, mice were sacrificed. (A and B) Images (A) and quantification analysis (B) of lung metastasis of WT (n = 5) and Atp6v0d2–/– mice (n = 6). (C and D) Flow cytometric analysis of CD11b+F4/80+CD206+ TAMs in lung tissues (C) and comparison of fractions of F4/80+CD206+ TAMs between WT and Atp6v0d2–/– mice (D). (E and F) Ki-67 expression by tumor cells in the lung tissues isolated from WT and Atp6v0d2–/– mice. (GI) Flow cytometric analysis of tumor cell apoptosis in the lung tissues from WT and Atp6v0d2–/– mice (G), and quantification of apoptotic cells (H) and live cells (I). Data were assessed by Student’s t test and are presented as mean ± SEM (n = 5–6). *P < 0.05, **P < 0.01, ***P < 0.001.
Figure 4
Figure 4. Deletion of Atp6v0d2 leads to enhanced protumoral polarization of macrophages.
(AD) WT and Atp6v0d2–/– mice were injected s.c. with 5 × 10⁵ LLC cells. On day 15 after inoculation, mice were sacrificed. (A and B) Representative flow cytometric plots of tumor-infiltrating, gated F4/80+cells showing CD11C+CD206 (proinflammatory) and CD11CCD206+ (protumoral) TAM fractions in LLC tumor xenograft model (A) and comparisons of fractions of CD11C+CD206 and CD11CCD206+ in TAMs between WT and Atp6v0d2–/– mice (B) (n = 5). (C) The expression of Mrc1, Arg1, Fizz1, Il1b, and Il6 in WT and Atp6v0d2–/– (KO) tumor tissues was determined by qRT-PCR (n = 5). (D) TAMs from tumor-bearing WT and Atp6v0d2–/– mice were isolated with CD11b magnetic beads. The expression of Mrc1, Arg1, Fizz1, Il1b, and Il6 was determined by qRT-PCR (n = 5). (E and F) WT and Atp6v0d2–/– BMDMs were stimulated with medium or LLC TCM for 36 hours. The expression of Arg1 (E) and Fizz1 (F) was determined by qRT-PCR. (G and H) WT and Atp6v0d2–/– BMDMs were stimulated with medium or LLC TCM for 6 hours. The expression of Il1b (G) and Il6 (H) was determined by qRT-PCR. Data are representative of 2 (AD) or 3 (EH) independent experiments. Data were assessed by unpaired Student’s t test and are represented as mean ± SEM, *P < 0.05, **P < 0.01, ***P < 0.001. NS, not significant.
Figure 5
Figure 5. Atp6v0d2 deficiency results in enhanced tumor angiogenesis.
(AI) WT and Atp6v0d2–/– mice were injected s.c. with 5 × 10⁵ LLC cells. On day 15 after inoculation, mice were sacrificed (n = 5). (AC) Double immunostaining for CD31 (red) and α-SMA (green) vessels in tumor tissues from WT and Atp6v0d2–/– mice (A). Quantification of the percentage CD31+ vessels (B) and α-SMA+CD31+ vessels (C). (D and E) H&E staining on tumor tissues in WT and Atp6v0d2–/– mice. Histogram depicts the percentage of hemorrhagic area versus the whole tumor area (E). (F) Comparison of tumor tissue VEGF levels at day 15 in WT and Atp6v0d2–/– mice. (G and H) The expression of Vegf in tumor tissues (G) or isolated TAMs (H) from WT and Atp6v0d2–/– mice was determined by qRT-PCR. (I and J) Expression analysis of Vegf by qRT-PCR in WT and Atp6v0d2–/– BMDMs that were stimulated with LLC TCM (I) or B16-F10 TCM (J) for 6 hours. Data are representative of 3 independent experiments. Data were assessed by Student’s t test and are represented as mean ± SEM. *P < 0.05; **P < 0.01; ***P < 0.001. Scale bars: 100 μm.
Figure 6
Figure 6. Deletion of Atp6v0d2 results in enhanced stabilization of HIF-2α.
(A and B) Whole-mount immunofluorescence staining of DAPI (blue), F4/80 (red), and HIF-2α (green) in tumor tissues of WT and Atp6v0d2–/– mice (A). Scale bars: 100 μm (original magnification, ×200). Higher-magnification insets are ×400. The percentage of HIF-2α+F4/80+ among F4/80+ cells was quantified manually (B). (C) Immunoblotting of HIF-2α, HIF-1α, P62, ATP6V0d2, and LC3 in WT and Atp6v0d2–/– BMDMs that were stimulated with LLC TCM for the indicated times. (D) WT BMDMs were transduced with control virus or retroviral ATP6V0d2 virus, followed by treatment with LLC TCM for the indicated times. The expression of HIF-2α, P62, ATP6V0d2, and LC3 was determined by immunoblotting. (E) Immunoblotting of HIF-2α, HIF-1α, and ATP6V0d2 in WT and Atp6v0d2–/– BMDMs that were stimulated with hypoxia (1% O2) for the indicated times. (F) Immunoblotting of HIF-2α, P62, and LC3 in WT and Atp6v0d2-/- BMDMs that were incubated with MG132 (20 μM) for the indicated times. (G) WT and Atp6v0d2–/– BMDMs were untreated, or treated with bafilomycin A (100 nM) for 6 hours. The expression of HIF-2α, P62, ATP6V0d2, and LC3 was determined by immunoblotting. (H and I) WT and Atp6v0d2–/– BMDMs were untreated or treated with MG132 (20 μM) for 4 hours. Cells were stained with anti–HIF-2α and LysoTracker (H). Original magnification, ×630 and ×2,520 (insets). Colocalization of HIF-2α and lysosomes among cytoplasmic HIF-2α was quantified (I). Data were assessed by Student’s t test and are representative of 2 (A and B) or 3 (CI) independent experiments and are presented as mean ± SEM. *P < 0.05, ***P < 0.001.
Figure 7
Figure 7. Suppression of HIF-2α activity reverses the enhanced tumorigenesis in Atp6v0d2–/– mice.
(AJ) WT and Atp6v0d2–/– mice (n = 5) were injected s.c. with 5 × 10⁵ LLC cells. Once the tumor volumes reached 100–200 mm3 at around day 10, mice were gavaged with vehicle or HIF-2α inhibitor PT2385 (5 mg/kg) twice daily for 4 consecutive days. Growth curve (A) and tumor weight (B) were plotted. (C) Comparison of tumor tissue VEGF levels. (DF) Immunostaining of CD31 and α-SMA in tumor tissues (D) and quantification of CD31+ area percentage (E), CD31+α-SMA+ vessels as a percentage of CD31+ vessels (F) in the tumor areas. (GJ) qRT-PCR analysis of M2 marker genes Mrc1 (G), Arg1 (H), Fizz1 (I), Ym1 (J) in the tumor tissues. (KM) WT and Atp6v0d2–/– BMDMs were stimulated with LLC TCM for 24 hours with or without PT2385 (20 mM) and PT2385 was added 18 hours prior to the TCM stimulation. Expression of Arg1 (K), Fizz1 (L), and Ym1 (M) was determined by qRT-PCR. Data were assessed by 1-way ANOVA with Dunnett’s test and are presented as mean ± SEM. *P < 0.05; **P < 0.01; ***P < 0.001. Scale bars: 100 μm.
Figure 8
Figure 8. ATP6V0d2 is linked with survival for human lung adenocarcinoma patients.
(A) Immunofluorescence staining of human primary lung adenocarcinoma tissues with DAPI (blue), anti-CD68 (red), and anti–HIF-2α (green). Scale bars: 200 μm. (B) A representative image of H&E staining and immunohistochemical analysis of ATP6V0d2, CD163, and HIF-2α in the lung sections of adjacent nontumorous lungs or tumor tissues isolated from 2 lung adenocarcinoma patients. Scale bars: 50 μm. (C) Kaplan-Meier plot of overall survival of patients with lung cancer stratified by high IRS (>3) or low IRS (<3) of ATP6V0d2 expression levels. (D) The proportion of ATP6V0d2 expression in surviving and deceased patients was calculated and evaluated by the χ2 test with GraphPad Prism software. A P value less than 0.05 was considered statistically significant. (E) Quantification of numbers of CD163+ TAMs in 5 areas of each patients were determined by IPP image software in 2 groups of lung adenocarcinoma patients with high ATP6V0d2 expression (n = 20, IRS > 3) and low ATP6V0d2 expression (n = 11, IRS < 3). Data are the mean ± SEM. (F) Kaplan-Meier plot of overall survival of patients with lung cancer stratified by high IRS (>3) or low IRS (<3) of HIF-2α expression levels. ***P < 0.001 by Student’s t test.

References

    1. Murray PJ, et al. Macrophage activation and polarization: nomenclature and experimental guidelines. Immunity. 2014;41(1):14–20. doi: 10.1016/j.immuni.2014.06.008. - DOI - PMC - PubMed
    1. Epelman S, Lavine KJ, Randolph GJ. Origin and functions of tissue macrophages. Immunity. 2014;41(1):21–35. doi: 10.1016/j.immuni.2014.06.013. - DOI - PMC - PubMed
    1. Ruffell B, Coussens LM. Macrophages and therapeutic resistance in cancer. Cancer Cell. 2015;27(4):462–472. doi: 10.1016/j.ccell.2015.02.015. - DOI - PMC - PubMed
    1. Quail DF, Joyce JA. Microenvironmental regulation of tumor progression and metastasis. Nat Med. 2013;19(11):1423–1437. doi: 10.1038/nm.3394. - DOI - PMC - PubMed
    1. Qian BZ, Pollard JW. Macrophage diversity enhances tumor progression and metastasis. Cell. 2010;141(1):39–51. doi: 10.1016/j.cell.2010.03.014. - DOI - PMC - PubMed

Publication types

MeSH terms

Substances

LinkOut - more resources