. 2018 Nov 15;16(11):e2006450.
doi: 10.1371/journal.pbio.2006450. eCollection 2018 Nov.

Heterologous Hsp90 promotes phenotypic diversity through network evolution

Affiliations

Heterologous Hsp90 promotes phenotypic diversity through network evolution

Tracy Chih-Ting Koubkova-Yu et al. PLoS Biol. .

Abstract

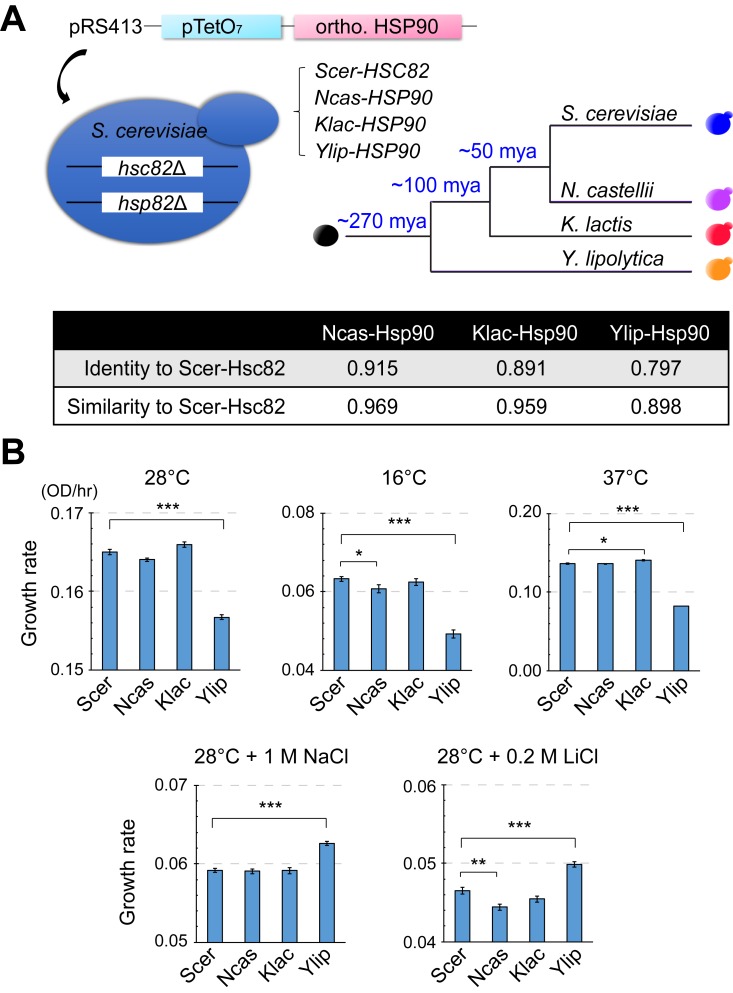
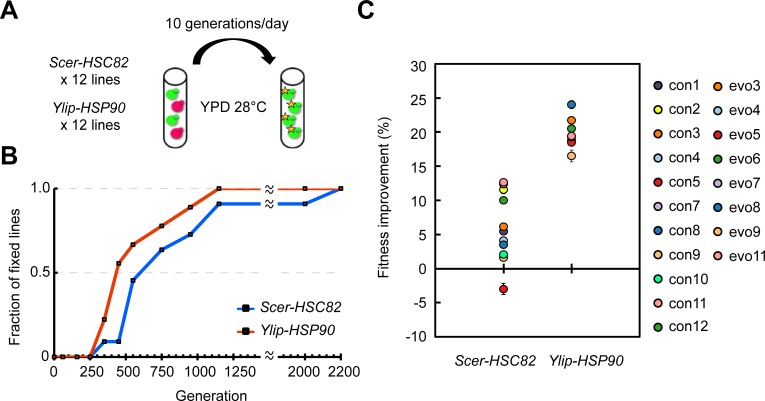
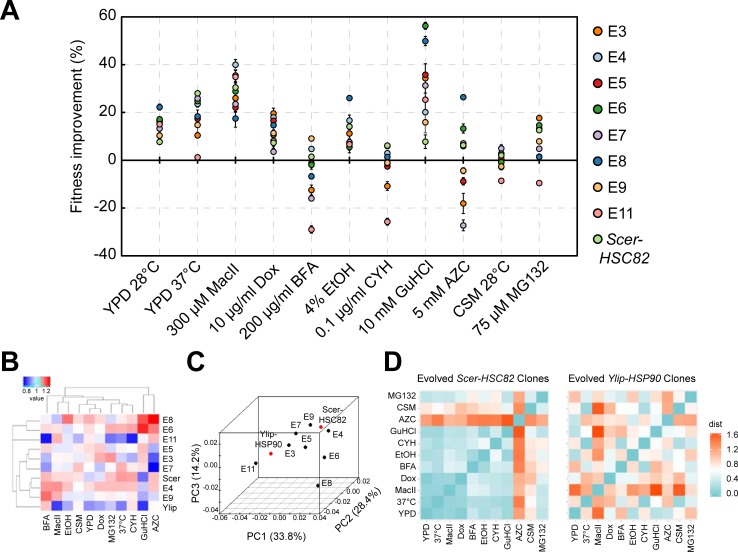
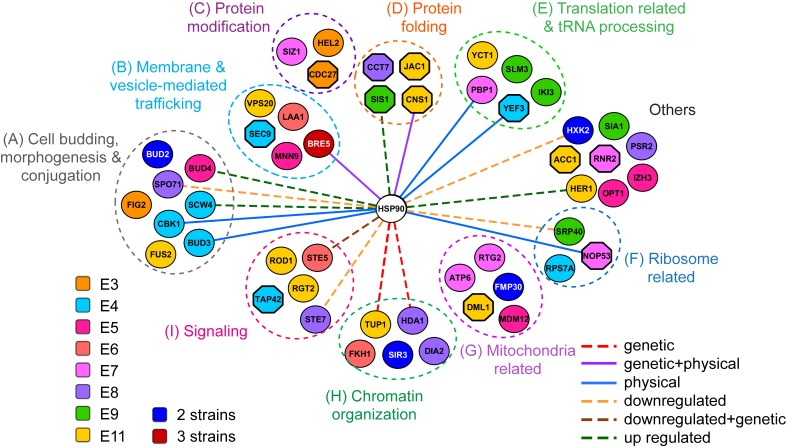
Biological processes in living cells are often carried out by gene networks in which signals and reactions are integrated through network hubs. Despite their functional importance, it remains unclear to what extent network hubs are evolvable and how alterations impact long-term evolution. We investigated these issues using heat shock protein 90 (Hsp90), a central hub of proteostasis networks. When native Hsp90 in Saccharomyces cerevisiae cells was replaced by the ortholog from hypersaline-tolerant Yarrowia lipolytica that diverged from S. cerevisiae about 270 million years ago, the cells exhibited improved growth in hypersaline environments but compromised growth in others, indicating functional divergence in Hsp90 between the two yeasts. Laboratory evolution shows that evolved Y. lipolytica-HSP90-carrying S. cerevisiae cells exhibit a wider range of phenotypic variation than cells carrying native Hsp90. Identified beneficial mutations are involved in multiple pathways and are often pleiotropic. Our results show that cells adapt to a heterologous Hsp90 by modifying different subnetworks, facilitating the evolution of phenotypic diversity inaccessible to wild-type cells.


Conflict of interest statement

The authors have declared that no competing interests exist.

Figures

Fig 1
Fig 1. Orthologous gene replacements reveal functional divergence of Hsp90 among different yeast species.
(A) Construction scheme of the HSP90 ortholog replacement strains and phylogenetic information on the ortholog-providing species. Both copies of Hsp90-coding genes in Saccharomyces cerevisiae were deleted and the Hsp90 function is performed by the orthologs from other species. The bottom table shows pairwise amino acid sequence identity and similarity between Scer-Hsc82 and its orthologs (BLOSUM62, EMBOSS Water local alignment). (B) Ylip-HSP90 replacement strains show reduced fitness in YPD media at normal, low, or high temperature but increased fitness in the YPD media containing NaCl or LiCl at 28°C. Cells were grown in liquid cultures and growth rates were measured by Infinite 200 plate readers. p-values were calculated by two-tailed Student t test with the Benjamini-Hochberg correction. *p < 0.05, **p < 0.01, ***p < 0.001. Error bar represents the standard error, N ≥ 4. The numerical data used in panel (B) are included in S1 Data. See also S1 Fig. BLOSUM62, BLOcks SUbstitution Matrix 62; EMBOSS, European Molecular Biology Open Software Suite; Klac, Kluyveromyces lactis; mya, million years ago; Ncas, Naumovozyma castellii; OD, optical density; ortho., ortholog; pRS413, yeast single-copy plasmid; pTetO7, tetracycline operator 7 repeats promoter; Scer, Saccharomyces cerevisiae; Ylip, Yarrowia lipolytica; YPD, Yeast extract-Peptone-Dextrose.
Fig 2
Fig 2. Evolving Ylip-HSP90 lines fix the first beneficial mutations more quickly and have better fitness improvements.
(A) Experimental evolution for adaptation to a heterologous Hsp90. Twelve Ylip-HSP90 evolving lines and 12 Scer-HSC82 control lines were set up to evolve in rich media at 28°C. Two isogenic subpopulations (red: DsRed-labeled subpopulation; green: GFP-labeled subpopulation) were mixed in an approximate ratio of 1:1 in the initial cultures. The subpopulation that obtained a beneficial mutation (noted by a star) would start expanding its frequency in the evolved culture. (B) The Ylip-HSP90 lines become fixed more quickly than the Scer-HSC82 lines. The mutation fixation of each culture was determined as the time when the frequency of a subpopulation was observed to be greater than 95% according to flow cytometry. The control line con6 and the evolving lines, evo1, evo2, and evo12 were excluded because of culture contamination during evolution. The frequency dynamics of each evolved line are shown in S3 Fig. (C) Evolved Ylip-HSP90 populations have enhanced fitness improvements compared with evolved Scer-HSC82 populations in YPD at 28°C (p-value = 4.54 × 10⁻⁷, t = −7.97, df = 15, one-tailed Student t test, unequal variance; data did not deviate from the normal distribution, Shapiro-Wilk test). Cells were grown in liquid cultures and growth rates were measured by plate readers. Fitness improvement was calculated according to the formula [(fitness of the evolved culture/fitness of the ancestral strain) − 1] × 100%. Error bars are standard errors, N ≥ 4. The numerical data used in panels (B, C) are included in S1 Data. DsRed, red fluorescent protein; GFP, green fluorescent protein; Scer, Saccharomyces cerevisiae; Ylip, Yarrowia lipolytica; YPD, Yeast extract-Peptone-Dextrose.
Fig 3
Fig 3. Phenotypic adaptation and innovation of the evolved Ylip-HSP90 clones.
(A) Evolved Ylip-HSP90 clones remain highly tolerant to LiCl. Serially diluted cell cultures were spotted onto the plates and incubated at 28°C until colonies became visible. G and R indicate the ancestral strains carrying the green and red fluorescent proteins, respectively. (B) The fitness improvements of evolved clones are specific to Ylip-Hsp90. The fitness improvements were significantly diminished when the Ylip-HSP90 gene in the evolved clones was replaced with Scer-HSC82 (p-value = 6.82 × 10⁻⁷, t = 15.07, and df = 7, one-tailed paired Student t test; data did not deviate from the normal distribution, Shapiro-Wilk test). Cells were grown in liquid cultures and growth rates were measured by plate readers. Fitness improvement was calculated by comparing the fitness in YPD at 28°C between evolved and ancestral clones carrying the same plasmid. Error bars are standard errors, N ≥ 4. (C) Evolved Ylip-HSP90 clones show different levels of protein homeostasis restoration. Cells carrying Hsp104-BFP were grown at 25°C and then shifted to 37°C to induce heat adaptation. The fraction of cells containing Hsp104-BFP foci was counted at 0, 1, and 3 hours after the temperature shift. At least seven replicates were measured for each strain, and more than 75 cells were counted for each replicate. Asterisks indicate that the fraction of cells containing Hsp104-BFP foci is significantly lower compared with ancestral Ylip-HSP90 cells from the same time point (p-value < 0.01 after the Benjamini-Hochberg correction, N ≥ 7, one-tailed Wilcoxon rank-sum test). (D) Evolved Ylip-HSP90 clones E3, E4, and E9 recover from elongated cell morphology, whereas E5 and E11 become even more elongated than the ancestor. The ratio of the long- versus short-axis diameter of each cell was measured, and more than 80 cells were examined for each strain. The distribution of each sample was compared to ancestral Ylip-HSP90 cells and asterisks indicate a p-value <0.01 after the Benjamini-Hochberg correction by two-tailed Wilcoxon rank-sum test. The numerical data used in panels (B, C, D) are included in S1 Data. See also S5 Fig. BFP, blue fluorescent protein; Scer, Saccharomyces cerevisiae; Ylip, Yarrowia lipolytica; YPD, Yeast extract-Peptone-Dextrose.
Fig 4
Fig 4. Evolved Ylip-HSP90 clones exhibit diverged adaptive phenotypes in different conditions.
(A) Fitness improvements of the evolved Ylip-HSP90 clones under 11 different growth conditions, many of which challenge different aspects of protein homeostasis. Cells were grown in liquid cultures and growth rates were measured by plate readers. Error bars are standard errors, N ≥ 3. Unless specified otherwise, cells were grown at 28°C. Fitness improvement was calculated by comparing the fitness of the evolved (or Scer-HSC82) clone with that of the ancestral Ylip-HSP90 strain. (B) Hierarchical clustering of the fitness values (i.e., growth rates) reveals divergent evolution of the Ylip-HSP90 clones. For many of the conditions, some evolved Ylip-HSP90 clones display enhanced fitness compared with Scer-HSC82 clones. Individual fitness values were divided by the mean of all fitness values in the same condition to normalize the fitness data to a similar scale between conditions. The color code represents the normalized fitness value (red: high fitness; blue: low fitness). (C) PCA of the fitness values shows that all Ylip-HSP90 clones evolved diverged phenotypes, scattered across the three principal component dimensions. Explanatory power is shown in brackets next to each principal component. (D) The evolved phenotypes of Ylip-HSP90 clones are more diverse than those of Scer-HSC82 clones. Pearson correlation distance (d = 1 − Pearson correlation coefficient) was used to measure whether the evolved clones displayed similar fitness trends under different conditions. A smaller distance indicates a higher similarity between the two conditions. In general, phenotypic distances for evolved Ylip-HSP90 clones were significantly greater than those of evolved Scer-HSC82 clones (p = 0.001, one-tailed Wilcoxon rank-sum test), suggesting that evolved Ylip-HSP90 clones have more divergent phenotypes. The color code represents the Pearson correlation distance value (cyan: high similarity; red: low similarity). The numerical data used in the figure are included in S1 Data. See also S6 Fig. AZC, azetidine-2-carboxylate; BFA, brefeldin A; CSM, complete supplement mixture; CYH, cycloheximide; Dox, doxycycline; EtOH, ethanol; GuHCl, guanidine hydrochloride; MacII, macbecin II; PC, principal component; PCA, principal component analysis; Scer, Saccharomyces cerevisiae; Ylip, Yarrowia lipolytica; YPD, Yeast extract-Peptone-Dextrose.
Fig 5
Fig 5. Evolved Ylip-HSP90 clones contain mutations in the genes involved in Hsp90-related functions.
Most mutant genes identified in evolved Ylip-HSP90 clones can be grouped into several Hsp90-related functions, and about one third of them (32%) are Hsp90 interactors or Hsp90-dependent proteins (connected to Hsp90 by lines). Essential genes in Saccharomyces cerevisiae are displayed as octagonal nodes. The evolved clones containing the recurrent mutant genes are listed as follows: BRE5 in E3, E5, and E11; BUD2 and FMP30 in E3 and E9; HXK2 in E3 and E6; and SIR3 in E8 and E11. Ylip, Yarrowia lipolytica.
Fig 6
Fig 6. Allele replacement confirms the contribution of the mapped mutations in evolved phenotypes.
(A) Fitness improvements of the reconstituted clones under 11 growth conditions. Nine mapped strong-effect mutations and cbk1-L461F were reintroduced into the ancestral Ylip-HSP90 strain using the CRISPR/Cas9 system, and the fitness of reconstituted clones was then compared with that of the ancestral Ylip-HSP90 strain. Cells were grown in liquid cultures and growth rates were measured by plate readers. Individual mutations exerted dominant effects in at least one condition, and antagonistic pleiotropy under different stress conditions was widely observed. Error bars are standard errors, N ≥ 3. Asterisks indicate that the fitness values are significantly different from the ancestral Ylip-HSP90 strain (p < 0.05 after the Benjamini-Hochberg correction, two-tailed Wilcoxon rank-sum test). See also S8 Fig. (B) Positive genetic interactions between cbk1-L461F and the other two mutations result in the fitness improvement not observed in single mutants when grown in media containing BFA or MG132. Error bars are standard errors, N ≥ 4. Asterisks indicate that the fitness of double mutants is significantly greater than that of single mutants (p < 0.05 after the Benjamini-Hochberg correction, two-tailed Wilcoxon rank-sum test). (C) All three single mutations in the E7 clone reduce the formation of Hsp104 foci at 37°C, but pbp1-N318fs has the strongest effect. Each measurement was compared with that of ancestral Ylip-HSP90 cells from the same time point, and asterisks indicate a p-value <0.01 after the Benjamini-Hochberg correction, according to one-tailed Wilcoxon rank-sum test. N ≥ 14. Error bars are standard errors. The numerical data used in the figure are included in S1 Data. AZC, azetidine-2-carboxylate; BFA, brefeldin A; CRISPR/Cas9, clustered regularly interspaced short palindromic repeats/CRISPR-associated protein 9; CSM, complete supplement mixture; CYH, cycloheximide; Dox, doxycycline; EtOH, ethanol; GuHCl, guanidine hydrochloride; L461F, leucine 461 to phenylalanine; MacII, macbecin II; N318fs, asparagine 318 frameshift; Ylip, Yarrowia lipolytica; YPD, Yeast extract-Peptone-Dextrose.
Fig 7
Fig 7. A model showing how a changed network hub allows the cell to reshape the network structures in different directions to broaden its evolutionary potential.
When a network hub is altered, cells regain fitness by modifying different parts of subnetwork structures. Such events allow cells to pursue different evolutionary paths that are inaccessible to wild-type cells. Evo, evolved line; WT, wild type.

Comment in

  • Network hubs affect evolvability.
    Helsen J, Frickel J, Jelier R, Verstrepen KJ. Helsen J, et al. PLoS Biol. 2019 Jan 30;17(1):e3000111. doi: 10.1371/journal.pbio.3000111. eCollection 2019 Jan. PLoS Biol. 2019. PMID: 30699103 Free PMC article.

References

    1. Hartwell LH, Hopfield JJ, Leibler S, Murray AW. From molecular to modular cell biology. Nature. 1999;402(6761 Suppl):C47–52. 10.1038/35011540 . - DOI - PubMed
    1. Barabasi AL, Oltvai ZN. Network biology: understanding the cell's functional organization. Nat Rev Genet. 2004;5(2):101–13. Epub 2004/01/22. 10.1038/nrg1272 [pii]. . - DOI - PubMed
    1. Eisenberg D, Marcotte EM, Xenarios I, Yeates TO. Protein function in the post-genomic era. Nature. 2000;405(6788):823–6. 10.1038/35015694 . - DOI - PubMed
    1. Proulx SR, Promislow DE, Phillips PC. Network thinking in ecology and evolution. Trends Ecol Evol. 2005;20(6):345–53. 10.1016/j.tree.2005.04.004 . - DOI - PubMed
    1. Jeong H, Mason SP, Barabasi AL, Oltvai ZN. Lethality and centrality in protein networks. Nature. 2001;411(6833):41–2. Epub 2001/05/03. 10.1038/35075138 [pii]. . - DOI - PubMed

Publication types

MeSH terms

Substances