. 2018 Nov 15;19(1):821.
doi: 10.1186/s12864-018-5200-1.

Mollusc genomes reveal variability in patterns of LTR-retrotransposons dynamics

Affiliations

Mollusc genomes reveal variability in patterns of LTR-retrotransposons dynamics

Camille Thomas-Bulle et al. BMC Genomics. .

Abstract

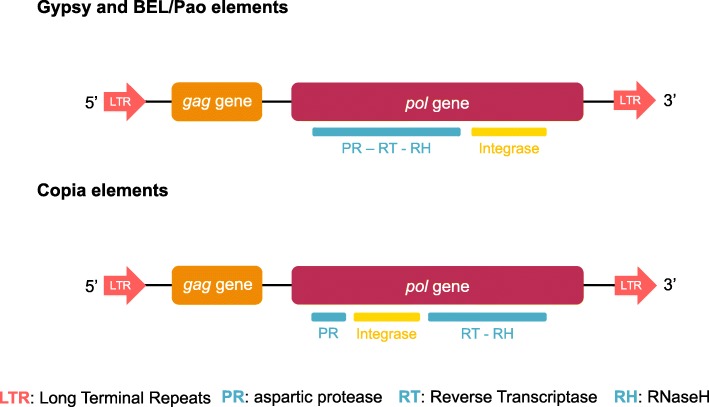
Background: The three superfamilies of Long Terminal Repeat (LTR) retrotransposons are a widespread kind of transposable element and a major factor in eukaryotic genome evolution. In metazoans, recent studies suggested that Copia LTR-retrotransposons display specific dynamic compared to the more abundant and diverse Gypsy elements. Indeed, Copia elements show a relative scarcity and the prevalence of only a few clades in specific hosts. Thus, BEL/Pao seems to be the second most abundant superfamily. However, the generality of these assumptions remains to be assessed. Therefore, we carried out the first large-scale comparative genomic analysis of LTR-retrotransposons in molluscs. The aim of this study was to analyse the diversity, copy numbers, genomic proportions and distribution of LTR-retrotransposons in a large host phylum.

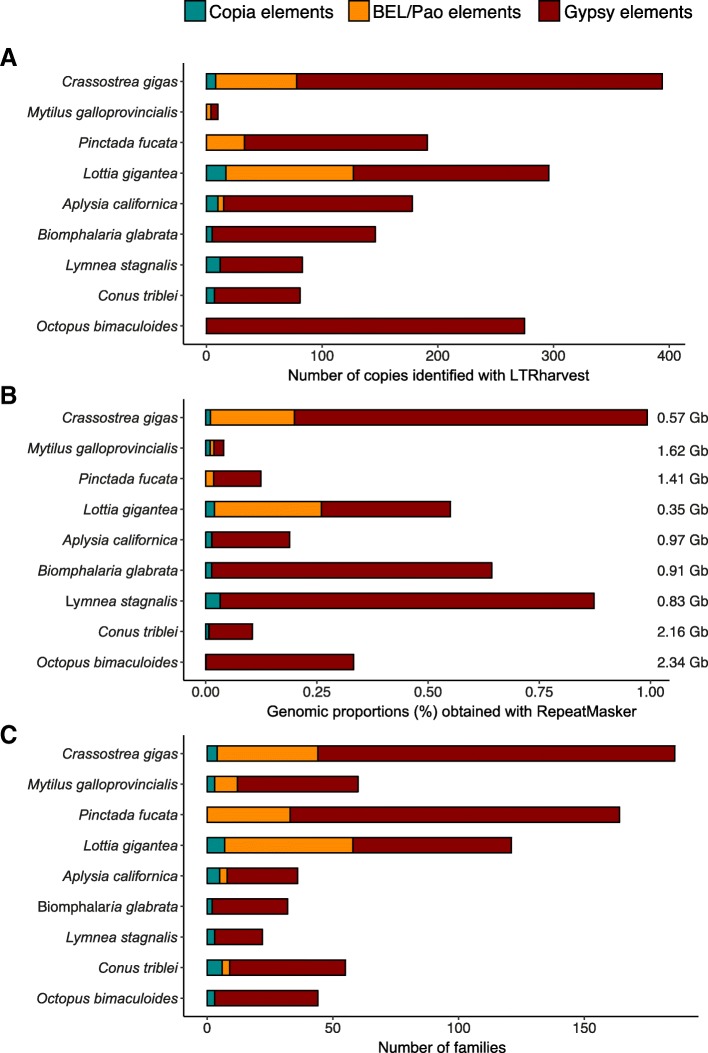
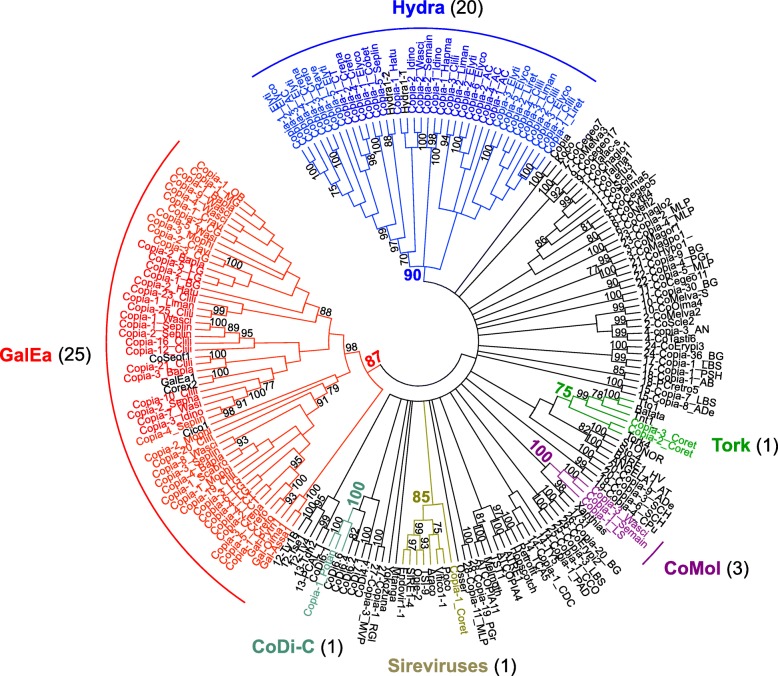
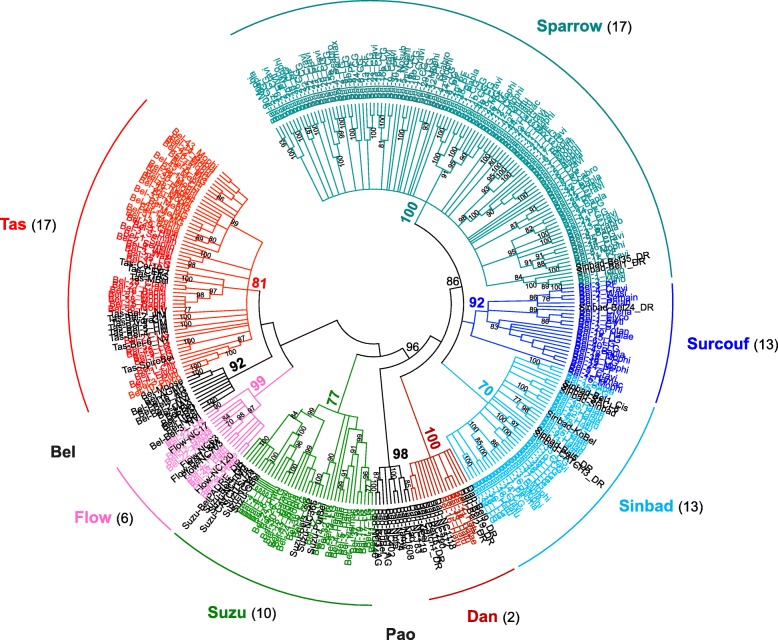
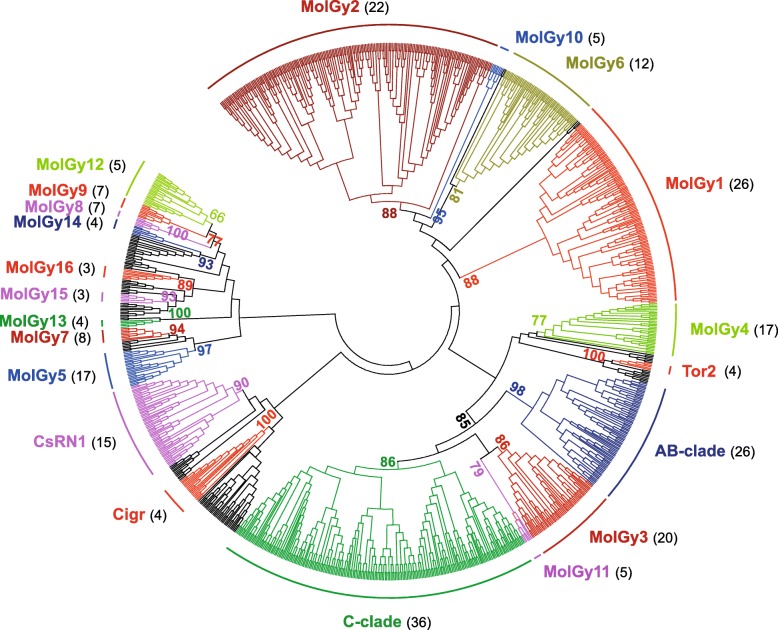
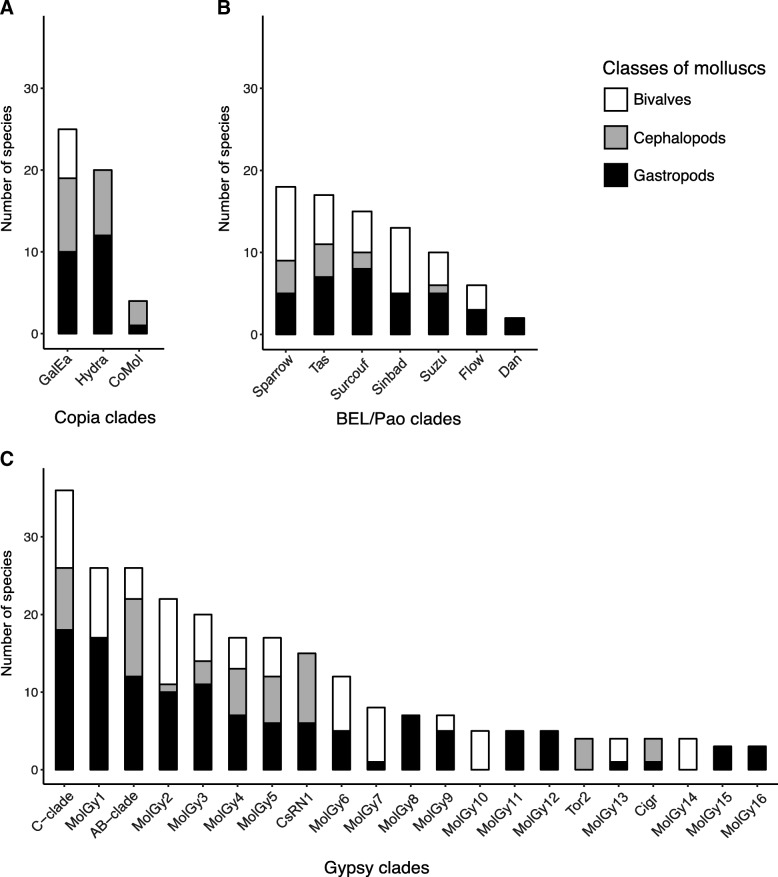
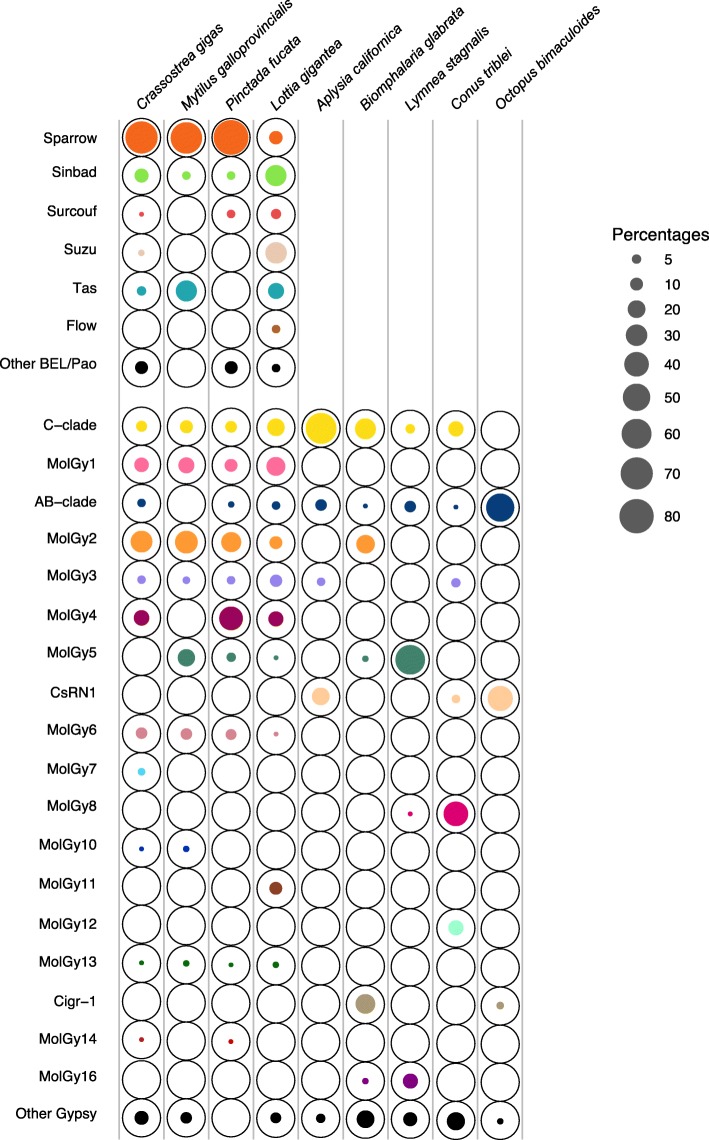
Results: We compare nine genomes of molluscs and further added LTR-retrotransposons sequences detected in databases for 47 additional species. We identified 1709 families, which enabled us to define 31 clades. We show that clade richness was highly dependent on the considered superfamily. We found only three Copia clades, including GalEa and Hydra which appear to be widely distributed and highly dominant as they account for 96% of the characterised Copia elements. Among the seven BEL/Pao clades identified, Sparrow and Surcouf are characterised for the first time. We find no BEL or Pao elements, but the rare clades Dan and Flow are present in molluscs. Finally, we characterised 21 Gypsy clades, only five of which had been previously described, the C-clade being the most abundant one. Even if they are found in the same number of host species, Copia elements are clearly less abundant than BEL/Pao elements in copy number or genomic proportions, while Gypsy elements are always the most abundant ones whatever the parameter considered.

Conclusions: Our analysis confirms the contrasting dynamics of Copia and Gypsy elements in metazoans and indicates that BEL/Pao represents the second most abundant superfamily, probably reflecting an intermediate dynamic. Altogether, the data obtained in several taxa highly suggest that these patterns can be generalised for most metazoans. Finally, we highlight the importance of using database information in complement of genome analyses when analyzing transposable element diversity.

Keywords: BEL/Pao; Comparative genomic; Copia; Gypsy; LTR- retrotransposons; Molluscs.


Conflict of interest statement

Ethics approval and consent to participate

Not applicable.

Consent for publication

Not applicable.

Competing interests

The authors declare that they have no competing interests.

Publisher’s Note

Springer Nature remains neutral with regard to jurisdictional claims in published maps and institutional affiliations.

Figures

Fig. 1
Fig. 1
Schematic structure of LTR-retrotransposons elements. The long terminal direct repeats, flanking the elements, are represented by oriented red arrows and the two classical open reading frames by the two large rectangles. In the pol gene, the relative position of the domains that encode all the proteins required for transposition are detailed, in particular the integrase position
Fig. 2
Fig. 2
Relative LTR-retrotransposon’s content of each host genome. The horizontal axis indicates the abundance of Copia (turquoise), BEL/Pao (orange) and Gypsy (maroon) superfamilies in each genome estimated from a) the number of copies obtained with LTRharvest; b) the genomic proportion (%) obtained with RepeatMasker and c) the number of distinct families/elements
Fig. 3
Fig. 3
Phylogenetic relationships of Copia retrotransposons. The tree is based on Neighbor-Joining analysis of RT/RNaseH domain amino acid sequences. The Copia families from molluscs are indicated in color and arc of different colors indicate major clades. The number of mollusc species covered by each clade in the phylogeny is given into brackets. Node statistical support values (> 70%) come from non-parametric bootstrapping using 100 replicates
Fig. 4
Fig. 4
Phylogenetic relationships of BEL/Pao retrotransposons. The tree is based on Neighbor-Joining analysis of RT/RNaseH domain amino acid sequences. The BEL/Pao families from mollusc are indicated in color and arc of different colors indicate major clades. The number of mollusc species covered by each clade in the phylogeny is given into brackets. Node statistical support values (> 70%) come from non-parametric bootstrapping using 100 replicates
Fig. 5
Fig. 5
Phylogenetic relationships of Gypsy retrotransposons. The tree is based on Neighbor-Joining analysis of RT/RNaseH domain amino acid sequences. The Gypsy families from mollusc are indicated in color and arc of different colors indicate major clades. The number of mollusc species covered by each clade in the phylogeny is given into brackets. Node statistical support values (> 70%) come from non-parametric bootstrapping using 100 replicates
Fig. 6
Fig. 6
Distribution of LTR-retrotransposon clades among molluscs. The number of species in which each clade occurs is given for the 3 studied classes of molluscs. a) Copia clades, b) BEL/Pao clades, c) Gypsy clades
Fig. 7
Fig. 7
Relative proportion of BEL/Pao and Gypsy clades in the genomes of the nine mollusc species. For each genome (column), the bubble chart shows the relative distribution of the clades considering the length (in base pairs) of all sequences obtained with RepeatMasker. Each black circle indicates 100% for a given superfamily and the surface covered by the colored solid circle indicates the relative of proportion the given clade for a given superfamily in each genome. “Other BEL/Pao” and “other Gypsy” rows refer to LTR-retrotransposon sequences that could not be included in any major clade

Similar articles

Cited by

References

    1. Kidwell MG, Lisch DR. Perspective: transposable elements, parasitic DNA, and genome evolution. Evolution. 2001;55:1–24. doi: 10.1111/j.0014-3820.2001.tb01268.x. - DOI - PubMed
    1. Piednoël M, Gonçalves IR, Higuet D, Bonnivard E. Eukaryote DIRS1-like retrotransposons: an overview. BMC Genomics. 2011;12:1. doi: 10.1186/1471-2164-12-621. - DOI - PMC - PubMed
    1. Ivancevic AM, Kortschak RD, Bertozzi T, Adelson DL. LINEs between species: evolutionary dynamics of LINE-1 retrotransposons across the eukaryotic tree of life. Genome Biol Evol. 2016;8:3301–3322. doi: 10.1093/gbe/evw243. - DOI - PMC - PubMed
    1. Wicker T, Sabot F, Hua-Van A, Bennetzen JL, Capy P, Chalhoub B, et al. A unified classification system for eukaryotic transposable elements. Nat Rev Genet. 2007;8:973–982. doi: 10.1038/nrg2165. - DOI - PubMed
    1. Xiong Y, Eickbush TH. Origin and evolution of retroelements based upon their reverse transcriptase sequences. EMBO J. 1990;9:3353–3362. doi: 10.1002/j.1460-2075.1990.tb07536.x. - DOI - PMC - PubMed

LinkOut - more resources