. 2018 Nov 15;25(1):81.
doi: 10.1186/s12929-018-0478-5.

Metformin causes cancer cell death through downregulation of p53-dependent differentiated embryo chondrocyte 1

Affiliations

Metformin causes cancer cell death through downregulation of p53-dependent differentiated embryo chondrocyte 1

Shu-Man Hsieh Li et al. J Biomed Sci. .

Abstract

Background: Metformin is the most commonly used first-line medicine for type II diabetes mellitus. Acting via AMP-activated protein kinase, it has been used for more than 60 years and has an outstanding safety record. Metformin also offers protection against cancer, but its precise mechanisms remain unclear.

Methods: We first examined the cytotoxic effects of metformin in the HeLa human cervical carcinoma and ZR-75-1 breast cancer cell lines using assays of cell viability, cleaved poly-ADP-ribose polymerase, and Annexin V-fluorescein isothiocyanate apoptosis, as well as flow cytometric analyses of the cell cycle profile and reactive oxygen species (ROS). We later clarified the effect of metformin on p53 protein stability using transient transfection and cycloheximide chase analyses.

Results: We observed that metformin represses cell cycle progression, thereby inducing subG1 populations, and had induced apoptosis through downregulation of p53 protein and a target gene, differentiated embryo chondrocyte 1 (DEC1). In addition, metformin increased intracellular ROS levels, but N-acetyl cysteine, a ROS scavenger, failed to suppress metformin-induced apoptosis. Further results showed that metformin disrupted the electron transport chain and collapsed the mitochondrial membrane potential, which may be the cause of the elevated ROS levels. Examination of the mechanisms underlying metformin-induced HeLa cell death revealed that reduced stability of p53 in metformin-treated cells leads to decreases in DEC1 and induction of apoptosis.

Conclusion: The involvement of DEC1 provides new insight into the positive or negative functional roles of p53 in the metformin-induced cytotoxicity in tumor cells.

Keywords: Apoptosis; DEC1; Metformin; Reactive oxygen species; p53.


Conflict of interest statement

Ethics approval and consent to participate

“Not applicable” (The present paper did not involve the use of any animal or human data).

Consent for publication

“Not applicable”.

Competing interests

The authors declare that they have no competing interests.

Publisher’s Note

Springer Nature remains neutral with regard to jurisdictional claims in published maps and institutional affiliations.

Figures
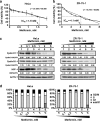
Fig. 1
Fig. 1
Cytotoxicity of metformin in HeLa and ZR-75-1 cells. a and b HeLa cells (a) and ZR-75-1 (b) cells were treated with the indicated concentration of metformin for 35 h and 70 h, respectively. Cell viability was measured using the MTT method. c HeLa and ZR-75-1 cells were incubated with indicated concentration of metformin for 20 h and 25 h, respectively. Cell lysates were subjected to western blot analysis using antibodies against cyclin D1, cyclin B1 and H3P. ACTN was the protein loading control. The protein levels of cyclin D1, cyclin B1 and H3P after normalization with the loading control protein ACTN are presented as fold change. d HeLa and ZR-75-1 cells were incubated with the indicated concentration of metformin for 30 h and 57 h, respectively. The cells were then subjected to flow cytometric cell cycle profile analysis. The results are representative of three independent experiments
Fig. 2
Fig. 2
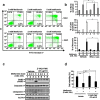
Metformin-induced apoptosis in HeLa cells. a HeLa cells (8 × 104 cells) were incubated with the indicated concentration of metformin for 40 h, after which cell death, apoptosis or necrosis were quantified using FITC-Annexin V and PI and flow cytometry. b Quantitative analysis of percentage of indicated stages is presented as the mean ± S.D. of at least three independent experiments; # p > 0.05 and * p < 0.05 (Student’s t-test). c HeLa cells were incubated with the indicated concentration of metformin and 20 μg/ml Z-VAD-FMK for 24 h. Cell lysates were then subjected to western blotting with antibodies against PARP and caspase 3. ACTN was the loading control. The protein levels of cleaved Caspase 3 (cCaspase 3) after normalization with the loading control protein ACTN are presented as fold change. d HeLa cells (5 × 104 cells) were treated with vehicle (DMSO), 5 mM metformin, 20 μg/ml Z-VAD-FMK, or 5 mM metformin plus 20 μg/ml Z-VAD-FMK for 24 h. Quantitative analysis of cell viability is presented as the mean ± S.D. of at least three independent experiments; # p > 0.05, * p < 0.05, and ** p < 0.01 (Student’s t-test)
Fig. 3
Fig. 3
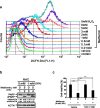
Induction of ROS generation by metformin in HeLa cells. a HeLa cells were incubated for 20 h with various concentrations of metformin, after which the live cells was stained with 10 μM DCFH-DA for 40 min at 37 °C and assayed using a flow cytometer. b HeLa cells were incubated for 20 h with 5 mM metformin and/or 1 mM NAC. The cell lysates were then subjected to western blotting with an antibody against PARP. ACTN was the loading control. The protein levels of PARP and cleaved PARP (cPARP) after normalization with the loading control protein ACTN are presented as fold change. c HeLa cells (5 × 104 cells) were incubated for 20 h with vehicle (DMSO), 5 mM metformin, 1 mM NAC, or 5 mM metformin plus 1 mM NAC. Quantitative analysis of cell viability is presented as the mean ± S.D. of at least three independent experiments; # p > 0.05, * p < 0.05, and ** p < 0.01 (Student’s t-test)
Fig. 4
Fig. 4
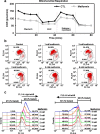
Effect of metformin on mitochondrial function in HeLa cells. a HeLa cells were incubated for 20 h with 5 mM metformin, after which the cellular OCR was measured in XF24 bioenergetic assays. b HeLa cells were incubated for 16 h with the indicated concentrations of metformin, after which JC-1 staining was analyzed using flow cytometry. c Changes in FL1-H and FL2-H were further evaluated using a FACS Calibur flow cytometer. The results are representative of two independent experiments
Fig. 5
Fig. 5
Function of DEC1 in metformin-induced apoptosis in HeLa cells. a HeLa cells were incubated for 20 h with the indicated concentrations of metformin, after which the cell lysates were subjected to western blotting with an antibody against DEC1. ACTN was the loading control. The protein levels of DEC1 after normalization with the loading control protein ACTN are presented as fold change. b HeLa cells were incubated with 5 mM metformin with and without 10 μM MG132 for the indicated times. They were then lysed; divided into cytoplasmic, membrane, and nuclear fractions; and subjected to western blotting with antibodies against DEC1, HSP90α/β (cytoplasmic fraction), EGFR (membrane fraction) and PARP (intact: nuclear fraction; cleaved: nuclear and cytoplasmic fractions). The protein levels of cleaved DEC1, PARP, and cPARP are presented as fold change. c HeLa cells were transiently transfected with 2 μg pEGFP.DEC1 for 5 h and then were observed with fluorescence-microscopy. d HeLa cells were transiently transfected with 2 μg of pEGFP vector and pEGFP.DEC1 and incubated for 13 h with 5 mM metformin. The cell lysates were subjected to western blotting with antibodies against DEC1 and PARP. ACTN was the loading control. The protein levels of PARP and cleaved PARP (cPARP) after normalization with the loading control protein ACTN are presented as fold change. The results are representative of three independent experiments
Fig. 6
Fig. 6
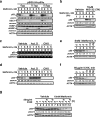
Transcriptional and translational regulation of p53 in HeLa cells. a HeLa cells were transiently transfected with 0.5 μg of pSG5.HA vector or the indicated amount of pSG5.HA.p53 and incubated for 12 h with 5 mM metformin. The cell lysates were subjected to western blotting with antibodies against p53, DEC1, and PARP. ACTN was the loading control. The protein levels of p53, DEC1, and cPARP after normalization with the loading control protein ACTN are presented as fold change. b HeLa cells were incubated for 5 h with the indicated concentrations of metformin with or without 10 μM MG132, after which the cell lysates were subjected to western blotting with an antibody against p53. ACTN was the loading control. The protein levels of p53 after normalization with the loading control protein ACTN are presented as fold change. c and d HeLa cells were incubated for 12 h with the indicated concentrations of metformin with and without 0.1 μM actinomycin D (Act D) or 50 μg/ml cycloheximide (CHX). Levels of p53 mRNA and protein were then assayed in the cell lysates using RT-PCR (c) and western blotting (d), respectively. GAPDH mRNA was the mRNA loading control; ACTN was the protein loading control. e and f HeLa cells were incubated with 5 mM metformin (e) or 50 μg/ml CHX (f) for the indicated times, after which cell lysates were subjected to western blotting with an antibody against p53. g HeLa cells were incubated for the indicated times with 10 mM metformin with and without 50 ng/ml CHX. The cell lysates were then subjected to western blotting with an antibody against p53. d-g The protein levels of p53 after normalization with the loading control protein ACTN are presented as fold change. The results are representative of three independent experiments
Fig. 7
Fig. 7
Verification of p53 and DEC1 into the metformin-induced apoptosis in HeLa cells. a HeLa cells were incubated for 24 h with the indicated concentrations of metformin, 1 mM NAC, and 10 μM pifithrin-α. The cell lysates were then subjected to western blotting with antibodies against PARP and caspase 3. ACTN was the loading control. b Following DEC1 knockdown in HeLa cells, the cells were incubated for 24 h with the indicated concentration of metformin. The cell lysates were then subjected to western blotting with antibodies against PARP and Caspase 3. ACTN was the loading control and DEC1 was the silencing efficiency of shDEC1. The protein levels of cPARP and cCaspase 3 after normalization with the loading control protein ACTN are presented as fold change. The results are representative of three independent experiments
Fig. 8
Fig. 8
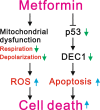
Proposed working mechanisms of metformin in cancer cells. Metformin may directly decrease p53 in sensitive cells, which would in turn downregulate expression of its target gene, DEC1, leading to apoptosis. Metformin not only induces cellular apoptosis but also induces ROS generation through repression of mitochondrial respiration and membrane potential to kill cancer cells. Thus, apoptosis, mitochondrial dysfunction, and ROS generation all contribute to the induction of HeLa cell death by metformin

Similar articles

Cited by

References

    1. American Diabetes Association Standards of medical care in diabetes--2014. Diabetes Care. 2014;37(Suppl 1):S14–S80. doi: 10.2337/dc14-S014. - DOI - PubMed
    1. Foretz M, Guigas B, Bertrand L, Pollak M, Viollet B. Metformin: from mechanisms of action to therapies. Cell Metab. 2014;20:953–966. doi: 10.1016/j.cmet.2014.09.018. - DOI - PubMed
    1. Gong L, Goswami S, Giacomini KM, Altman RB, Klein TE. Metformin pathways: pharmacokinetics and pharmacodynamics. Pharmacogenet Genomics. 2012;22:820–827. doi: 10.1097/FPC.0b013e3283559b22. - DOI - PMC - PubMed
    1. Viollet B, Guigas B, Sanz Garcia N, Leclerc J, Foretz M, Andreelli F. Cellular and molecular mechanisms of metformin: an overview. Clin Sci (Lond) 2012;122:253–270. doi: 10.1042/CS20110386. - DOI - PMC - PubMed
    1. Novelle MG, Ali A, Dieguez C, Bernier M, de Cabo R. Metformin. A Hopeful Promise in Aging Research. CSH Perspect Med. 2016;6:a025932. - PMC - PubMed

MeSH terms