. 2018 Dec 4;115(49):E11513-E11522.
doi: 10.1073/pnas.1812273115. Epub 2018 Nov 15.

The CD4-CD8- MAIT cell subpopulation is a functionally distinct subset developmentally related to the main CD8+ MAIT cell pool

Affiliations

The CD4-CD8- MAIT cell subpopulation is a functionally distinct subset developmentally related to the main CD8+ MAIT cell pool

Joana Dias et al. Proc Natl Acad Sci U S A. .

Abstract

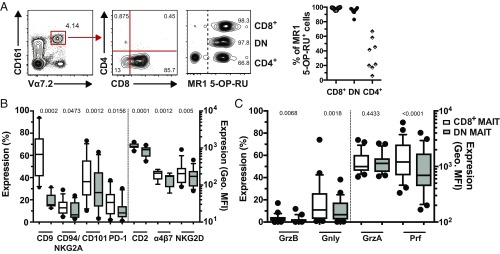
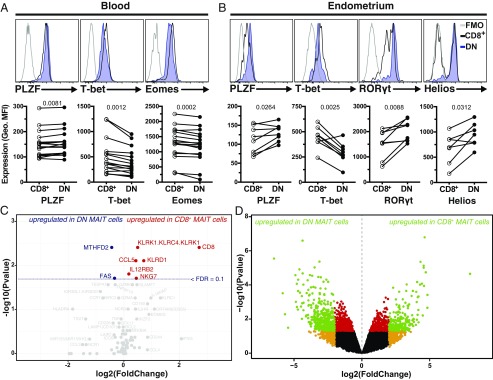
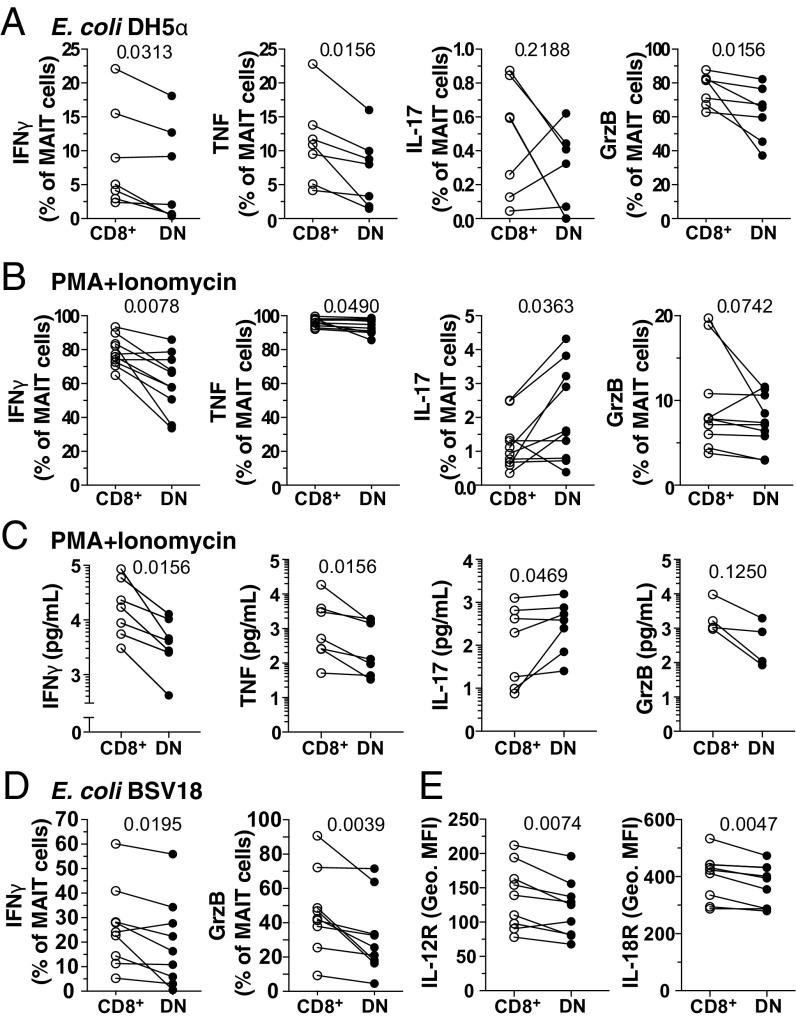
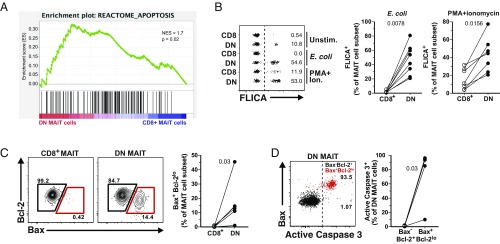
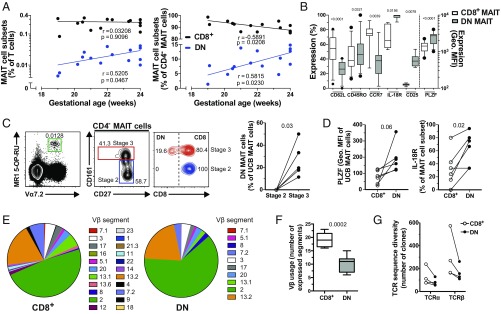
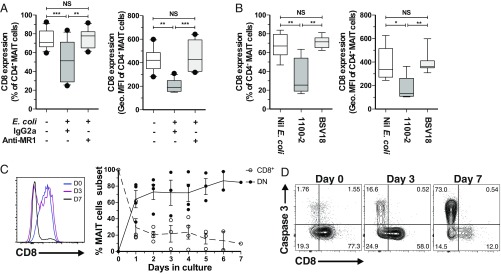
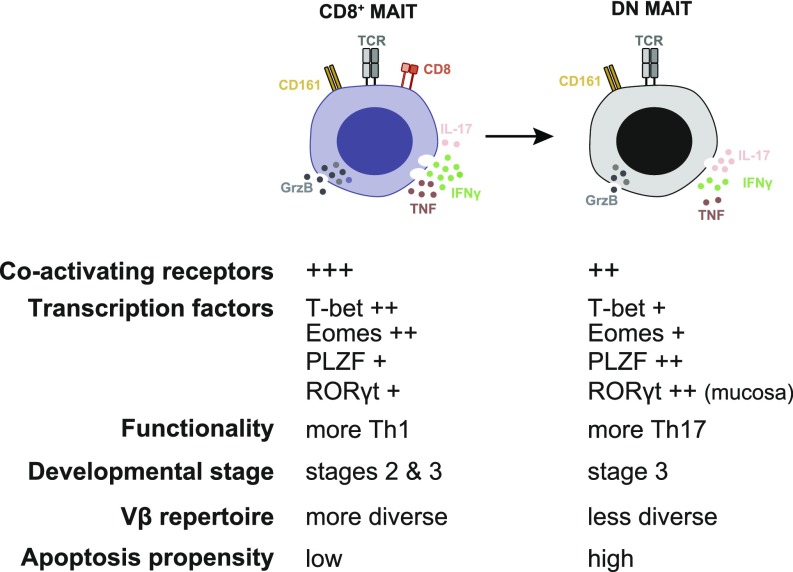
Mucosa-associated invariant T (MAIT) cells are unconventional innate-like T cells that recognize microbial riboflavin metabolites presented by the MHC class I-like protein MR1. Human MAIT cells predominantly express the CD8α coreceptor (CD8+), with a smaller subset lacking both CD4 and CD8 (double-negative, DN). However, it is unclear if these two MAIT cell subpopulations distinguished by CD8α represent functionally distinct subsets. Here, we show that the two MAIT cell subsets express divergent transcriptional programs and distinct patterns of classic T cell transcription factors. Furthermore, CD8+ MAIT cells have higher levels of receptors for IL-12 and IL-18, as well as of the activating receptors CD2, CD9, and NKG2D, and display superior functionality following stimulation with riboflavin-autotrophic as well as riboflavin-auxotrophic bacterial strains. DN MAIT cells display higher RORγt/T-bet ratio, and express less IFN-γ and more IL-17. Furthermore, the DN subset displays enrichment of an apoptosis gene signature and higher propensity for activation-induced apoptosis. During development in human fetal tissues, DN MAIT cells are more mature and accumulate over gestational time with reciprocal contraction of the CD8+ subset. Analysis of the T cell receptor repertoire reveals higher diversity in CD8+ MAIT cells than in DN MAIT cells. Finally, chronic T cell receptor stimulation of CD8+ MAIT cells in an in vitro culture system supports the accumulation and maintenance of the DN subpopulation. These findings define human CD8+ and DN MAIT cells as functionally distinct subsets and indicate a derivative developmental relationship.

Keywords: CD8; MAIT cells; MR1; apoptosis; functional heterogeneity.


Conflict of interest statement

The authors declare no conflict of interest.

Figures

Fig. 1.
Fig. 1.
Human CD8+ MAIT cells display higher expression of coactivating receptors and cytotoxic molecules. (A) Representative flow cytometry identification of CD161hiVα7.2+ MAIT cells, CD4 and CD8 staining within the MAIT cell population, and MR1 5-OP-RU tetramer staining within CD8+, DN, and CD4+ CD161hiVα7.2+ MAIT cells (Left). Percentage of MR1 5-OP-RU+ cells within the CD161hiVα7.2+ CD8+, DN, and CD4+ MAIT cells (Right). (B) The expression of the coactivating receptors CD2 and CD9, as well as of CD101, α4β7, PD-1, CD94, NKG2A, and NKG2D on CD8+ and DN MAIT cells. (C) The expression of cytolytic proteins in CD8+ and DN MAIT cells. Data are from 8 to 10 donors for MR1 5-OP-RU tetramer staining (A), 10 donors for surface marker expression (B), and 25 donors for cytolytic protein expression (C). Box-and-whisker plots show the median, the 10th and 90th percentiles, and the IQR. The paired t test was used to detect significance between paired samples, except for PD-1, NKG2D, Gnly, and Prf, where the Wilcoxon’s signed-rank test was used.
Fig. 2.
Fig. 2.
CD8+ and DN MAIT cells express different levels of critical transcription factors. Representative example and geometric MFI of the staining intensity of (A) PLZF, T-bet, and Eomes in peripheral blood CD8+ and DN MAIT cells, and (B) PLZF, T-bet, RORγt, and Helios in endometrium-derived CD8+ and DN MAIT cells. The fluorescence minus one (FMO) control is included as control. (C and D) Volcano plots showing fold-changes in the expression of individual genes in CD8+ MAIT cells compared with DN MAIT cells as a function of their P values, as determined by Fluidigm Biomark (C) or RNAseq (D). Dotted line represents filtering criteria of FDR = 0.1 (C). Filtering criteria for green, red, and orange data points are P < 0.05 and absolute log2(fold-change) > 2; P < 0.05; absolute log2(fold-change) > 2, respectively (D). Data are from 16 (A), 8 (B), 9 (C), and 4 (D) donors (seven donors for Helios in B). Lines in the graphs represent individual donors. The paired t test was used to detect significant differences between paired samples, except for PLZF (A) and Helios (B), where the Wilcoxon’s signed-rank test was used.
Fig. 3.
Fig. 3.
DN MAIT cells display less functional capacity following bacterial and mitogenic stimulation than CD8+ MAIT cells. Percentage of FACS-sorted CD8+ and DN MAIT cells expressing IFN-γ, TNF, IL-17, and GrzB after stimulation with (A) E. coli for 24 h (n = 7) and (B) PMA/ionomycin for 6 h (n = 10). (C) Concentration of IFN-γ, TNF, IL-17, and GrzB after stimulation with PMA/ionomycin for 6 h (n = 4–7). (D) Expression of IFN-γ and GrzB by MAIT cells within bulk PBMC culture in the presence of RibA E. coli BSV18 (n = 9). (E) Expression levels (geometric MFI) of IL-12R and IL-18R in resting CD8+ and DN MAIT cells (n = 9). Lines in the graphs represent individual donors. The Wilcoxon’s signed-rank test was used to detect significant differences between paired samples, except for IFN-γ, TNF, and IL-17 in the PMA/ionomycin stimulation where the paired t test was used.
Fig. 4.
Fig. 4.
DN MAIT cells are more prone to apoptosis than CD8+ MAIT cells. (A) Gene-set enrichment summary plot for CD8+ MAIT cell versus DN MAIT cell differentially expressed ranked genes and a defined set of genes associated with an apoptosis signature. (B) Representative example of FLICA expression in FACS-sorted CD8+ and DN MAIT cells in the absence of stimulation, or after E. coli- or PMA/ionomycin-mediated stimulations (Left). Summary data with the percentage of stimulated CD8+ and DN MAIT cells expressing FLICA (Right). (C) Representative FACS plots and the frequency of Bax and Bcl-2 expression in resting CD8+ and DN MAIT cells. (D) Representative FACS plot and expression of active caspase 3 in Bax+Bcl-2lo (red gate) DN MAIT cells. Data are from seven (A), eight (B; E. coli), seven (B; PMA/ionomycin), and six (C and D) donors. Lines in the graphs represent individual donors. The Wilcoxon’s signed-rank test was used to detect significant differences between paired samples. NES, normalized enrichment score.
Fig. 5.
Fig. 5.
Fetal DN MAIT cells express a more mature phenotype and adult DN MAIT cells express a more restricted TCR repertoire than their CD8+ counterparts. (A) Correlations between the fetal gestational age and the levels of fetal splenic CD8+ and DN MAIT cells as a proportion of T cells (Left) and of CD4 MAIT cells (Right). (B) Expression of CD62L, CD45RO, CCR7, IL-18Rα, CD25, and PLZF in fetal splenic CD8+ and DN MAIT cells. Percentage of cells expressing each of these markers, except for PLZF for which the geometric MFI of the staining is shown. (C) Representative example of the identification of stage 2 and stage 3 MAIT cells from UCB and their CD8 expression, and the percentage of DN MAIT cells within each developmental stage. (D) PLZF and IL-18R expression by CD8+ and DN UCB MAIT cells. (E) Median percentage of adult circulating CD8+ and DN MAIT cells expressing each TCR Vβ segment. (F) Number of TCR Vβ segments expressed by adult circulating CD8+ and DN MAIT cells. (G) TCR-α and TCR-β sequence diversity of CD8+ and DN MAIT cells as determined by RNA sequencing. Data are from 15 donors (A); 11 (B; CD62L and CD45RO), 9 (B; CCR7), 7 (B; IL-18R), 8 (B; CD25), and 12 (B; PLZF) donors (B); 6 donors (C and D); 16–19 (E; CD8+ MAIT) and 14–17 (E; DN MAIT) donors (E); 9 (F; CD8+ MAIT) and 7 (F; DN MAIT) donors (F); and 4 donors (G). The box-and-whisker plots show the median, the 10th and 90th percentiles, and the IQR. Correlations were calculated using the Spearman’s test. The Wilcoxon’s signed-rank test was used to detect differences between paired samples for IL-18R, CCR7, CD25 (B) and in C, and the paired t test was used for the remainder (B and D). The unpaired t test was used to detect significant differences between unpaired samples (F).
Fig. 6.
Fig. 6.
DN MAIT cells derived from CD8+ MAIT cells in vitro. (A) CD8 expression as percentage (Left) and geometric MFI (Right) in unstimulated and E. coli DH5α-stimulated MAIT cells in the presence of anti-MR1 mAb or isotype control (n = 15). (B) CD8 expression as percentage (Left) and geometric MFI (Right) in unstimulated and riboflavin autotroph E. coli 1100-2− or riboflavin auxotroph E. coli BSV18-stimulated MAIT cells (n = 11). (C) Representative histogram of CD8 expression (Left) and percentage of CD8+ and DN MAIT cell subsets (Right), and (D) representative FACS plots of active caspase 3 expression, during in vitro culture of FACS-sorted MAIT cells in the presence of immobilized Vα7.2 and CD28 mAb. The box-and-whisker plots show the median, the 10th and 90th percentiles, and the IQR. The lines and error bars represent mean and SE. The Friedman test followed by Dunn’s post hoc test was used to detect significant differences between multiple, paired samples (A and B). *P < 0.05, **P < 0.01, ***P < 0.001. NS, not significant.
Fig. 7.
Fig. 7.
Properties and relationship of the main MAIT cell subsets.

References

    1. Fergusson JR, et al. CD161 defines a transcriptional and functional phenotype across distinct human T cell lineages. Cell Rep. 2014;9:1075–1088. - PMC - PubMed
    1. Lepore M, et al. Parallel T-cell cloning and deep sequencing of human MAIT cells reveal stable oligoclonal TCRβ repertoire. Nat Commun. 2014;5:3866, and correction (2014) 5:4493. - PubMed
    1. Reantragoon R, et al. Antigen-loaded MR1 tetramers define T cell receptor heterogeneity in mucosal-associated invariant T cells. J Exp Med. 2013;210:2305–2320. - PMC - PubMed
    1. Tilloy F, et al. An invariant T cell receptor alpha chain defines a novel TAP-independent major histocompatibility complex class Ib-restricted alpha/beta T cell subpopulation in mammals. J Exp Med. 1999;189:1907–1921. - PMC - PubMed
    1. Treiner E, et al. Selection of evolutionarily conserved mucosal-associated invariant T cells by MR1. Nature. 2003;422:164–169. - PubMed

Publication types