. 2019 Jan 31;133(5):481-493.
doi: 10.1182/blood-2018-07-861237. Epub 2018 Nov 15.

Neutrophil α-defensins promote thrombosis in vivo by altering fibrin formation, structure, and stability

Affiliations

Neutrophil α-defensins promote thrombosis in vivo by altering fibrin formation, structure, and stability

Rami Abu-Fanne et al. Blood. .

Abstract

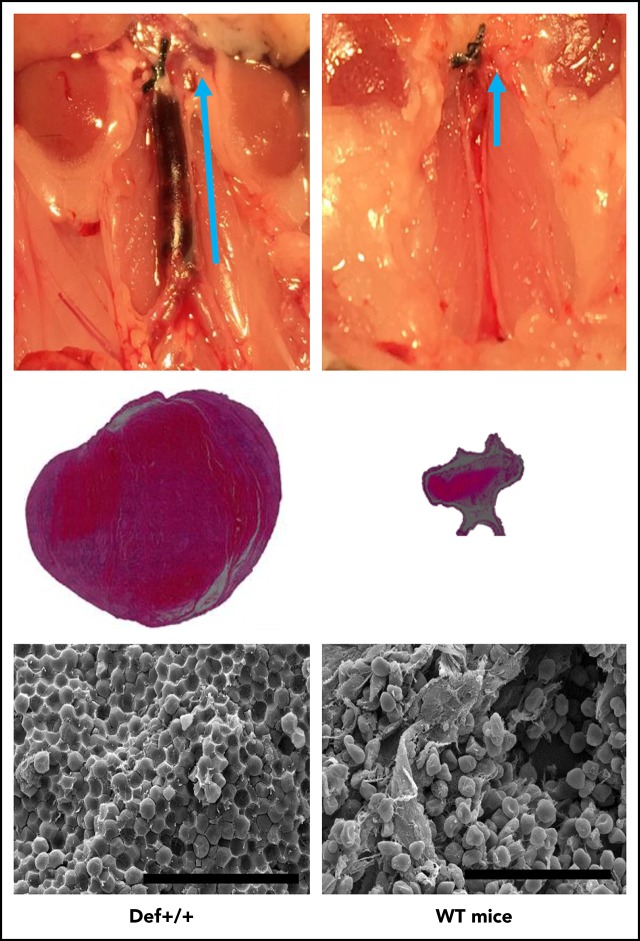
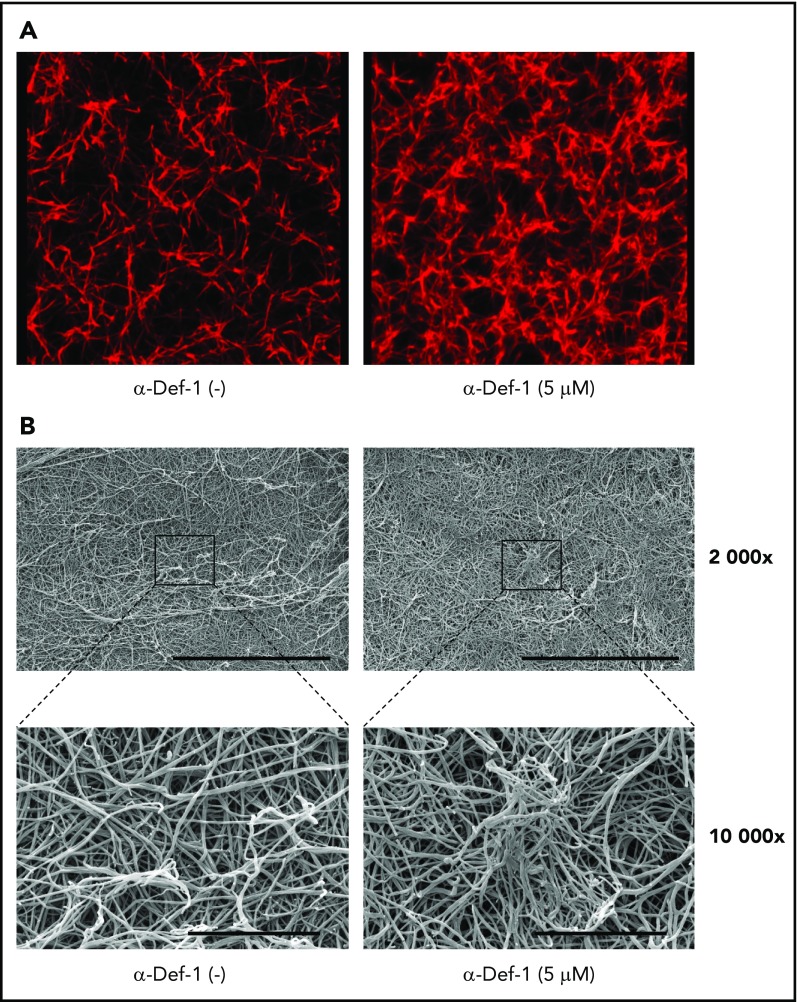
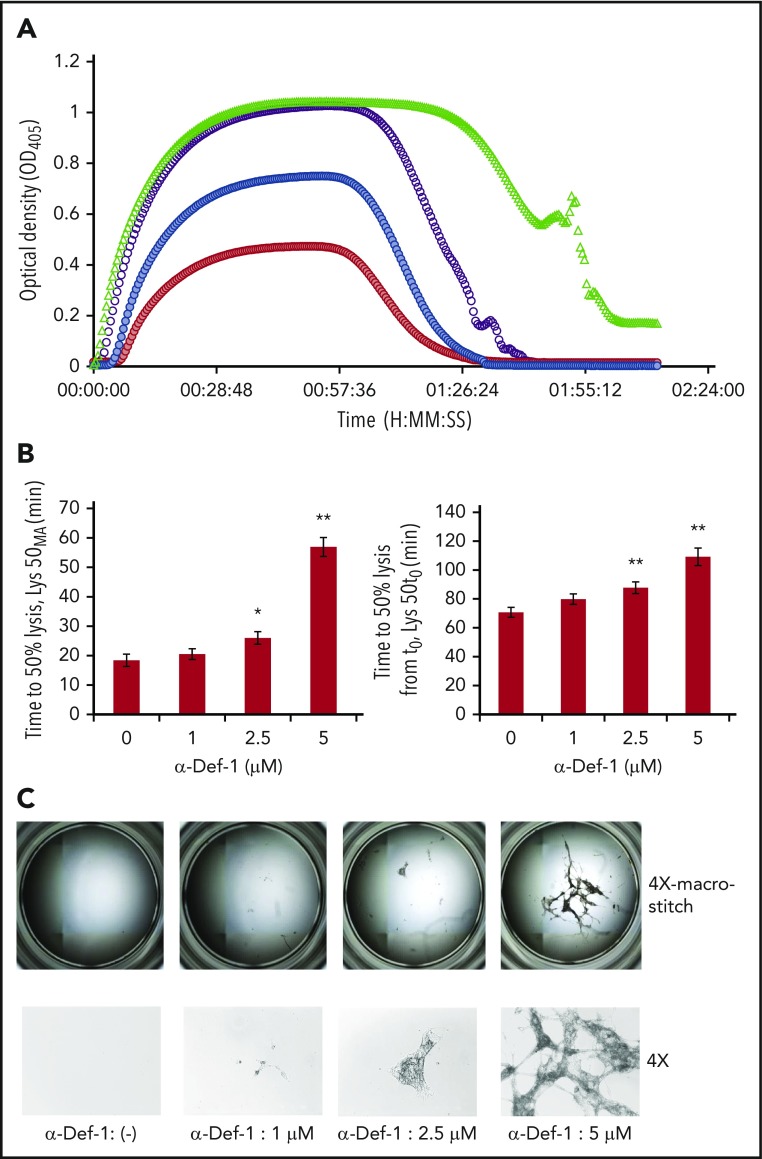
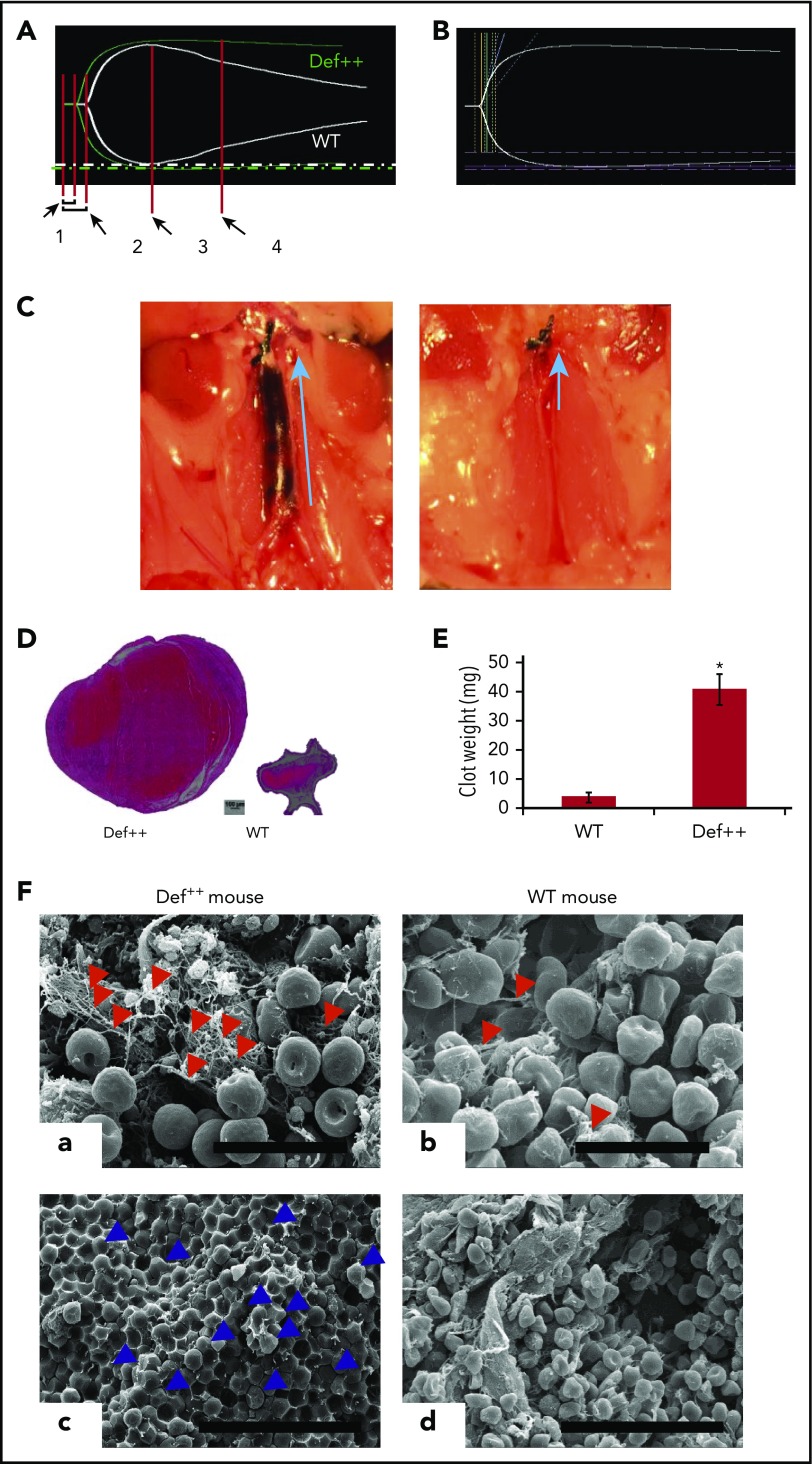
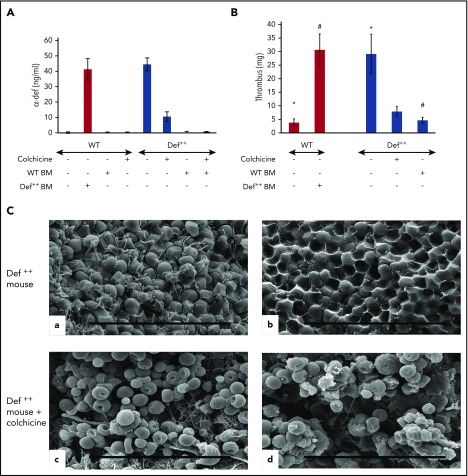
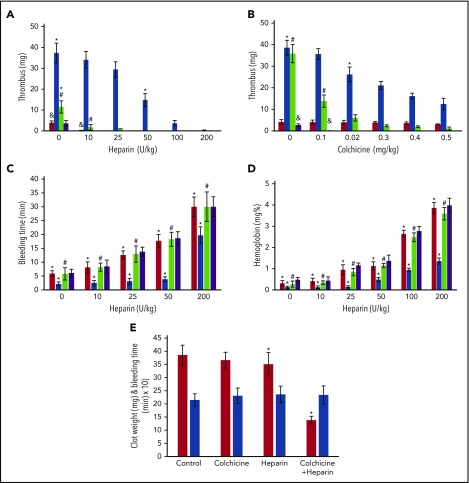
Inflammation and thrombosis are integrated, mutually reinforcing processes, but the interregulatory mechanisms are incompletely defined. Here, we examined the contribution of α-defensins (α-defs), antimicrobial proteins released from activated human neutrophils, on clot formation in vitro and in vivo. Activation of the intrinsic pathway of coagulation stimulates release of α-defs from neutrophils. α-Defs accelerate fibrin polymerization, increase fiber density and branching, incorporate into nascent fibrin clots, and impede fibrinolysis in vitro. Transgenic mice (Def++) expressing human α-Def-1 developed larger, occlusive, neutrophil-rich clots after partial inferior vena cava (IVC) ligation than those that formed in wild-type (WT) mice. IVC thrombi extracted from Def++ mice were composed of a fibrin meshwork that was denser and contained a higher proportion of tightly packed compressed polyhedral erythrocytes than those that developed in WT mice. Def++ mice were resistant to thromboprophylaxis with heparin. Inhibiting activation of the intrinsic pathway of coagulation, bone marrow transplantation from WT mice or provision of colchicine to Def++ mice to inhibit neutrophil degranulation decreased plasma levels of α-defs, caused a phenotypic reversion characterized by smaller thrombi comparable to those formed in WT mice, and restored responsiveness to heparin. These data identify α-defs as a potentially important and tractable link between innate immunity and thrombosis.


Conflict of interest statement

Conflict-of-interest disclosure: The authors declare no competing financial interests.

Figures

None
Graphical abstract
Figure 1.
Figure 1.
Release of endogenous α-defs during blood coagulation. (A) α-Defs in plasma and serum. Blood collected from healthy volunteers in citrate to prepare plasma was allowed to sit at room temperature for 1 hour to prepare serum. Blood was centrifuged at 1500g for 10 minutes, and the concentration of α-defs 1-3 in the plasma and serum was measured by ELISA. The results shown are the mean ± SD from 10 human healthy volunteers (*P < .05). (B) Role of contact activation vs thrombin. Whole blood from 11 healthy donors collected in citrate or with no anticoagulant was clotted along a glass tube or following the addition of thrombin and calcium chloride. The concentrations of α-defs measured by ELISA in sera prepared by each method were compared. The results shown are the mean ± SD in samples from 11 healthy volunteers (*P < .05). (C) Role of the intrinsic vs extrinsic pathway. Serum was generated from citrated whole blood following the addition of calcium chloride and tissue factor (TF) or kaolin, with or without aprotinin, and the concentration of α-defs was measured as in panel A. (D) Role of kallikrein. Isolated human neutrophils were added to normal plasma, prekallikrein-deficient plasma (PK (−)), or prekallikrein-deficient plasma supplemented with prekallikrein (PK (−) + PK). Clotting was initiated by adding kaolin and calcium chloride. The concentration of α-defs in the serum was measured as in panel A. The results shown are the mean ± SD of 3 experiments (*P < .05). (E) Isolated human neutrophils in phosphate-buffered saline (PBS) containing 1 mM calcium chloride were incubated with FXIIa, FXIa, FIXa, or FXa alone or together with prekallikrein (PreK) or with prekallikrein alone for 30 minutes, followed by centrifugation and separation of the supernatant fluids. In some experiments, colchicine or CTI was added along with the coagulation factors, where indicated. The concentration of α-defs in the supernatants was measured as in panel A. (F) Incorporation of α-defs into blood clots. An aliquot of 125I-α-Def-1 was added to purified fibrinogen. Clotting was induced by adding thrombin, and radioactivity in the fibrin clot and supernatant was measured. The mean ± SD of 3 experiments in shown. (G) Release of α-defs from lysed blood clots. Blood clots were formed using blood collected from healthy human volunteers as in panel B by contact with glass or by adding thrombin, separated by centrifugation, lysed by addition tPA, and recentrifuged, and the concentration of α-defs in the supernatants was measured. The mean ± SD of 3 experiments is shown.
Figure 2.
Figure 2.
Effect of exogenous α-Def-1 on the kinetics of fibrin clot formation. (A) Effect of α-Def-1 on dynamic clot turbidity. Clotting of purified fibrinogen was initiated by adding an “activation mix” containing 0.07 U/mL human α-thrombin (see supplemental Methods for details), 0 to 10 µM α-Def-1, and 10 mM calcium chloride. Fibrin formation was evaluated by monitoring the change in turbidity (A405) in the presence of 0 µM (solid purple line), 1 µM (green dashed line), 2.5 µM (blue dotted line), and 5 µM (red dashed line) synthetic α-Def-1. One experiment representative of 3 is shown. (B) Effect of α-Def-1 on the lag time and rate of fibrin polymerization. Fibrin formation was initiated as in panel A. Lag time, rate of polymerization, and maximum absorbance (Amax) were determined in reactions containing 0 to 5 µM synthetic α-Def-1 as in panel A. The mean ± SD of 4 experiments is shown. *P < .01, #P < .05. (C) Effect of α-Def-1 on thrombin amidolytic activity. Thrombin was added to PBS containing a chromogenic substrate in the absence (red dashed line and squares) or in the presence of 2 µM (blue line and circles) or 10 µM (green line and circles) α-Def-1. One experiment representative of 3 is shown. (D) Binding of α-defs to fibrinogen and fibrin. 125I-α-Def-1 (5 µg/mL; 28 µM), twice the concentration found in fibrin clots (Figure 1G), was incubated with fibrinogen (100 µg/mL) (▲) or soluble fibrin (100 µg/mL) (△) in 200 μL PBS or PBS alone (○) for 60 minutes at 24°C. The mixture was loaded onto a Sephacryl S-100 gel filtration column, and radioactivity and optical density (OD) at 280 nm in each 0.5-mL fraction eluted from the column were measured. One experiment representative of 3 in shown.
Figure 3.
Figure 3.
Effects of α-Def-1 on fibrin structure. (A) Representative 3D confocal microscopy images of fibrin clots formed from fibrinogen in the absence (left) or presence (right) of 5 µM α-Def-1. Fibrin was visualized using Alexa Fluor 647–labeled fibrinogen. (B) Representative scanning electron micrographs of fibrin clots formed in the absence (left) or presence (right) of 5 μM α-Def-1 at original magnification ×2000 and ×10 000. Three individual clots were studied at each experimental condition. Scale bars represent 30 μm (top) and 5 μm (bottom).
Figure 4.
Figure 4.
α-Def-1 delays tPA-mediated lysis of fibrin clots. (A) Fibrin was formed as in Figure 2A from fibrinogen supplemented with plasminogen, tPA, and 0-5 µM α-Def-1, and dynamic clot turbidity (A405nm) was measured. The results shown are representative of 4 experiments. (B) The time to attain 50% lysis of the fibrin clots formed in panel A, defined as the time elapsed from the maximal to the half-maximal A405 value (Lys50MA) (left) and the time from initiation of clotting needed to reduce the maximum turbidity of the clot to the half-maximal value (Lys50t0) (right), were determined. The mean ± SD is shown. The results shown are averages from 4 experiments. *P < .05, **P < .01. (C) Photographs of residual fibrin taken after lysis was allowed to proceed for 150 minutes. Images were taken with the EVOS FL Auto Cell Imaging System using EVOS software Scan and Stitch function (top). Individual representative images taken at original magnification ×4 are shown (bottom).
Figure 5.
Figure 5.
Endogenous α-defs accelerate coagulation and impair fibrinolysis in whole blood. (A) Blood was drawn from WT and Def++ mice. Clotting initiated by adding kaolin and calcium chloride was monitored by thromboelastography. “1” and “2” denote the time until the first evidence of clot formation was detected in WT and Def++ mice, respectively. “3” and “4” depict lysis in WT and Def++ mice, respectively. One experiment representative of 3 is shown. (B) Blood was drawn from a healthy human donor. Clotting was initiated and monitored as in panel A. Results show the comparability of the thromboelastography tracing in human blood and blood from Def++ mice expressing α-Def-1. One experiment representative of 3 is shown. (C) Formation of IVC thrombi in Def++ mice. Partial occlusion of the IVC was induced in Def++ and WT mice. Arrows denote the direction of blood flow and the size of the clot. (D) Three days later, clots were removed. The weights of clots extracted from Def++ and WT mice are shown. (E) The segment of the IVC containing the blood clot was excised. The clots were embedded in paraffin, sectioned, and stained with hematoxylin and eosin, and the results are shown at original magnification ×50. Panels C-E are representative of results in 12 mice. *P < .001. (F) Effect of α-def-1 on the structure of mouse IVC thrombi. Scanning electron microscopy of thrombi within the IVC of Def++ and WT mice. a and c show the clot surface, and b and d show the clot interior. Fibrin fibrils elements are identified with red arrowheads; representative compressed red blood cells (polyhedrocytes) are identified with blue arrowheads. The fibrin meshwork on the surface of the clot in Def++ is more dense (a), and many more polyhedrocytes are seen within the clot (c) than within thrombi from WT mice (b and d, respectively). Scale bars represent 10 μm (a and b) and 30 μm (c and d).
Figure 6.
Figure 6.
Phenotypic reversion by preventing release of α-defs. (A) Effect of colchicine and BMT on plasma α-defs. Def++ mice were given colchicine or saline in their drinking water for 2 weeks. A second cohort of WT mice underwent BMT from Def++ mice that received either colchicine or saline for 2 weeks. Plasma α-Def-1 was measured by ELISA. Results shown are the mean ± SD in 13 mice. (B) Effect of colchicine and BMT on thrombus development in Def++ mice. IVC stenosis was induced in Def++ mice given colchicine or saline in their drinking water and in Def++ and WT mice after BMT as described in panel A. Thrombus weight was measured as in Figure 4. The mean ± SD in 11 mice is shown (* and #, P < .05). (C) Effect of colchicine on IVC structure in Def++ mice. Scanning electron microscopy images of the surface (a and c) and interiors (b and d) of thrombi extracted from untreated Def++ mice (a and b) and Def++ mice given colchicine (c and d) are shown. Scale bars, 30 μm.
Figure 7.
Figure 7.
Effect of colchicine on heparin antithrombotic activity in Def++mice. (A-B) Prevention of IVC thrombosis by colchicine. (A) One hour after IVC stenosis was induced, mice were given IV saline (n = 13), heparin (0-200 U/kg) (n = 17), a fixed dose of colchicine (0.5 mg/kg) (n = 16), or heparin + colchicine (n = 21). WT mice (red) and Def++ mice (blue) were given heparin alone. WT mice (purple) and Def++ mice (green) were given heparin and colchicine. Clots were extracted and weighed 72 hours after stenosis (*, #, &, P < .05). (B) IVC stenosis was induced as in panel A. One hour later, mice were given IV saline (n = 9), colchicine (0-0.5 mg/kg) (n = 17), a fixed dose of heparin (10 U/kg) (n = 14), or heparin + colchicine (n = 14). WT mice (red) and Def++ mice (blue) were given colchicine alone. WT mice (purple) and Def++ mice (green) were given heparin and colchicine. Clots were extracted and weighed 72 hours after stenosis (*, #, P < .05). (C-D) Effect of colchicine on bleeding. (C) Mice were treated as in panel A. Tail-bleeding times were measured at 72 hours after receiving the indicated doses of heparin, colchicine, or both. WT mice (red) and Def++ mice (blue) were given heparin alone. WT mice (purple) and Def++ mice (green) were given heparin and colchicine. (D) The hemoglobin concentration in blood extravasated during the initial 30 minutes after transection. WT mice (red) and Def++ mice (blue) were given heparin alone. WT mice (purple) and Def++ mice (green) were given heparin and colchicine (*, #, P < .05). (E) Clot weight (red) and tail-bleeding times (blue) were measured 72 hours after IVC stenosis, followed 1 hour later by IV administration of colchicine (0.1 mg/kg) (n = 14), heparin (10 U/kg) (n = 14), or both (n = 11), as described in panel A. The mean ± SD are shown (*, #, P < .05).

Comment in

References

    1. Massberg S, Grahl L, von Bruehl ML, et al. Reciprocal coupling of coagulation and innate immunity via neutrophil serine proteases. Nat Med. 2010;16(8):887-896. - PubMed
    1. Engelmann B, Massberg S. Thrombosis as an intravascular effector of innate immunity. Nat Rev Immunol. 2013;13(1):34-45. - PubMed
    1. Emmi G, Silvestri E, Squatrito D, et al. Thrombosis in vasculitis: from pathogenesis to treatment. Thromb J. 2015;13(1):15. - PMC - PubMed
    1. Aksu K, Donmez A, Keser G. Inflammation-induced thrombosis: mechanisms, disease associations and management. Curr Pharm Des. 2012;18(11):1478-1493. - PubMed
    1. Esmon CT, Xu J, Lupu F. Innate immunity and coagulation. J Thromb Haemost. 2011;9(Suppl 1):182-188. - PMC - PubMed

Publication types

MeSH terms