Radiation combined with macrophage depletion promotes adaptive immunity and potentiates checkpoint blockade
- PMID: 30442705
- PMCID: PMC6284388
- DOI: 10.15252/emmm.201809342
Radiation combined with macrophage depletion promotes adaptive immunity and potentiates checkpoint blockade
Abstract
Emerging evidence suggests a role for radiation in eliciting anti-tumour immunity. We aimed to investigate the role of macrophages in modulating the immune response to radiation. Irradiation to murine tumours generated from colorectal (MC38) and pancreatic (KPC) cell lines induced colony-stimulating factor 1 (CSF-1). Coincident with the elevation in CSF-1, macrophages increased in tumours, peaking 5 days following irradiation. These tumour-associated macrophages (TAMs) were skewed towards an immunosuppressive phenotype. Macrophage depletion via anti-CSF (aCSF) reduced macrophage numbers, yet only achieved tumour growth delay when combined with radiation. The tumour growth delay from aCSF after radiation was abrogated by depletion of CD8 T cells. There was enhanced recognition of tumour cell antigens by T cells isolated from irradiated tumours, consistent with increased antigen priming. The addition of anti-PD-L1 (aPD-L1) resulted in improved tumour suppression and even regression in some tumours. In summary, we show that adaptive immunity induced by radiation is limited by the recruitment of highly immunosuppressive macrophages. Macrophage depletion partly reduced immunosuppression, but additional treatment with anti-PD-L1 was required to achieve tumour regression.
Keywords: immunosuppression; immunotherapy; macrophage; radiation.
© 2018 The Authors. Published under the terms of the CC BY 4.0 license.
Figures

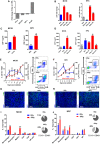
- A
MC38 cells in tissue culture were treated with mock (0 Gy) and 10 Gy irradiation. Conditioned medium (CM) was collected after 48 h and assayed for the indicated cytokines. Fold changes in the amounts of the cytokines are shown.
- B
CSF‐1 mRNA expression was measured in MC38 and KPC cells exposed to 10 Gy IR compared with mock‐irradiated cells. Cells were harvested at 24, 48 and 72 h after irradiation, and RNA expression was analysed by RT–qPCR. Data are presented as mean ± SEM and analysed by Kruskal–Wallis test with Dunn's multiple comparisons test (n = 3).
- C
CSF‐1 protein (pg/mg total protein) in CM collected from MC38 and KPC cells 48 h after exposure to 10 Gy IR compared to mock‐irradiated cells. Data are presented as mean ± SEM and analysed by Mann–Witney test (n = 3).
- D
CSF‐1 protein (pg/mg total protein) measured by ELISA in the sera of naïve mice, mice bearing mock‐irradiated tumours and mice bearing irradiated tumours analysed at time points as indicated (n = 4/group). Data are presented as mean ± SEM and analysed by Kruskal–Wallis test with Dunn's multiple comparisons test.
- E, F
MC38 (E) and KPC (F) tumours were irradiated with 10 Gy. Average tumour volume (red line) is shown with mean TAM infiltrate (blue line) for each time point. For TAM quantification, tumours were disaggregated and CD11b+/F480+ TAMs identified by flow cytometry. Data are presented as mean ± SEM for TAMs and SEM for tumour volume (n = 6). Data are presented as mean ± SEM and analysed by Kruskal–Wallis test with Dunn's multiple comparisons test.
- G, H
Immunofluorescent staining of MC38 (G) and KPC (H) tumour sections; blue = DAPI, green = CD68 (TAMs).
- I, J
Flow cytometric analysis of immune cell populations within MC38 (I) and KPC (J) tumours 5 days following 10 Gy IR compared to mock‐irradiated tumours. Macrophages (CD11b+F480+), neutrophils (CD11b+Ly6G+), myeloid‐derived suppressor cells (CD11b+Gr1+), CD8 T cells (CD45+CD3+CD8+), CD4 T cells (CD45+CD3+CD4+), and natural killer cells (CD45+NK1.1+) were identified. Pie charts represent the proportion of CD45+ leucocytes out of the total cells. Data are presented as mean ± SEM and analysed by unpaired t‐test (n = 3).
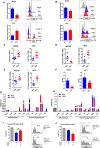
- A
Quantification of iNOS expression on gated macrophages (CD11b+F480+) from MC38 and KPC tumours, with representative histograms. Data are presented as mean ± SEM and analysed by Mann–Witney test (n = 6 mice/group).
- B
Quantification of CD206 expression on macrophages (CD11b+F480+) from MC38 and KPC tumours, with representative histograms. Data are presented as mean ± SEM and analysed by Mann–Witney test (n = 6 mice/group).
- C
Quantification of the percentage of TAMs (CD11b+F480+) in MC38 control tumours compared with irradiated tumours (n = 6 mice/group). Data were analysed by Mann–Witney test.
- D, E
Quantification of iNOShi (D) and CD206hi (E) macrophages as a percentage of total cells in MC38 tumours (n = 6). Data are presented as mean ± SEM and analysed by Mann–Witney test.
- F
The total number of iNOShi TAMs were divided by CD206hi TAMs to derive a M1/M2 ratio in MC38 and KPC tumours receiving mock or 10 Gy irradiation. Data are presented as mean ± SEM and analysed by Mann–Witney test (n = 6 mice/group).
- G, H
TAMs (CD11b+F480+) were isolated by FACS. Expression of selected immune stimulatory and immunosuppressive genes in TAMs was determined by RT–qPCR (n = 3). Data are presented as mean fold change ± SEM compared to TAMs from mock‐irradiated tumours (n = 3). Statistical significance was determined by Mann–Witney test.
- I, J
Assessment of TAM suppression of T cells was assayed by evaluation of inhibition of T‐cell proliferation. TAMs were isolated by magnetic bead separation using F480 microbeads and co‐cultured at a 1:1 ratio with CFSE‐labelled CD8+ T cells. CFSE dilution was analysed by flow cytometry to measure proliferation. Percentages of CFSElo T cells were analysed by Kruskal–Wallis test with Dunn's multiple comparisons test. Representative histograms are shown (right panel). Experiments were repeated twice for each tumour cell line (n = 3 mice/group, mean ± SEM).
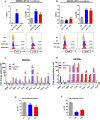
- A, B
Flow cytometric analysis of iNOS and CD206 expression on wild‐type (WT) BMDMs and BMDMs co‐cultured with naïve or irradiated MC38 (A) and KPC (B) tumour cells. Representative histograms are also shown (bottom panel). Data are presented as mean ± SEM and analysed by Kruskal–Wallis test with Dunn's multiple comparisons test (n = 3/group).
- C, D
RNA was extracted from BMDMs co‐cultured with MC38 (C) and KPC (D) tumours cells. Expression of selective inflammatory and immunosuppressive genes was analysed by RT–qPCR. Data shown are fold changes compared to WT. Data are presented as mean ± SEM and analysed by Kruskal–Wallis with Dunn's multiple comparisons test (n = 3/group).
- E, F
T‐cell proliferation suppressive activity of BMDMs co‐cultured with MC38 (E) and KPC (F) tumour cells. Data are presented as mean ± SEM and analysed by Kruskal–Wallis test with Dunn's multiple comparisons test. BMDMs were co‐cultured for 72 h before being added at a 1:1 ratio with carboxyfluorescein succinimidyl ester (CFSE) labelled naïve murine CD8+ T cells for 55 h. CFSE dilution was analysed by flow cytometry. Percentage of CFSElo T cells were quantified and analysed by unpaired t‐test. Experiments were repeated twice per cell line to ensure statistical concordance (n = 3).
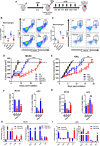
- A
The figure shows a schematic outlining the experimental approach. MC38 and KPC tumours were induced in the flank of C57BL/6 wild‐type mice. When tumours reached 80 mm3, mice were randomly assigned to treatment groups and received antibody treatment (IgG or aCSF). When tumours reached 100 mm3, mice in the irradiation groups received 10 Gy to the tumours. For growth kinetics, a humane end‐point was reached when tumours exceeded 500 mm3.
- B, C
Flow cytometric analysis of TAMs (CD11b+F480+) in MC38 (B) and KPC (C) tumours receiving indicated treatments. Tumours were harvested 5 days following IR and disaggregated for analysis by flow cytometry. The left panels show the data derived from the flow cytometry with representative plots shown in the right panels. Data are presented as mean ± SEM and analysed by one‐way ANOVA with Tukey's post hoc adjustment (n = 6 mice/group, three independent experiments).
- D, E
Tumour growth kinetics of MC38 (D) and KPC (E) tumours receiving the indicated treatments. Data are presented as mean tumour volume ± SEM and analysed by one‐way ANOVA with Tukey's post hoc adjustment (n = 6 mice/group).
- F, G
Shows flow cytometric analysis of CD206hi (F) and iNOShi (G) TAMs in MC38 and KPC tumours 5 days following IR. Data are presented as mean ± SEM and analysed by one‐way ANOVA with Tukey's post hoc adjustment (n = 6 mice/group).
- H, I
CD11b+F480+ TAMs were isolated from MC38 (H) and KPC (I) tumours 5 days following irradiation (±aCSF), and expression of selected immune stimulatory and immunosuppressive genes was analysed by RT–qPCR (n = 3). Data are presented as mean ± SEM (10 Gy vs. 10 Gy + aCSF n = 6 mice/group). Statistical significance was determined by Mann–Witney test.
- A, B
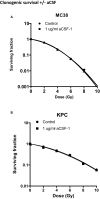
Clonogenic survival assays using MC38 (A) and KPC (B) tumour cells with the addition of aCSF. Cells were irradiated using a 127Cs laboratory irradiator to generate doses of 0, 2, 4, 6, 8 and 10 Gy, then cultured for 5–8 days and monitored for colony formation. Colony counting was performed on an Oxford Optronix™ GelCount system using the corresponding software. Comparison of survival between groups for each indicated tie point was analysed by unpaired t‐test. Data are presented as mean ± SD (n = 3/group).
- A, B
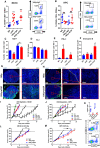
MC38 (A) and KPC (B) tumours were harvested 5 days following 10 Gy IR ± aCSF as indicated. The left panels show the percentage of CD45+CD3+CD8+ T cells in these tumours after the indicated treatments. Representative flow cytometry plots from the irradiated groups are shown in the right panels. Tumours that did not receive irradiation were harvested when tumours reached 500 mm3. Data are presented as mean ± SEM and analysed by one‐way ANOVA with Tukey's post hoc adjustment (A) and Kruskal–Wallis test with Dunn's multiple comparisons test (B) (n = 6 mice/group, three independent experiments).
- C
Flow cytometric analysis of Ki67 expression in the CD8+ T cells in MC38 tumours from A. Data are presented as mean ± SEM and analysed by Kruskal–Wallis test with Dunn's multiple comparisons test (n = 6/group).
- D
Flow cytometric analysis of PD‐1 expression on CD8+ T cells from MC38 in tumours as in (A). Data are presented as mean ± SEM and analysed by Kruskal–Wallis test with Dunn's multiple comparisons test (n = 6/group).
- E, F
Flow cytometric analysis of IFN‐γ and granzyme B expression in CD8+ T cells isolated from MC38 tumours in (A). Data are presented as mean ± SEM and analysed by Kruskal–Wallis test with Dunn's multiple comparisons test (n = 6 mice/group, three independent experiments).
- G, H
Immunofluorescent staining of MC38 (G) and KPC (H) tumour sections, blue = DAPI, green = CD8. Yellow line demarcates the tumour capsule.
- I, J
Tumour growth in CD8‐depleted C57BL/6 wild‐type mice bearing MC38 (I) and KPC (J) tumours receiving treatment as indicated (n = 6 mice/group). Data are presented as mean ± SEM and analysed by one‐way ANOVA with Tukey's post hoc adjustment.
- K
Flow cytometric quantification of intra‐tumour CD8 T cells following anti‐CD8 treatment. Data are presented as mean ± SEM and analysed by unpaired t‐test (n = 5 mice/group).
- L, M
Tumour growth in athymic nude mice bearing MC38 (I) and KPC (J) tumours receiving treatments as indicated (n = 6 mice/group). Data are presented as mean tumour volume ± SEM and analysed by one‐way ANOVA with Tukey's post hoc adjustment.

- A, B
CD8+ T cells were isolated from the spleens of MC38 tumour‐bearing mice. The tumours were radiated with 10 Gy, and cells were harvested 5 days later. Quantification (A) and representative images (B) of MC38 tumour cell‐specific tumour‐derived CD8 T‐cell responses detected by IFN‐γ ELISpot. The tumour‐specific CD8+ T‐cell response was evaluated after T‐cell incubation with naïve or irradiated MC38 cells for 24 h. Data are presented as mean ± SEM and analysed by Kruskal–Wallis test with Dunn's multiple comparisons test (n = 3 mice/group).
- C, D
Flow cytometric detection of major histocompatibility complex I (MHCI) expressed on MC38 (C) and KPC (D) tumour cells 48 h following exposure to 10 Gy IR. The left graph shows the overall data, with representative flow cytometry plots on the right. Data are presented as mean ± SEM and analysed by Mann–Witney test (n = 3/group).
- E, F
Flow cytometric quantification of major histocompatibility complex I (MHCI) expression in vivo. Gated MC38 (E) and KPC (F) tumour cells were analysed 48 h following exposure to 10 Gy IR. Data are presented as mean ± SEM and analysed by unpaired t‐test (n = 3/group).
- G, H
Flow cytometric quantification of dendritic cells (CD11b+CD11c+MHCII+) in MC38 (G) and KPC (H) tumours receiving treatment as indicated and as in (E, F). Data are presented as mean ± SEM and analysed by unpaired t‐test (n = 5 mice/group).
- I
Schema outlining double tumour model (see Materials and Methods).
- J, K
Tumour growth in mice bearing two MC38 tumours receiving 10 Gy IR to the primary lesion (J) ± systemic aCSF therapy (K). The differences in tumour volume 9 days following IR are presented as mean ± SEM and analysed by unpaired t‐test (n = 5 mice/group).
- L, M
Tumour growth in mice bearing two KPC tumours receiving 10 Gy IR to the primary lesion (J) ± systemic aCSF therapy (M). The difference in mean tumour volume 10 days following IR are presented as mean ± SEM and analysed by unpaired t‐test (n = 8 mice/group).
- N, O
Flow cytometric analysis of macrophages (N) and CD8 T cells (O) in primary and secondary MC38 tumours. Data are presented as mean ± SEM and analysed by Kruskal–Wallis test with Dunn's multiple comparisons test (n = 5 mice/group).

- A, B
Flow cytometric evaluation of MHCII+ TAMs (CD11b+F480+MHCII+) in MC38 (A) and KPC (B) tumours 5 days following irradiation. Data shown are mean + SEM and analysed by unpaired t‐test (n = 3/group). *P < 0.05.
- C, D
Splenic CD8 T cells were isolated from mice bearing MC38 tumours receiving treatment as indicated. T cells were cultured with naïve (C) or irradiated (10 Gy, D) tumour cells for 24 h before IFN‐γ ELISpot quantification. Data are presented as mean ± SEM and analysed by Kruskal–Wallis test with Dunn's multiple comparisons test (n = 3 mice/group).

- A
Flow cytometric evaluation of TAMs (CD11b+F480+) in primary tumours harvested from mice bearing two MC38 tumours.
- B
Flow cytometric evaluation of CD8 T cells (CD45+CD3+CD8a+) in primary tumours harvested from mice bearing two MC38 tumours.
- A–D
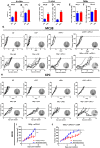
PD‐L1 expression on MC38 and KPC cells 48 h following 10 Gy irradiation in tissue culture (A, B) or 10 Gy irradiation of tumours (C, D) analysed by flow cytometry. Data are presented as mean ± SEM and analysed by Mann–Witney test (n = 3, A, B). Data are presented as mean ± SEM and analysed by unpaired t‐test (n = 5 mice/group, C, D).
- E, F
Flow cytometric analysis of PD‐L1 (E) and PD‐L2 (F) on TAMs in MC38 tumours receiving treatment as indicated above. Data are presented as mean ± SEM and analysed by Mann–Witney test (n = 5 mice/group).
- G, H
Tumour growth in mice bearing MC38 (G) and KPC (H) tumours receiving the indicated treatments. Data presented for individual mice. Pie charts indicate the number of regressions observed.
- I, J
Tumour growth in mice bearing KPC tumours mice receiving 10 Gy IR + systemic aPD‐L1 to the primary lesion (I) ± systemic aPD‐L1 + aCSF therapy (J). The difference in tumour volume 8 (I) or 10 (J) days following IR was analysed by unpaired t‐test (data presented as mean ± SEM, n = 8 mice/group).
References
-
- Berthel A, Zoernig I, Valous NA, Kahlert C, Klupp F, Ulrich A, Weitz J, Jaeger D, Halama N (2017) Detailed resolution analysis reveals spatial T cell heterogeneity in the invasive margin of colorectal cancer liver metastases associated with improved survival. Oncoimmunology 6: e1286436 - PMC - PubMed
-
- Chen C, Shang X, Cui L, Xu T, Luo J, Ba X, Zeng X (2008) L‐selectin ligation‐induced CSF‐1 gene transcription is regulated by AP‐1 in a c‐Abl kinase‐dependent manner. Hum Immunol 69: 501–509 - PubMed
Publication types
MeSH terms
Grants and funding
LinkOut - more resources
Full Text Sources
Other Literature Sources
Medical
Research Materials
Miscellaneous

