. 2019 Feb;9(2):220-229.
doi: 10.1158/2159-8290.CD-18-0706. Epub 2018 Nov 15.

PPT1 Promotes Tumor Growth and Is the Molecular Target of Chloroquine Derivatives in Cancer

Affiliations

PPT1 Promotes Tumor Growth and Is the Molecular Target of Chloroquine Derivatives in Cancer

Vito W Rebecca et al. Cancer Discov. 2019 Feb.

Abstract

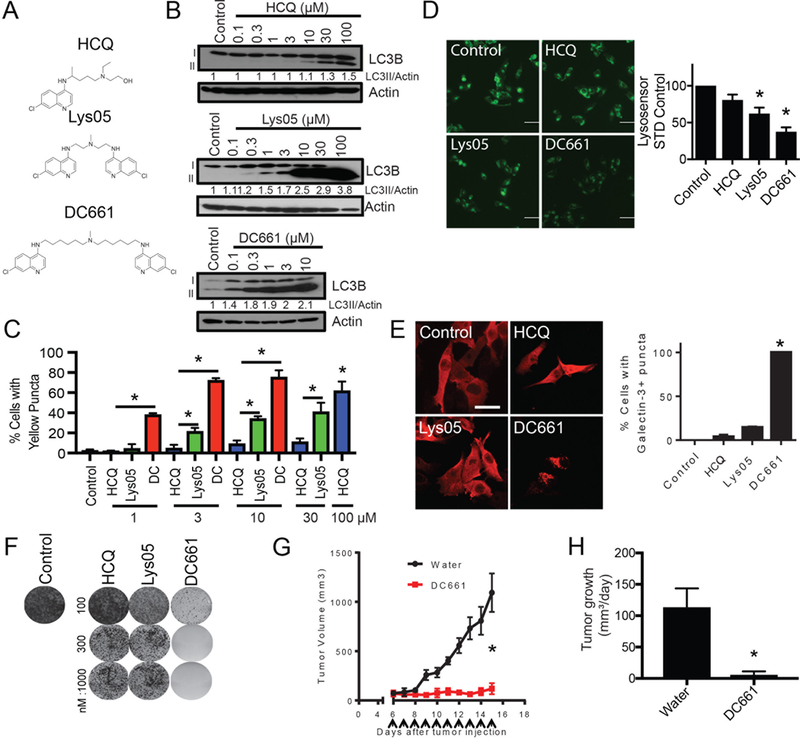
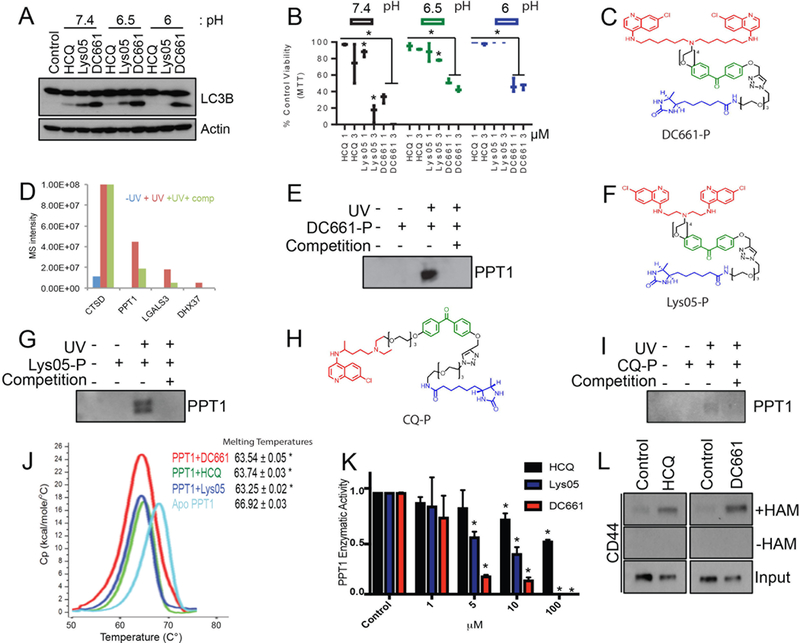
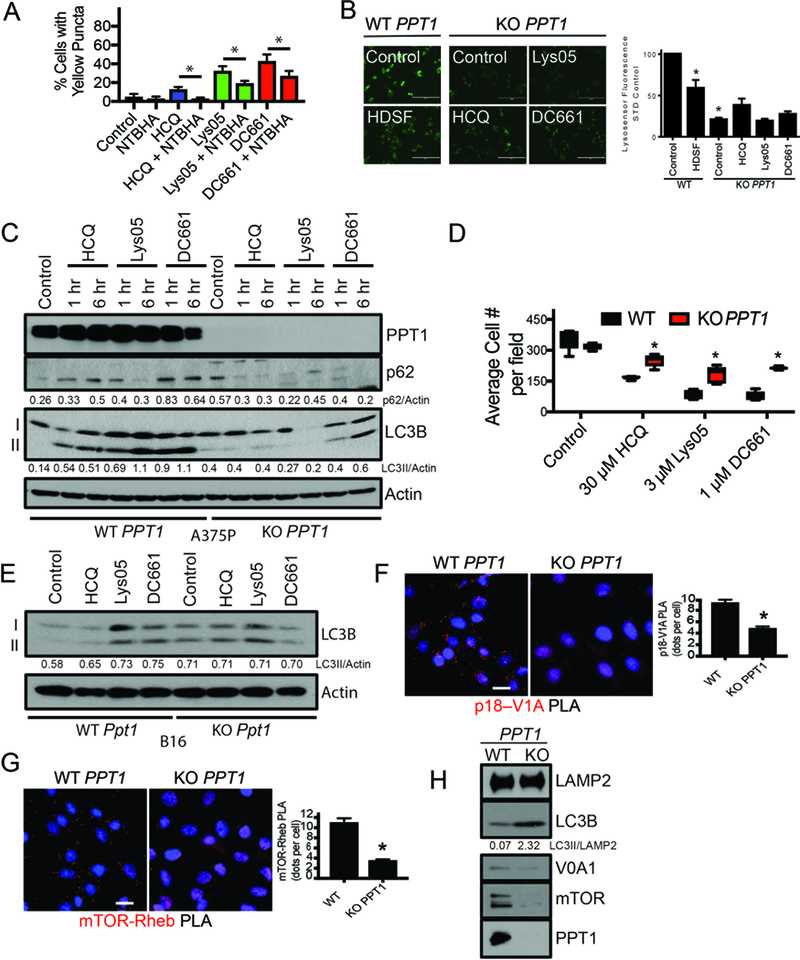
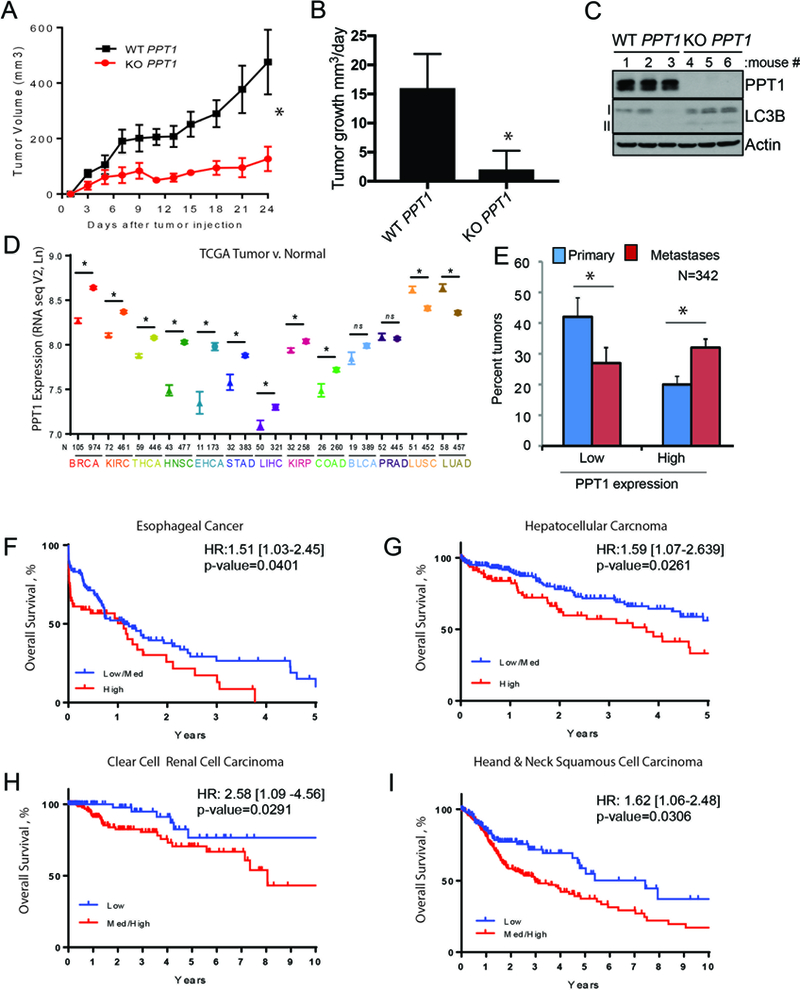
Clinical trials repurposing lysosomotropic chloroquine (CQ) derivatives as autophagy inhibitors in cancer demonstrate encouraging results, but the underlying mechanism of action remains unknown. Here, we report a novel dimeric CQ (DC661) capable of deacidifying the lysosome and inhibiting autophagy significantly better than hydroxychloroquine (HCQ). Using an in situ photoaffinity pulldown strategy, we identified palmitoyl-protein thioesterase 1 (PPT1) as a molecular target shared across monomeric and dimeric CQ derivatives. HCQ and Lys05 also bound to and inhibited PPT1 activity, but only DC661 maintained activity in acidic media. Knockout of PPT1 in cancer cells using CRISPR/Cas9 editing abrogates autophagy modulation and cytotoxicity of CQ derivatives, and results in significant impairment of tumor growth similar to that observed with DC661. Elevated expression of PPT1 in tumors correlates with poor survival in patients in a variety of cancers. Thus, PPT1 represents a new target in cancer that can be inhibited with CQ derivatives. SIGNIFICANCE: This study identifies PPT1 as the previously unknown lysosomal molecular target of monomeric and dimeric CQ derivatives. Genetic suppression of PPT1 impairs tumor growth, and PPT1 levels are elevated in cancer and associated with poor survival. These findings provide a strong rationale for targeting PPT1 in cancer. This article is highlighted in the In This Issue feature, p. 151.


Conflict of interest statement

Conflict of Interest Statement: RA and JW are inventors on 3 patent applications related to this work. The patents have been licensed to a biotech company to promote clinical development of dimeric chloroquine derivatives. RA is a consultant for Presage Biosciences, Sprint Biosciences and Immunaccell, LLC.

Figures

Figure 1:
Figure 1:
DC661 possesses exquisite anti-lysosome activity. (A) Chemical structures of HCQ, Lys05 and DC661. (B) A375P cells were treated with doses shown of HCQ, Lys05, or DC661 for 6 hours before lysates were immunoblotted. (C) A375P cells expressing the mCherry-eGFP-LC3B reporter were treated with HCQ, Lys05, or DC661 (0 – 100 μM, 1 hr) and analyzed by microscopy. (D) A375P cells were treated with HCQ, Lys05, or DC661 (3 μM, 6 hr) and stained with Lysosensor and imaged with fluorescent microscopy. Shown to the right is quantitation. (E) A375P cells were treated with HCQ, Lys05, or DC661 (3 μM, 6 hr) and subsequently stained with galectin-3 and imaged via fluorescent microscopy. Shown to the right is quantitation of Galectin-3+ puncta expressing cells. (F) A375P cells were treated chronically with HCQ, Lys05 or DC661 (0 – 1000 nM, 2 weeks) in a colony formation assay. Cells were subsequently stained with crystal violet and imaged. (G) HT-29 (colorectal cancer) cells were injected into the flanks of NSG mice. Once palpable, mice were treated daily with 3 mg/kg of DC661 or vehicle (water). Tumor volumes are shown. (H) Mean +/− SEM tumor growth rate. All data is representative from at least 2 experiments. * indicates p<0.05. Students T test was used.
Figure 2:
Figure 2:
PPT1 is the unified target of CQ-derivatives. (A) A375P cells were treated with HCQ, Lys05 or DC661 (3 μM, 6 hrs) in media with a pH of 7.4, 6.5, or 6, and lysate was subsequently immunoblotted. (B) A375P cells were treated in an MTT assay with HCQ, Lys05 or DC661 (0 – 3 μM, 72 hrs) in media with a pH of 7.4, 6.5, or 6. (C) Chemical structure of the DC661-photoprobe (DC661-P). Red signifies the chemical warhead, green signifies the photoaffinity label, and blue signifies the desthiobiotin probe. (D) Proteomic results of eluents generated from A375P cells treated with either DC661-P (400 nM) minus UV, DC661-P plus UV, or DC661-P plus UV and plus DC661 competition (4 μM, 1 hr). (E) Lysate from A375P cells treated as described from figure 1D was immunoblotted for PPT1. (F) Chemical structure of the Lys05-photoprobe (Lys05-P). (G) Lysate generated from A375P cells treated with either Lys05-P (400 nM) minus UV, Lys05-P plus UV, or Lys05-P plus UV and plus Lys05 competition (40 μM, 1 hr) was immunoblotted for PPT1. (H) Chemical structure of the CQ-photoprobe (CQ-P). (I) Lysate generated from A375P cells treated with CQ-P (400 nM) minus UV, CQ-P plus UV, or CQ-P plus UV and plus HCQ competition (40 μM, 1 hr) was immunoblotted for PPT1. (J) Differential scanning calorimetry was performed using HCQ+PPT1, Lys05+PPT1, and DC661+PPT1 against apo-PPT1 ligand. (K) PPT1 enzymatic assays were performed in A375P cells treated with HCQ, Lys05, or DC661 (0 – 100 μM, 1 hr). (L) Acyl biotin exchange assays were performed in A375P cells treated with HCQ or DC661 (3 μM, 1 hr). All data is representative of at least 2 experiments. Standard deviation is shown in (B), (J) and (K). * indicates p<0.05. Students T test was used.
Figure 3:
Figure 3:
PPT1 inhibition leads to lysosomal inhibition. (A) A375P cells expressing the mCherry-eGFP-LC3B reporter were treated with HCQ (3 μM, 1 hr), Lys05, (3 μM, 1 hr), or DC661 (3 μM, 1 hr) in the presence or absence of N-tert-Butylhydroxylamine (NTBHA, 2 mM), and subsequently analyzed by microscopy. Shown are quantitation. (B) A375P WT PPT1 or KO PPT1 cells were treated with HDSF (60 μM), HCQ (3 μM), Lys05 (3 μM) or DC661 (3 μM) for 6 hours before being stained with Lysosensor. To the right is quantitation of Lysosensor intensity. (C) A375P WT PPT1 or KO PPT1 cells were treated with HCQ, Lys05, or DC661 (3 μM, 0 – 6 hr). Lysate was immunoblotted (D) A375P WT PPT1 or KO PPT1 cells were treated with HCQ (30 μM), Lys05 (3 μM), or DC661 (1 μM, 72 hrs) and cell numbers were quantified as shown. (E) B16 WT Ppt1 or KO Ppt1 cells were treated with HCQ, Lys05, or DC661 (3 μM, 1 hr). Lysate was immunoblotted. (F) Proximity ligation assay for the p18 (Ragulator) – V1A (vATPase subunit) interaction in WT PPT1 and KO PPT1 cells. Shown below is quantitation. (G) Proximity ligation assay for the mTOR – Rheb interaction in WT PPT1 and KO PPT1 cells. Shown below is quantitation. (H) Membrane fractions generated from WT PPT1 and KO PPT1 cells were subsequently immunoblotted. All data is representative of at least 2 experiments. Standard deviation is shown in (D), (F), and (G). * indicates p<0.05. Students T test was used.
Figure 4:
Figure 4:
PPT1 expression is correlated with poorer patient survival. (A) WT PPT1 or KO PPT1 cells (1 × 10⁶ cells/mouse were injected into the flanks of NSG mice (n=5, each arm). Tumor volumes were measured every three days as shown. (B) Mean +/− SEM daily tumor growth rate. (C) Lysate generated from WT PPT1 or KO PPT1 cells grown in vivo were immunoblotted. (D) PPT1 expression (TCGA) in unpaired normal (symbol: triangles) and tumor samples (symbol: stars) for the following cancers: BRCA: breast cancer; KIRC: clear cell renal cell carcinoma; THCA: thyroid cancer; HNSC: head and neck squamous cell carcinoma; ESCA: esophageal cancer; STAD: gastric cancer; LIHC: hepatocellular carcinoma; KIRP: Papillary renal cell carcinoma; COAD: colon cancer; BLCA: bladder cancer; PRAD: prostate adenocarcinoma; LUSC: non-small cell lung cancer squamous cell; LUAD: non-small cell lung cancer adenocarcinoma. Mean +/− SEM is presented; *p<0.05 paired t-test. (E) PPT1 expression (TCGA RNAseqV2) in primary versus metastatic melanoma tumor samples. PPT1 values less than the 30th percentile were classified as low and values greater than the 70th percentile were classified as low. (F-I) Kaplan-Meier survival curves were computed for medium/high versus low or high versus medium/low expression of PPT1 in TCGA patients with complete RNASeqV2 expression data as well as overall survival information. Hazard ratio with 95% confidence interval and associated p-value are from a Cox regression analysis. (F) esophageal cancer, (G) hepatocellular carcinoma, (H) clear cell renal cell carcinoma, (I) head and neck cancer. Low, medium and high was defined based on tertiles for PPT1.

References

    1. Settembre C, Zoncu R, Medina DL, Vetrini F, Erdin S, Erdin S, et al. A lysosome-to-nucleus signalling mechanism senses and regulates the lysosome via mTOR and TFEB. The EMBO journal. 2012;31:1095–108. - PMC - PubMed
    1. Perera RM, Stoykova S, Nicolay BN, Ross KN, Fitamant J, Boukhali M, et al. Transcriptional control of autophagy-lysosome function drives pancreatic cancer metabolism. Nature. 2015;524:361–5. - PMC - PubMed
    1. Mahalingam D, Mita M, Sarantopoulos J, Wood L, Amaravadi RK, Davis LE, et al. Combined autophagy and HDAC inhibition: a phase I safety, tolerability, pharmacokinetic, and pharmacodynamic analysis of hydroxychloroquine in combination with the HDAC inhibitor vorinostat in patients with advanced solid tumors. Autophagy. 2014;10:1403–14. - PMC - PubMed
    1. Rangwala R, Chang YC, Hu J, Algazy KM, Evans TL, Fecher LA, et al. Combined MTOR and autophagy inhibition: phase I trial of hydroxychloroquine and temsirolimus in patients with advanced solid tumors and melanoma. Autophagy. 2014;10:1391–402. - PMC - PubMed
    1. Barnard RA, Wittenburg LA, Amaravadi RK, Gustafson DL, Thorburn A, Thamm DH. Phase I clinical trial and pharmacodynamic evaluation of combination hydroxychloroquine and doxorubicin treatment in pet dogs treated for spontaneously occurring lymphoma. Autophagy. 2014;10:1415–25. - PMC - PubMed

Publication types

MeSH terms