

Data-Driven Gross Patient Motion Detection and Compensation: Implications for Coronary 18F-NaF PET Imaging
- PMID: 30442755
- PMCID: PMC6581232
- DOI: 10.2967/jnumed.118.217877
Data-Driven Gross Patient Motion Detection and Compensation: Implications for Coronary 18F-NaF PET Imaging
Abstract
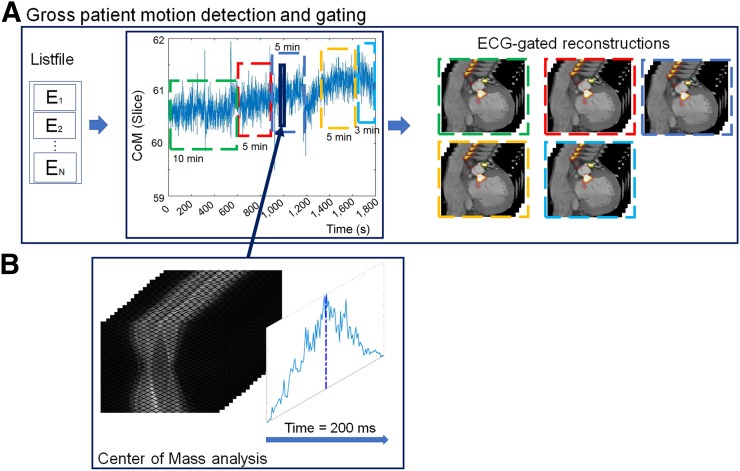
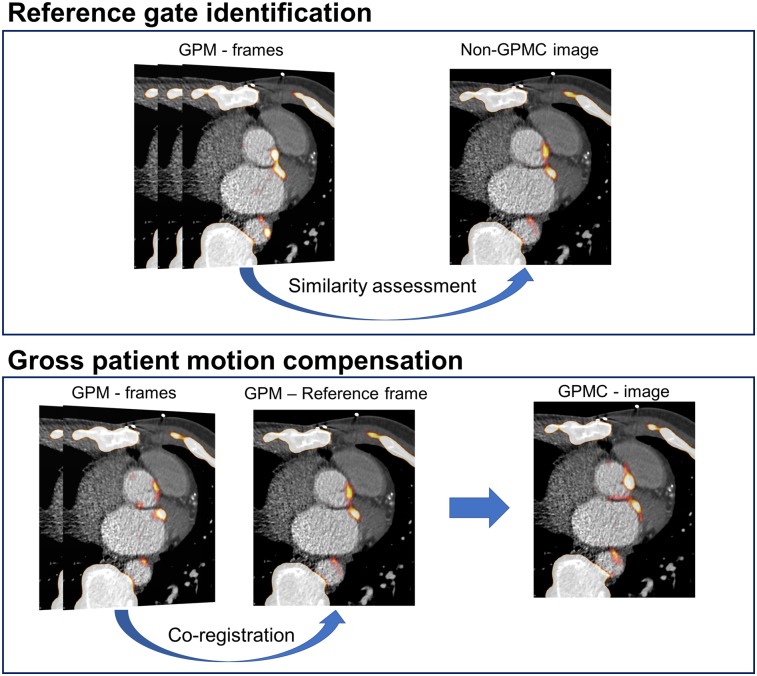
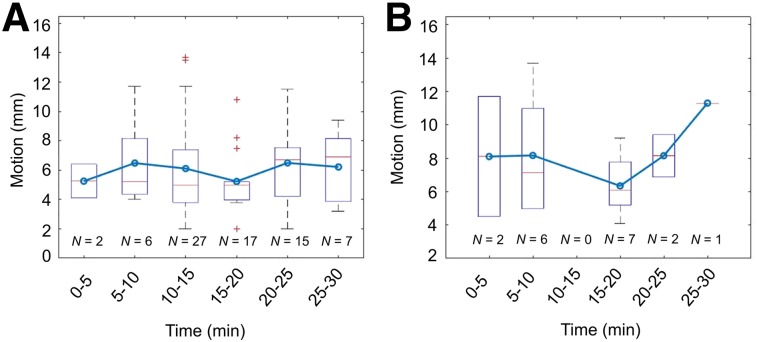
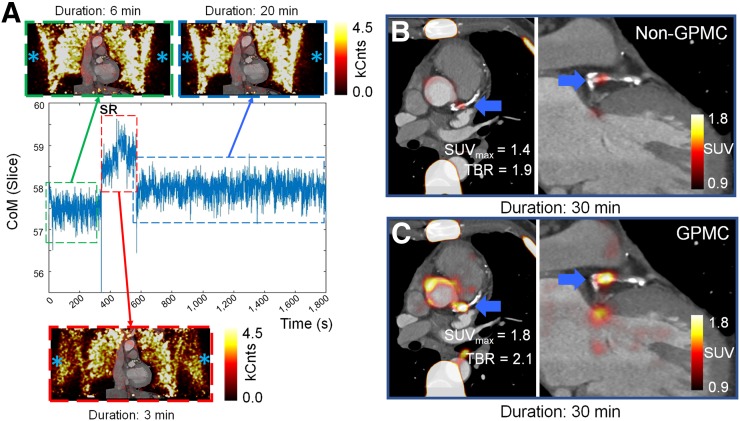
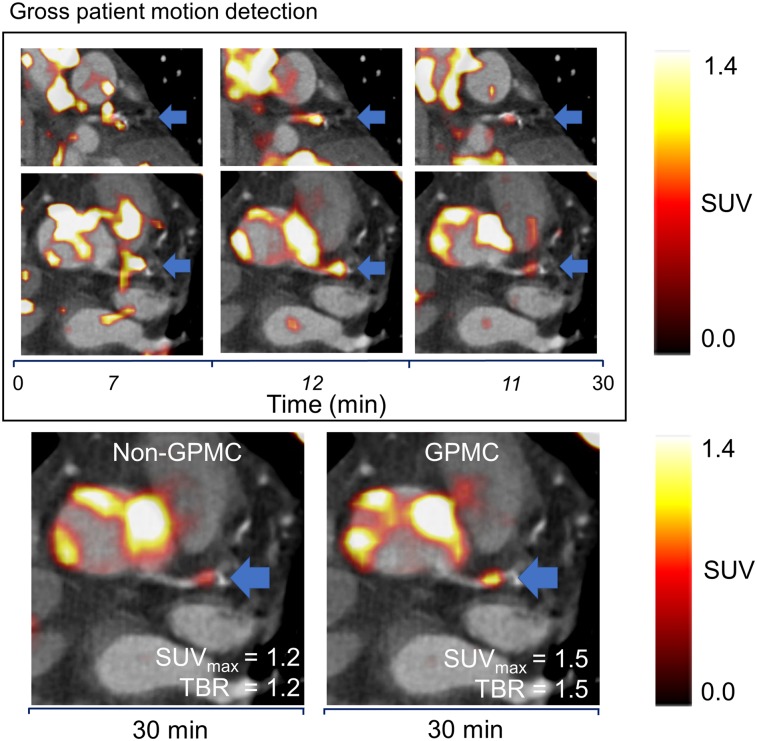
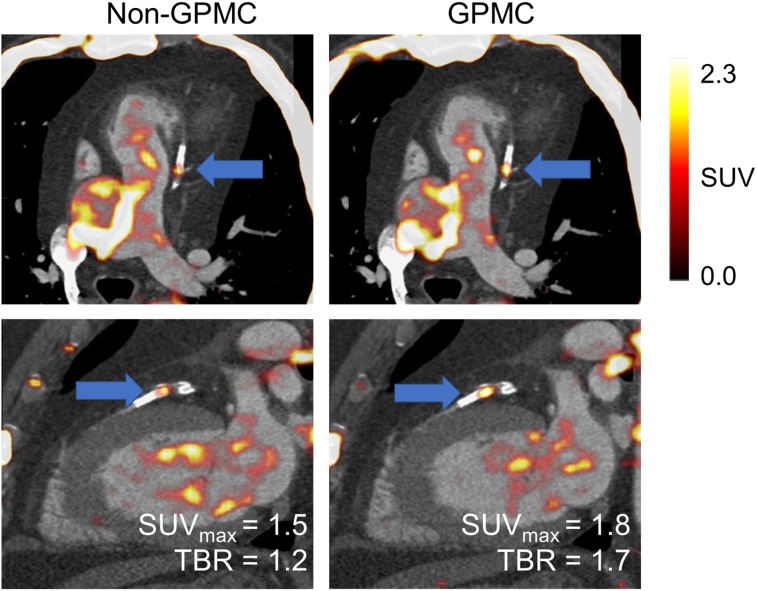
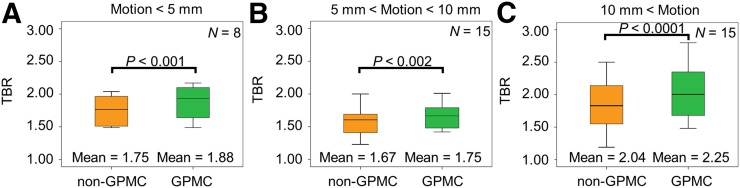
Patient motion degrades image quality, affecting the quantitative assessment of PET images. This problem affects studies of coronary lesions in which microcalcification processes are targeted. Coronary PET imaging protocols require scans of up to 30 min, introducing the risk of gross patient motion (GPM) during the acquisition. Here, we investigate the feasibility of an automated data-driven method for the detection of GPM during PET acquisition. Methods: Twenty-eight patients with stable coronary disease underwent a 30-min PET acquisition 1 h after the injection of 18F-sodium fluoride (18F-NaF) at 248 ± 10 MBq (mean ± SD) and then a coronary CT angiography scan. An automated data-driven GPM detection technique tracking the center of mass of the count rates for every 200 ms in the PET list-mode data was devised and evaluated. Two patient motion patterns were considered: sudden repositioning (motion of >0.5 mm within 3 s) and general repositioning (motion of >0.3 mm over 15 s or more). After the reconstruction of diastolic images, individual GPM frames with focal coronary uptake were coregistered in 3 dimensions, creating a GPM-compensated (GPMC) image series. Lesion motion was reported for all lesions with focal uptake. Relative differences in SUVmax and target-to-background ratio (TBR) between GPMC and non-GPMC (standard electrocardiogram-gated data) diastolic PET images were compared in 3 separate groups defined by the maximum motion observed in the lesion (<5, 5-10, and >10 mm). Results: A total of 35 18F-NaF-avid lesions were identified in 28 patients. An average of 3.5 ± 1.5 GPM frames were considered for each patient, resulting in an average frame duration of 7 ± 4 (range, 3-21) min. The mean per-patient motion was: 7 ± 3 mm (maximum, 13.7 mm). GPM correction increased SUVmax and TBR in all lesions with greater than 5 mm of motion. In lesions with 5-10 mm of motion (n = 15), SUVmax and TBR increased by 4.6% ± 5.6% (P = 0.02) and 5.8% ± 6.4% (P < 0.002), respectively. In lesions with greater than 10 mm of motion (n = 15), the SUVmax and TBR increased by 5.0% ± 5.3% (P = 0.009) and 11.5% ± 10.1% (P = 0.001), respectively. GPM correction led to the diagnostic reclassification of 3 patients (11%). Conclusion: GPM during coronary 18F-NaF PET imaging is common and may affect quantitative accuracy. Automated retrospective compensation of this motion is feasible and should be considered for coronary PET imaging.
Keywords: PET/CT; cardiac PET; data-driven motion detection; motion compensation.
© 2019 by the Society of Nuclear Medicine and Molecular Imaging.
Figures
References
-
- Büther F, Dawood M, Stegger L, et al. List mode-driven cardiac and respiratory gating in PET. J Nucl Med. 2009;50:674–681. - PubMed
-
- Polycarpou I, Tsoumpas C, Marsden PK. Analysis and comparison of two methods for motion correction in PET imaging. Med Phys. 2012;39:6474–6483. - PubMed
-
- Slomka PJ, Rubeaux M, Le Meunier L, et al. Dual-gated motion-frozen cardiac PET with Flurpiridaz F 18. J Nucl Med. 2015;56:1876–1881. - PubMed
-
- Feng T, Wang J, Fung G, Tsui B. Non-rigid dual respiratory and cardiac motion correction methods after, during, and before image reconstruction for 4D cardiac PET. Phys Med Biol. 2016;61:151–168. - PubMed