. 2018 Dec 7;362(6419):1171-1177.
doi: 10.1126/science.aap8210. Epub 2018 Nov 15.

LZTR1 is a regulator of RAS ubiquitination and signaling

Affiliations

LZTR1 is a regulator of RAS ubiquitination and signaling

Johannes W Bigenzahn et al. Science. .

Abstract

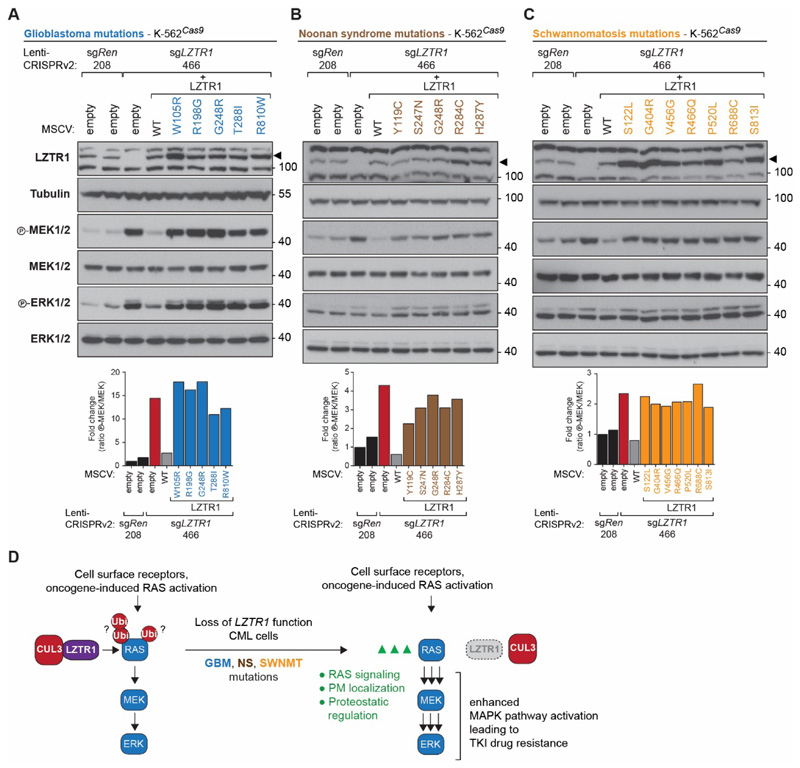
In genetic screens aimed at understanding drug resistance mechanisms in chronic myeloid leukemia cells, inactivation of the cullin 3 adapter protein-encoding leucine zipper-like transcription regulator 1 (LZTR1) gene led to enhanced mitogen-activated protein kinase (MAPK) pathway activity and reduced sensitivity to tyrosine kinase inhibitors. Knockdown of the Drosophila LZTR1 ortholog CG3711 resulted in a Ras-dependent gain-of-function phenotype. Endogenous human LZTR1 associates with the main RAS isoforms. Inactivation of LZTR1 led to decreased ubiquitination and enhanced plasma membrane localization of endogenous KRAS (V-Ki-ras2 Kirsten rat sarcoma viral oncogene homolog). We propose that LZTR1 acts as a conserved regulator of RAS ubiquitination and MAPK pathway activation. Because LZTR1 disease mutations failed to revert loss-of-function phenotypes, our findings provide a molecular rationale for LZTR1 involvement in a variety of inherited and acquired human disorders.


Conflict of interest statement

Competing financial interests:

The authors declare no competing financial interest.

Figures

Figure 1
Figure 1. Haploid genetic screens identify gene knockouts promoting BCR-ABL inhibitor resistance.
(A) Circos plot of the haploid genetic screen in the CML cell line KBM-7 upon treatment with ponatinib. Each dot represents a mutagenized gene identified in the resistant cell population, the dot size corresponds to the number of independent insertions identified per gene and the distance from the circos plot center indicates the significance of enrichment compared to an unselected control data set. Hits with a false discovery rate (FDR) adjusted P-value lower than 10-4 are labeled by gene name. (B) Bubble plot depicting the “TOP6” set of genes identified in four or more of the six haploid screens upon treatment with 1st, 2nd and 3rd generation BCR-ABL inhibitors. The size of each bubble corresponds to the number of independent insertions per gene and the color gradient depicts the FDR adjusted P-value of enrichment significance. (C) Multi-color competition assay (MCA)-derived fold change of cell populations after imatinib treatment of KBM-7Cas9 CML cells transduced with sgRNAs targeting the “TOP6” genes or sgRen.208 (targeting Renilla luciferase) as negative control. sgRNA-infected cell populations were mixed in a 1:1 ratio, treated with increasing drug concentrations and analyzed by flow cytometry after 14 days. Data are shown as mean value ± s.d. of at least two independent experiments (n ≥ 2) performed in duplicates. sgRNAs are labeled by gene name followed by the genomic targeting sequence position numbered according to the sequence position on the corresponding mRNA.
Figure 2
Figure 2. Loss of LZTR1 enhances MAPK pathway activation.
(A) Phosphorylation of MEK and ERK in KBM-7Cas9 and K-562Cas9 CML cells transduced with the indicated sgRNAs. (B) Immunoblot analysis of MEK and ERK phosphorylation as well as LZTR1 expression in sgRen.208-expressing K-562Cas9 CML cells transduced with empty vector, and sgLZTR1.466-expressing cells transduced with empty vector or LZTR1-cDNA-containing MSCV retrovirus. Quantification of MEK and ERK phosphorylation is shown next to the corresponding immunoblots. (C) Competitive proliferation assay (MCA) of K-562Cas9 sgRen.208 cells transduced with empty vector and sgLZTR1.466 cells transduced with empty vector or LZTR1 cDNA after treatment with increasing concentrations of imatinib for 14 days. (D) Phosphorylation of MEK and ERK in K-562Cas9 cells expressing sgLZTR1.466 and treated with increasing concentrations of trametinib for 3 hours. (E) Changes in cell populations measured by MCA of K-562Cas9 CML cells expressing sgRen.208 or sgLZTR1.466 after 14 days of treatment with increasing concentrations of imatinib alone or in combination with trametinib. Immunoblot results in (A, B and D) are representative of at least two independent biological experiments (n ≥ 2). MCA data in (C, E) are shown as mean value ± s.d. of at least two independent experiments (n ≥ 2). DMSO treatment served as negative control.
Figure 3
Figure 3. LZTR1 modulates MAPK pathway activation through RAS regulation.
(A) Morphology of adult wings from act5C-Gal4, UAS-wIR (act>wIR for short) and act>CG3711IR #1 RNAi fly lines. (B) Quantification of act>wIR and act>CG3711IR RNAi lines as percentage of wings with ectopic wing vein formation. P-value for RNAi #1 and #3 in the wing is <0.0001 (****) and for #2 is 0.0255. (C) Quantification of act>wIR and act>CG3711IR RNAi lines alone or in a Rase2F/+ background as percentage of wings with ectopic wing vein formation. For statistical assessment, partial extra vein and extra vein formation have been combined. P-value for both RNAi line comparisons in the wing is <0.0001 (****). (D) FLAG immunoprecipitates (IP) and whole cell extracts (WCE) from K-562rtTA3 cells expressing FLAG-BirA* tagged GFP or KRAS4A WT, ΔHVR, C180S or C186S after 48 hours of doxycycline treatment were immunoblotted for the indicated proteins. (E) Confocal microscopy of HAP1 WT cells and HAP1 cells with endogenously FLAG-tagged KRAS transduced with sgRen.208, sgLZTR1.620, sgLZTR1.466, sgCUL3.852 or sgCUL3.1396 and stained with anti-FLAG. Scale bar in all panels is 10μm. (G) Tandem ubiquitin binding domain (TUBE)-based purifications of ubiquitinated proteins and whole cell extracts (WCE) from HAP1 WT and endogenously FLAG-tagged KRAS cells transduced with sgRen.208 or sgLZTR1.466 were analyzed by immunoblotting with the indicated antibodies. WT, wild type.
Figure 4
Figure 4. LZTR1 disease missense mutations fail to rescue the loss-of-function phenotype.
(A-C) Immunoblotting for MEK and ERK phosphorylation as well as LZTR1 expression of K-562Cas9 sgRen.208-expressing cells retrovirally transduced with empty vector, and sgLZTR1.466-expressing cells transduced with either empty vector, LZTR1 WT, or LZTR1 mutations identified in GBM (blue) (A), NS (brown) (B), or SWNMT (orange) (C). The LZTR1 G248R mutation has been identified in both GBM and NS. Immunoblot results are representative of at least two independent biological experiments (n ≥ 2) and quantification of MEK phosphorylation in the displayed blots is shown. (D) Mechanistic model of CUL3-LZTR1-mediated RAS ubiquitination and enhanced MAPK pathway activation and BCR-ABL inhibitor drug resistance induced by loss of LZTR1 function.

Comment in

  • Ras tuning.
    Miura G. Miura G. Nat Chem Biol. 2019 Feb;15(2):95. doi: 10.1038/s41589-018-0219-9. Nat Chem Biol. 2019. PMID: 30659296 No abstract available.

Similar articles

Cited by

References

    1. Ren R. Mechanisms of BCR–ABL in the pathogenesis of chronic myelogenous leukaemia. Nat Rev Cancer. 2005;5:172–183. - PubMed
    1. O'Hare T, Zabriskie MS, Eiring AM, Deininger MW. Pushing the limits of targeted therapy in chronic myeloid leukaemia. Nat Rev Cancer. 2012;12:513–526. - PubMed
    1. Carette JE, et al. Global gene disruption in human cells to assign genes to phenotypes by deep sequencing. Nature Biotechnology. 2011;29:1–7. - PMC - PubMed
    1. Simanshu DK, Nissley DV, McCormick F. RAS Proteins and Their Regulators in Human Disease. Cell. 2017;170:17–33. - PMC - PubMed
    1. Yamamoto GL, et al. Rare variants in SOS2 and LZTR1 are associated with Noonan syndrome. J Med Genet. 2015;52:413–421. - PubMed

Publication types

MeSH terms