

Downregulation of basal myosin-II is required for cell shape changes and tissue invagination
- PMID: 30442834
- PMCID: PMC6276876
- DOI: 10.15252/embj.2018100170
Downregulation of basal myosin-II is required for cell shape changes and tissue invagination
Abstract
Tissue invagination drives embryo remodeling and assembly of internal organs during animal development. While the role of actomyosin-mediated apical constriction in initiating inward folding is well established, computational models suggest relaxation of the basal surface as an additional requirement. However, the lack of genetic mutations interfering specifically with basal relaxation has made it difficult to test its requirement during invagination so far. Here we use optogenetics to quantitatively control myosin-II levels at the basal surface of invaginating cells during Drosophila gastrulation. We show that while basal myosin-II is lost progressively during ventral furrow formation, optogenetics allows the maintenance of pre-invagination levels over time. Quantitative imaging demonstrates that optogenetic activation prior to tissue bending slows down cell elongation and blocks invagination. Activation after cell elongation and tissue bending has initiated inhibits cell shortening and folding of the furrow into a tube-like structure. Collectively, these data demonstrate the requirement of myosin-II polarization and basal relaxation throughout the entire invagination process.
Keywords: basal surface; cell shape changes; myosin‐II; optogenetics; tissue invagination.
© 2018 European Molecular Biology Laboratory. Published under the terms of the CC BY 4.0 license.
Figures
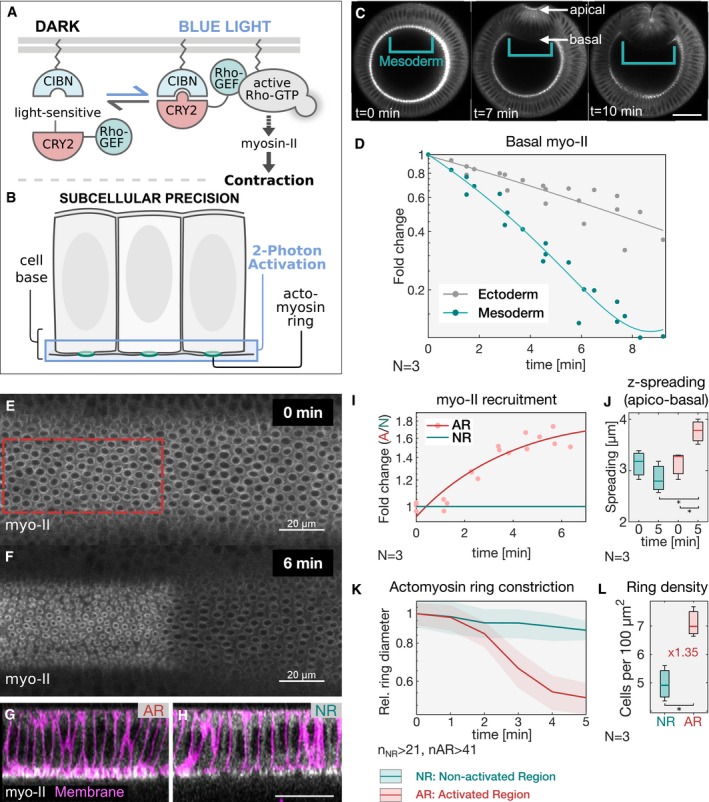
- A
Schematic representation of the RhoGEF2‐CRY2/CIBN optogenetic system employed to control myosin‐II activity during early Drosophila embryogenesis. The photosensitive domain of CRY2 is fused to the catalytic domain of the GTP Exchange factor RhoGEF2, while CIBN is anchored at the plasma membrane. In the dark, RhoGEF2‐CRY2 is present in the cytoplasm (left). Blue light illumination triggers the CRY2/CIBN interaction and causes the translocation of RhoGEF2‐CRY2 to the plasma membrane, where it activates endogenous Rho1 signaling (right), and myosin‐II.
- B
Multiphoton microscopy (λ = 950 nm) enables the selective illumination of the basal surface of the cells at a tissue depth > 30 μm with subcellular precision.
- C
Still frames from time‐lapse recordings of an embryo expressing a myosin‐II probe (Sqh::GFP). Embryos were mounted vertically to image the transverse cross section using two‐photon microscopy. At the onset of gastrulation, myosin‐II localized to ring structures representing the leading edge of the cellularization front (lower arrow). During ventral furrow formation (torques open rectangle), myosin‐II accumulated at the apical side (upper arrow) of the cells that invaginate and the basal pool was progressively depleted. Scale bar, 40 μm.
- D
Quantification of basal myosin‐II levels (N = 3 embryos) in ectodermal and mesodermal cells. In the mesoderm, basal myosin‐II levels decreased 5‐fold over the course of internalization, while in the ectoderm only ˜3‐fold. Additionally, myosin‐II depletion appeared to be accelerated in the mesodermal cells as indicated by the steeper slope of the polynomial fit (3rd degree with r 2 Ectoderm: 0.98 and r 2 Mesoderm: 0.87). Note the logarithmic y‐axis.
- E–H
Embryos at the end of cellularization co‐expressing RhoGEF2‐CRY2, CIBN::pmGFP, and Sqh::mCherry were mounted with the dorsal epithelium facing the objective, and a region of interest (red dashed line) was defined to specifically illuminate the cell base using two‐photon microscopy. A representative embryo (N = 3) showing basal myosin‐II from top view (sum‐of‐slice projection of 6 focal planes) at the initial stage of the experiment (E) and 6 min after activation (F). Z‐projection of the same embryo showing the cross section of the activated region (AR) (G) and non‐activated region (NR) (H) with the superimposed plasma membrane signal (CIBN::GFPpm in magenta) recorded immediately after the final Sqh::mCherry acquisition (displayed in white). The contrast has been adjusted to better visualize the distribution of myosin‐II along the apico‐basal axis in the respective area of the tissue. Scale bars, 20 μm.
- I
Quantification of myosin‐II levels (N = 3) within the region of activation (AR, red) relative to the non‐activated region (NR, green) over the course of 6 min. The y‐axis represents the fold change of myosin‐II signal intensity in the activated region versus non‐activated region. A polynomial function (2nd degree, r 2 AR = 0.88) was fitted to the data (straight line) indicating the level of saturation that is reached at about 1.6‐fold change of myosin‐II in the activated area after 6 min.
- J
Analysis of the extent of signal spreading in the z‐dimension (apico‐basal) of basal myosin‐II. Myosin‐II signal intensity was plotted along the apico‐basal axis and a Gaussian curve fitted to the basal peak. The width of the Gaussian fit was used as a parameter to estimate myosin‐II signal spreading in the z‐dimension, which was limited to 4 μm (N = 3). In each box plot, the central mark, the bottom, and the top edge of each box indicate the median, the 25th percentile, and 75th percentile, respectively. Whiskers extent to the most extreme data point.
- K
Quantification of the diameter of basal actomyosin rings in the non‐activated region (NR, green) and activated region (AR, red) showing increased speed (4.8‐fold change) and extent of ring constrictions in the photo‐activated region (n = > 41 cells). The ring diameter was normalized to the mean value of the first time point. The constriction speed was estimated by the slope of a fitted linear function to the data.
- L
Light activation of the cell base resulted in a compaction of the tissue in the activated (AR) compared to the non‐activated region (NR). Actomyosin rings were counted and normalized to the analyzed area to score ring density, which increased 1.35 times in the activated region after 5 min of photo‐activation, showing that cells were still interconnected at the base and that photo‐activation did not affect tissue integrity (N = 3 embryos; n NR: 431, n AR: 302). In each box plot, the central mark, the bottom, and the top edge of each box indicate the median, the 25th percentile, and 75th percentile, respectively. Whiskers extent to the most extreme data point.
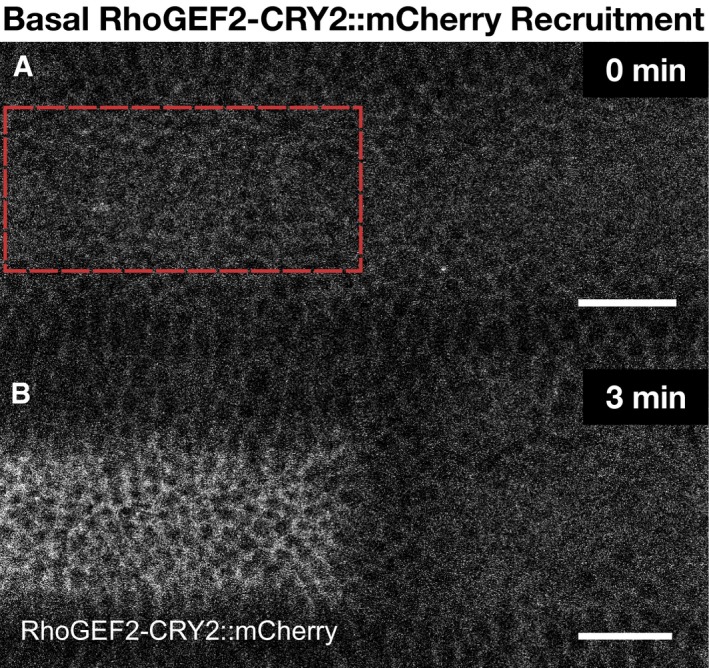
- A, B
Embryos co‐expressing CIBN::GFPpm and RhoGEF2‐CRY2::mCherry were mounted with their dorsal epithelium facing the objective, and a region of interest (red dashed line) (A) was defined to specifically illuminate the cell base at ˜25 μm from the apical surface in a subset of the embryonic tissue using two‐photon microscopy. A representative experiment showing RhoGEF2‐CRY2::mCherry from top view (sum‐of‐slice projection of 5 focal planes) at the initial stage of the experiment (A) and 3 min after activation (B). RhoGEF2‐CRY2::mCherry localized to the cytoplasm before activation and was specifically recruited to the plasma membrane upon light activation. Scale bar, 20 μm.
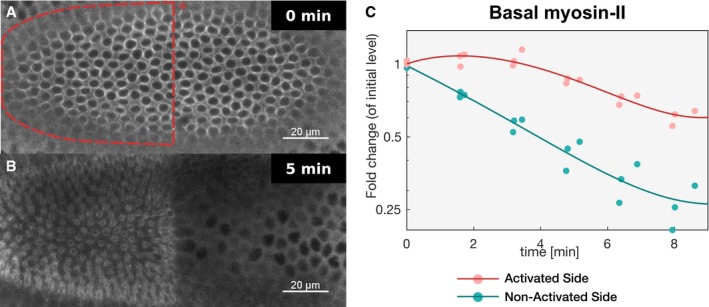
- A, B
Embryos co‐expressing CIBN::GFPpm/RhoGEF2‐CRY2 and the myosin‐II probe Sqh::mCherry were mounted with the ventral tissue facing the objective, and a region of interest (red dashed line) (A) was defined to specifically illuminate the cell base at ˜25 μm from the apical surface in a subset of the embryonic tissue using two‐photon microscopy. Note that due to the curvature of the embryo, a half‐elliptic region of activation was defined to avoid activation of adjacent lateral cells. A representative experiment (N = 8) showing basal Sqh::mCherry from top view (sum‐of‐slice projection of 5 focal planes) at the beginning of the experiment (A) and 5 min after activation (B). Sqh::mCherry levels were stabilized in the region of activation while dropped in the non‐activated tissue.
- C
Quantification of myosin‐II levels (N = 3) in the activated region (red) and non‐activated region (green). While myosin‐II levels progressively decreased in the non‐activated region, myosin‐II depletion slowed down in the activated region. The straight line indicates a polynomial fit (3rd degree) to the respective data (r 2 = 0.91 for the activated region and r 2 = 0.97 for the non‐activated region). Note the logarithmic y‐axis scale.
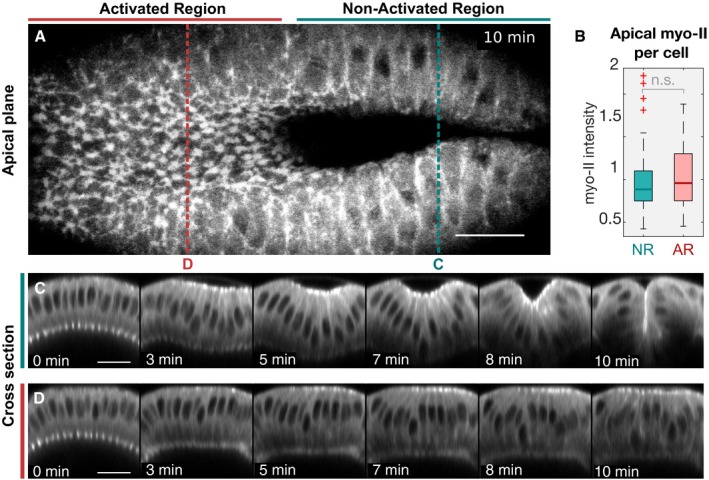
- A
Top view showing apical myosin‐II 10 min after the initial activation. While cells in the non‐activated region have internalized and disappeared from the apical focal planes (right), cells in the activated region failed to internalize despite showing myosin‐II accumulation at the apical surface (left). Red and blue dotted lines indicate the location of the cross‐sectional panels displayed in (C) and (D).
- B
Quantification of apical myosin‐II levels demonstrates that the defects in tissue invagination were not due to impaired apical myosin‐II accumulation as the average apical myosin‐II level per cell did not significantly differ between the non‐activated (NR) and activated region (AR). The intensity values were normalized using the median value of the combined cell population in the NR and AR (N = 3 embryos; n NR: 94, n AR: 78). Significances (by two‐sample t‐test): n.s. indicates no statistically significant differences. In each box plot, the central mark, the bottom, and the top edge of each box indicate the median, the 25th percentile, and 75th percentile, respectively. Whiskers extent to the most extreme data point and the “+” symbol indicates an outlier.
- C, D
z‐projections (transverse cross section) of myosin‐II time‐lapse recordings of the non‐activated (C) and activated region (D). While cells in the non‐activated region internalized, resulting in a complete closure of the furrow (C), stabilization of basal myosin‐II levels prevented invagination (D). Scale bars, 20 μm.
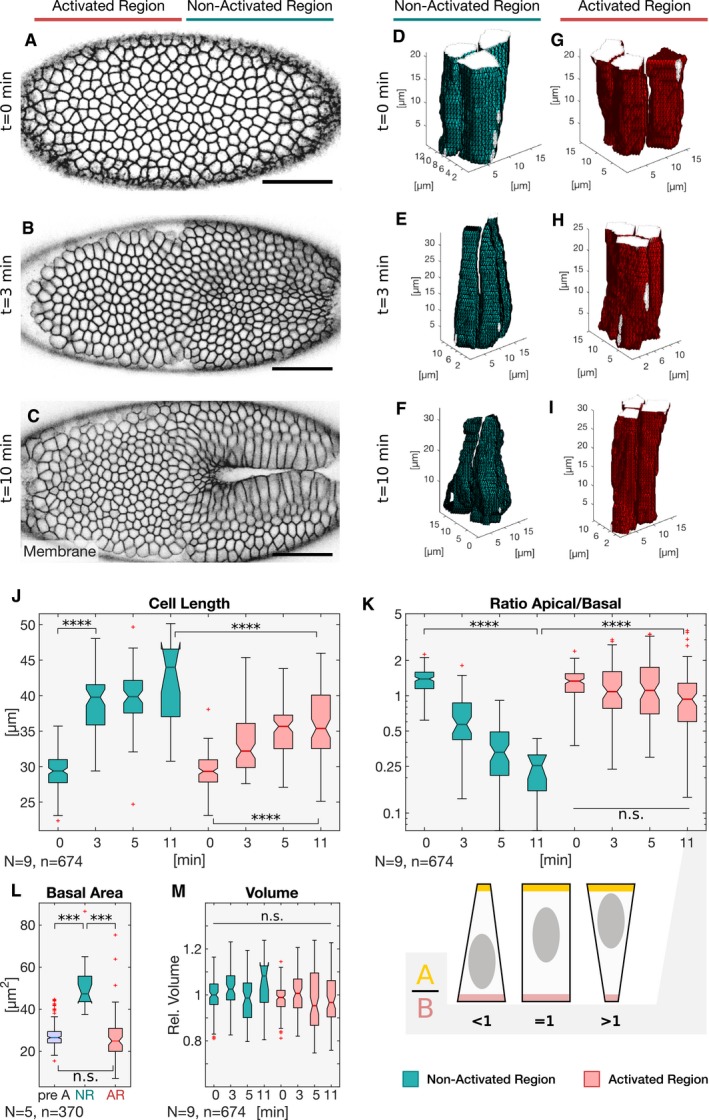
- A–C
Embryos co‐expressing the optogenetic module and Sqh::mCherry mounted with the ventral epithelium facing the objective were subjected to cycles of photo‐activation of the cell base in the anterior (left) half of the embryo and confocal recording of the whole embryo. The experiment was started at the end of cellularization when initial accumulation of apical myosin‐II was detected and terminated at different time points to record the plasma membrane signal (CIBN::GFPpm) in the whole embryo using two‐photon illumination. Still frames visualizing the plasma membrane (CIBN::GFPpm) at a sub‐apical plane at the initial time point of the experiment (A), 3 min (B), and 10 min (C) after initial photo‐activation.
- D–I
The CIBN::GFPpm signal was used to reconstruct cell shape in 3D as described in the Materials and Methods. Representative examples (18 ≤ n ≤ 136) of reconstructed cell shapes in the non‐activated region at the initial time point (D), 3 min (E), and 10 min (F) after photo‐activation show that the cells undergo apical constriction and the characteristic transition from a columnar to a conic shape. In contrast, representative examples (83 ≤ n ≤ 133) of reconstructed cell shapes in the activated region at the initial time point (G), 3 min (H), and 10 min (I) reveal that photo‐activated cells did not undergo stereotypic cell shape changes and remain columnar.
- J–M
Based on the reconstructed cell shapes in the non‐activated (green) and activated region (red), cell length (J), apical/basal ratio (K), basal area (L), and volume (M) were quantified at different times after initial photo‐activation of the cell base. (J) While cells in the non‐activated region elongated from ˜25 to ˜40 μm, cells in the activated region showed impaired cell lengthening, both in terms of final cell length (< 40 μm) and elongation speed. ANOVA result: F(7, 666) = 117.9, P = 3.8e‐112. Cohen's D > 0.87 between NR and AR (excluding t = 0 min). (K) The apical/basal (A/B) ratio is a parameter describing cell shape that corresponds to the ratio of the most apical volume divided by the most basal volume. A ratio of 1 indicates a columnar shape, a ratio < 1 indicates a conic shape, and a high ratio > 1 indicates an inverted conic shape with an apical surface that is bigger than the basal surface. In the non‐activated region, the A/B ratio decreased from ˜1 at the initial time point to 0.5. In the activated region, the A/B ratio spread around a value of ˜ 1 indicating persisting columnar cell shape. After 10 min of photo‐activation, the A/B ratio showed higher variance, spreading between ˜0.5 and ˜4.5 indicating the co‐existence of cells acquiring different cell shapes. There were no statistically significant differences between group means within the activated cell dataset as determined by one‐way ANOVA (F(3, 384) = 1.617, P = 0.18). The cartoon illustrates the cell shapes represented by different A/B ratios. ANOVA result (all datapoints): F(7, 666) = 44.95, P = 4e‐52. Cohen's D > 0.73 between NR and AR (excluding t = 0 min). (L) The basal cell area of 27 μm pre‐activation (pre A; t = 0 min) increased to 50 μm in the non‐activated region (NR), while it remained constant in the activated region (AR) after 11 min. (M) Cell volume is conserved in the non‐activated and activated region. Cell volume was normalized to the mean of all samples. A one‐way ANOVA test was performed (F(7, 666) = 3.34, P = 0.0017) followed by a post hoc Tukey's test and Cohen's D test (d < 0.5) both revealing no significant difference between any sample pair. (J–M) The central mark, the bottom, and the top edge of each box indicate the median, the 25th percentile, and 75th percentile, respectively. Whiskers extent to the most extreme data point, and the “+” symbol indicates an outlier. Notches indicate comparison intervals. Between n NR:11 min = 18 and n NR:0 min = 136 cells per sample with a total number of n total = 674 cells from at least two embryos per sample and altogether 9 embryos were analyzed. In all panels, ****P ≤ 0.0001, ***P ≤ 0.001, and n.s. indicates no statistically significant differences according to two‐sample t‐test.
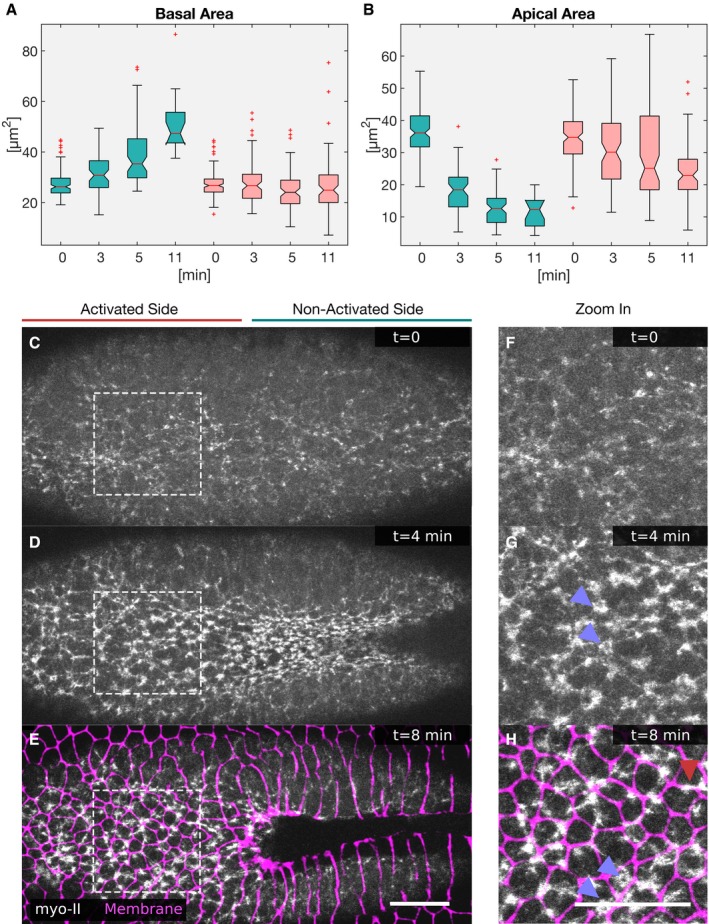
- A, B
Cells were photo‐activated at the cell base, and the cell shapes reconstructed to extract and quantify specific features. (A) The basal surface increased in the non‐activated region and was kept constant in the activated region. (B) While in the non‐activated region the apical area decreased progressively, apical constriction was inhibited in the activated region (red). In each box plot, the central mark, the bottom, and the top edge of each box indicate the median, the 25th percentile, and 75th percentile, respectively. Whiskers extent to the most extreme data point, and the “+” symbol indicates an outlier. Notches indicate comparison intervals.
- C–H
Drosophila embryos expressing the optogenetic module CIBN::GFPpm/RhoGEF2‐CRY2 and the myosin‐II probe Sqh::mCherry were mounted with the ventral tissue facing the objective. The anterior half of the embryo was activated at the cell base, and the Sqh::mCherry signal was recorded in a 5‐μm‐sized image stack. Top view showing apical myosin‐II distribution at the initial time point (C), 4 min (D), and 8 min (E) after initial activation. (F–H) Apical myosin‐II distribution in the activated region at the initial time point (F), 4 min (G), and 8 min (H) after initial activation in high magnification of the regions indicated by white dashed square in (C–E). Myosin‐II accumulated in both the non‐activated and activated region. (G–H) In the activated region, myosin‐II accumulated in the center of the cells, in stable ring‐like structures (blue arrowheads), or to cell junctions (red arrowhead). (E–H) Immediately after the final Sqh::mCherry acquisition, the plasma membrane signal (CIBN::GFPpm, in magenta) was recorded and superimposed to the myosin‐II signal. Scale bars, 25 μm.
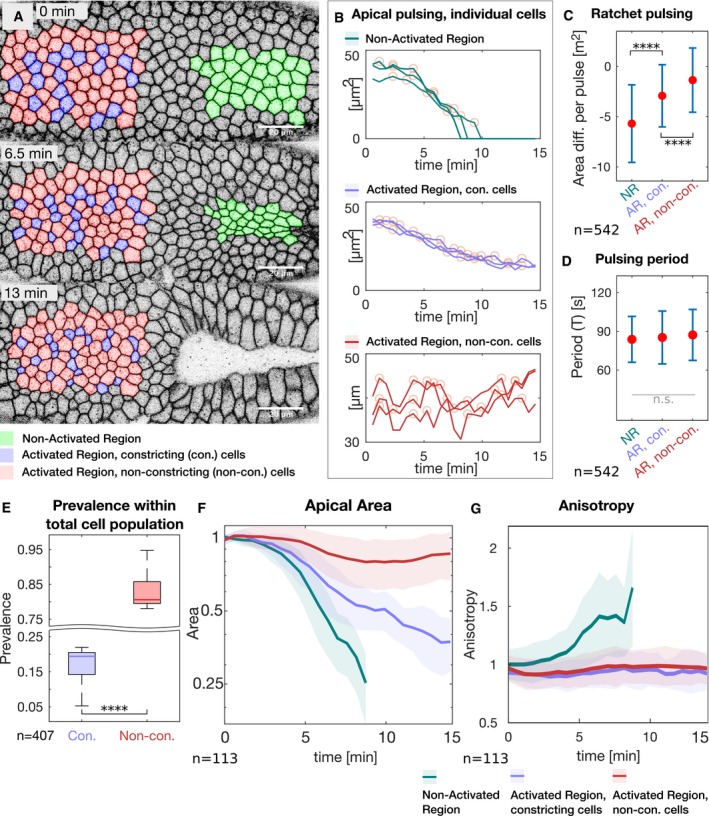
- A
Still frames of the time‐lapse membrane (GAP43::mCherry) recording are shown at the initial time point (top), after 6.5 min (middle), and after 13 min (bottom) of photo‐activation. Cells in the non‐activated region (green) underwent normal apical constriction. In the activated region, two populations of cells were observed, one that constricted (purple) and one that did not constrict (red). Cells in the activated region that by the end of the experiment constricted to an area smaller than half of their initial area are considered as constricting cells. Cells that constricted less were considered to be defective in apical constriction and are referred to as non‐constricting. Scale bar, 20 μm.
- B
All cells show pulsatile behavior. Graphs illustrate the area of three representative cells in each category (non‐activated region: top; activated region with constricting cells: middle; activated region with non‐constricting cells: bottom) over the course of one experiment. Yellow circles indicate the position of automatically identified local maxima used for further analyses.
- C, D
(C) Diagram showing the extent of ratchet‐like constrictions. The mean difference in apical area between adjacent peaks (relaxed cell surface) is indicated by a red dot and reflects the extent to which cells shrink in a single pulse. Cells in the non‐activated region (NR) constricted on average more than 5 μm2, which is characteristic for ratchet‐like constriction. Non‐constricting cells in the activated region (AR, non‐con.) displayed a mean difference in apical area per pulse of about 0, reflecting non‐ratchet constrictions meaning that pulsing cells constricted but relaxed subsequently back to their initial size. Constricting cells in the activated region (AR, con.) show an intermediate behavior with less efficient constrictions than in the NR. Data points are significantly different as determined by ANOVA (F(2, 539) = 72.04, P = 1.9e‐28) and post hoc Tukey's test. (D) The pulsation period (T). All cells pulse with a period of about 90 s. There were no statistically significant differences between group means as determined by one‐way ANOVA (F(2, 540) = 1.438, P = 0.24). (C and D) Red dots indicate the mean values, and the error bars represent the standard deviation. More than 500 pulses (n NR = 119, n AR, non‐con = 128, n AR, con = 295) of more than 100 cells were analyzed.
- E
Diagram showing the prevalence of cells in the photo‐activated region that constricted (con.) and that did not constrict (Non‐con.). More than 4/5 of the cells did not constrict to half of the initial area (N = 5 embryos; n: 407 cells; Cohen's D: d = 10). In each box plot, the central mark, the bottom, and the top edge of each box indicate the median, the 25th percentile, and 75th percentile, respectively. Whiskers extent to the most extreme data point.
- F, G
Graphs showing the average apical area (F) and anisotropy (G) of cells in the non‐activated region (green), in the activated region that constricted (purple) and that did not constrict (red). The straight line indicates the mean value at a given time point, the semi‐transparent colored area indicated the respective standard deviation. Cells in the non‐activated region constricted efficiently and progressively acquired anisotropy. Constricting cells in the activated region constricted slower in an isotropic manner. Non‐constricting cells in the activated region did not show net decrease in apical area and gain of anisotropy (n NR = 34, n AR, non‐con = 20, n AR, con = 59).
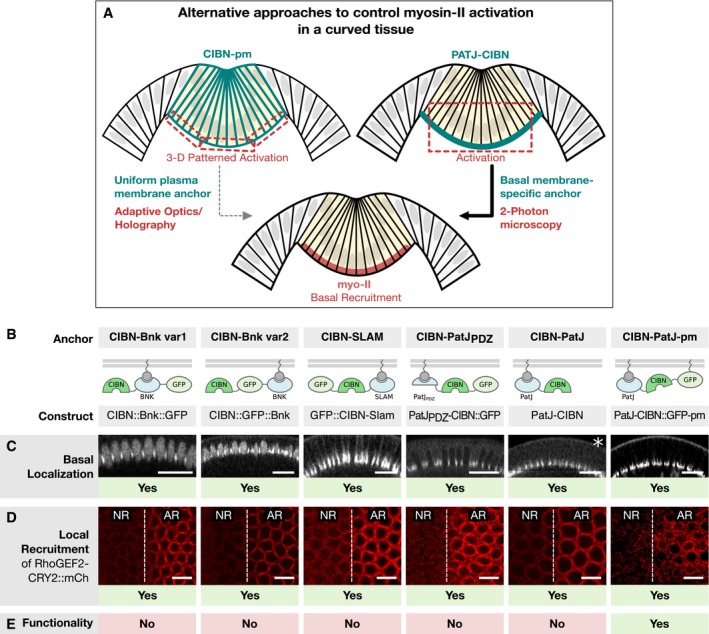
- A
Schematic illustration of two alternative approaches to control myosin‐II activation in a curved tissue. In order to restrict the region of activation in a curved tissue to the basal surface using a uniformly distributed optogenetic anchor such as the CIBNpm anchor (left), the photo‐activation pattern needs to account for the tissue curvature and the region of activation needs to be corrected in 3D using adaptive optics and holography. An alternative approach is to engineer an optogenetic anchor that specifically localizes to the cell base. In this scenario, a bigger focal volume can be photo‐activated while still resulting in the restricted recruitment of RhoGEF2‐CRY2 to the cell base.
- B
Three different proteins, which have been reported to localize to the cell base during early Drosophila development, were expressed as CIBN fusion proteins in different configurations. Bottleneck (CIBN::Bnk::GFP, CIBN::GFP::Bnk), Slam (GFP‐CIBN‐Slam), and PatJ (PatJPDZ‐CIBN::GFP, PatJ::CIBN, PatJ‐CIBN::GFP‐CAAX).
- C–E
Embryos expressing either of the optogenetic anchor proteins and RhoGEF2‐CRY2::mCherry were imaged during late cellularization. (C) z‐projections of confocal image stacks show the localization of the respective GFP‐tagged optogenetic anchor. Please note that the construct PatJ‐CIBN (indicated by asterisk) lacks a fluorescent marker and its localization was thus inferred from the recruited RhoGEF2‐CRY2::mCh. All anchor proteins showed predominantly basal localization during cellularization and at the onset of ventral furrow formation. Scale bars, 20 μm. (D) A region of interest (right side of the dashed line) in a 10‐μm‐sized stack was photo‐activated using two‐photon illumination for 30 s before acquiring the RhoGEF2‐CRY2::mCherry signal using confocal microscopy. All anchor proteins were able to recruit RhoGEF2‐CRY2::mCherry specifically to the activated region. Scale bars, 10 μm. (E) Although all basal anchors were effective at recruiting RhoGEF2‐CRY2::mCherry to the cell base, only PatJ‐CIBN::GFPpm resulted in effective myosin‐II recruitment and actomyosin ring constriction.
- A
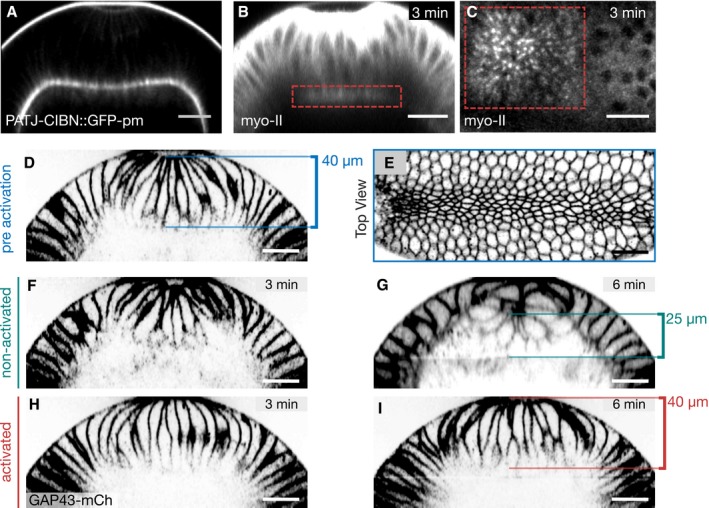
Localization of the basal‐specific optogenetic anchor CIBN‐PatJ::GFPpm during ventral furrow formation. Embryos expressing CIBN‐PatJ::GFPpm were imaged using two‐photon excitation during ventral furrow formation. Transverse cross section (z‐projection) at a stage when cells were already apically constricted and elongated, and the ventral tissue already internalized.
- B–I
Embryos co‐expressing CIBN‐PatJ::GFPpm, RhoGEF2‐CRY2, and Sqh::mCherry (B, C) or the membrane marker GAP43::mCherry (D–I) were mounted with the ventral tissue facing the objective. After cells underwent apical constriction and cell elongation, the basal volume of the ventral cells was photo‐activated using two‐photon illumination and the myosin‐II signal was recorded in alternation. (B) Myosin‐II distribution in a cross section (z‐projection) 3 min after photo‐activation. Myosin‐II was locally recruited to the base as indicated by the red dashed square in the activated region (red line). (C) Top view (sum of slice of 4‐μm‐sized image stack) showing basal myosin‐II recruitment in the photo‐activated region (red dashed square). (D) Cross section (z‐projection) showing the plasma membrane and (E) top view showing the apical plasma membrane at the initial time point before photo‐activation. At this stage, the central mesodermal tissue has started to internalize and cells were constricted at the apical surface. In an alternating fashion, the base of the cells in the anterior half of the embryo (left) was photo‐activated for 100 s and the GAP43::mCherry signal in the entire field of view was recorded. The furrow further ingressed and closed completely 3 min (F) and 6 min (G) after initial activation, respectively. In the activated region, the tissue failed to internalize and to form a closed furrow both at 3 min (H) and 6 min (I) after initial photo‐activation. The width of the central tissue forming the ventral furrow at the initial point of the experiment is 40 μm (D). In the non‐activated region 6 min after initial activation, the width of the tissue shrank to about 25 μm (G), whereas it remained constant at 40 μm in the activated region (I).
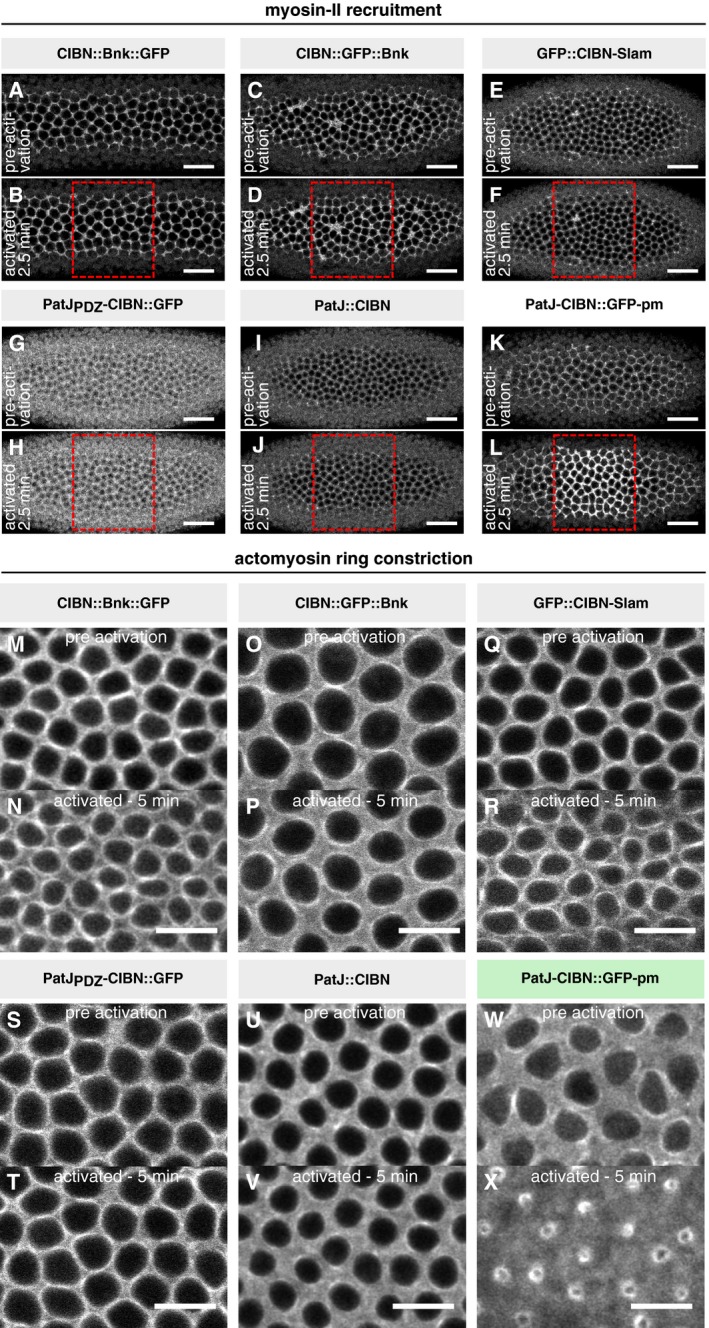
- A–L
Embryos co‐expressing RhoGEF2‐CRY2, Sqh::mCherry, and the indicated basal‐specific anchors (A,B: CIBN::Bnk::GFP; C, D: CIBN::GFP::Bnk; E, F: GFP‐CIBN‐Slam; G, H: PatJPDZ‐CIBN::GFP; I, J: PatJ‐CIBN; K, L: PatJ‐CIBN::GFPpm) were photo‐activated using one photon illumination (488 nm) within a region of interest (red dashed box). Myosin‐II signal (Sqh::mCherry) was recorded prior and after photo‐activation. Representative image (N ≥ 2) showing the initial actomyosin network before (A, C, E, G, I, and K) and 2.5 min after photo‐activation (B, D, F, H, J, and L). Scale bar, 20 μm.
- M–X
Embryos co‐expressing the indicated basal anchors, RhoGEF2‐CRY2 and Sqh::mCh were photo‐activated using one photon illumination (488 nm), and Sqh::mCh was recorded simultaneously to visualize myosin‐II recruitment and effects on the actomyosin network during cellularization. The upper panels (M, O, Q, S, U, W) show the basal actomyosin network before photo‐activation and the lower panels (N, P, R, T, V, X) 5 min after continuous photo‐activation demonstrating that only in the presence of CIBN‐PatJ::GFPpm, actomyosin ring constricted. Scale bar, 10 μm.
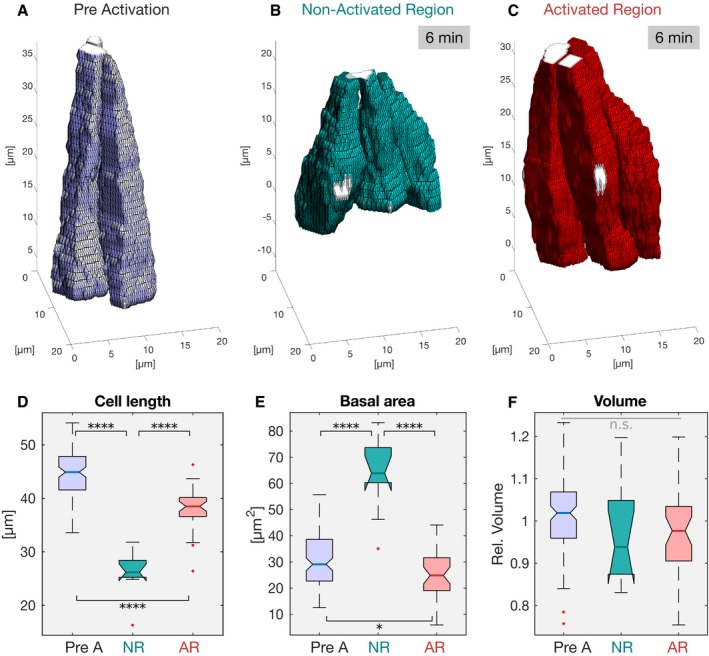
- A–C
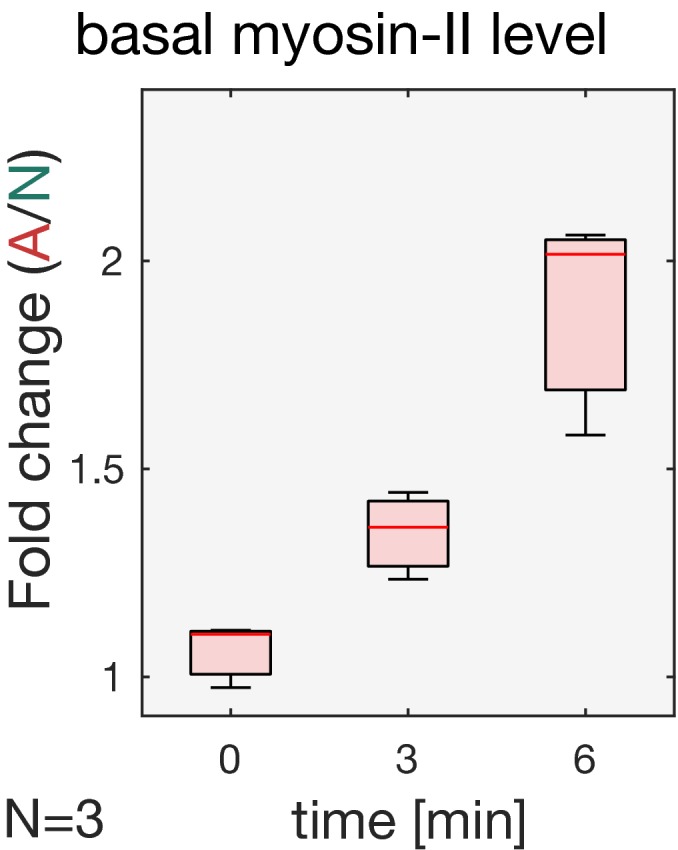
Embryos co‐expressing CIBN‐PatJ::GFPpm, RhoGEF2‐CRY2::mCherry, and the membrane marker GAP43::mCherry were photo‐activated at the cell base after cells had already apically constricted. (A) Prior to photo‐activation, cells were apically constricted and elongated. (B) In the non‐activated region, within 6 min cells expanded their base and shorten. (C) In the photo‐activated region, cell shortening was inhibited.
- D–F
Cellular features extracted from the reconstructed cell shapes displayed in boxplots [pre A: pre‐activation (n pre A = 107), initial time point; NR: non‐activated region (n NR = 10); AR: activated region (n AR = 37)]. The central mark, the bottom, and the top edge of each box indicate the median, 25th percentile, and 75th percentile, respectively. Whiskers extent to the most extreme data point and the “+” symbol indicates an outlier. Notches indicate comparison intervals. (D) The mean cell length at the initial time point was 45 μm (blue). 6 min after, the non‐activated cells (green) shrank to about half of the size (26 μm), whereas photo‐activated cells (red) only shrank to 39 μm. ANOVA result: F(2, 151) = 110.2, P = 3e‐30; Cohen's D: d > 1.5 for all comparisons. (E) The basal area in the pre‐activation control of 30 μm enlarged to 60 μm in the non‐photo‐activated cells, but remained at 30 μm in the activated region. ANOVA result: F(2, 151) = 52.02, P = 6.5e‐18; Cohen's D: d preA:NR, d AR:NR > 2, d preA:AR < 0.5. (F) The cell volume did not change between the different conditions. There were no statistically significant differences between group means as determined by one‐way ANOVA (F(2, 151) = 2.227, P = 0.11). In all panels, ****P ≤ 0.0001, and n.s. indicates no statistically significant differences according to two‐sample t‐test.
References
-
- Conte V, Munoz JJ, Baum B, Miodownik M (2009) Robust mechanisms of ventral furrow invagination require the combination of cellular shape changes. Phys Biol 6: 016010 - PubMed
-
- Dawes‐Hoang RE, Parmar KM, Christiansen AE, Phelps CB, Brand AH, Wieschaus EF (2005) folded gastrulation, cell shape change and the control of myosin localization. Development 132: 4165–4178 - PubMed
-
- Gibson DG, Young L, Chuang RY, Venter JC, Hutchison CA III, Smith HO (2009) Enzymatic assembly of DNA molecules up to several hundred kilobases. Nat Methods 6: 343–345 - PubMed
MeSH terms
Substances
LinkOut - more resources
Full Text Sources
Other Literature Sources
Molecular Biology Databases
